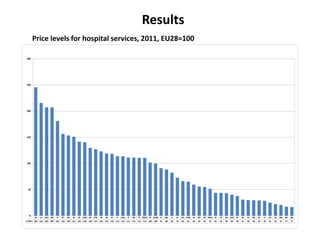
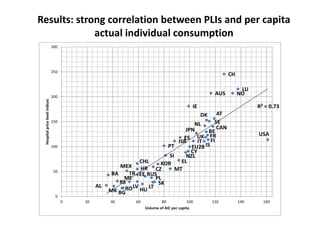
Best VIP Call Girls Noida Sector 18 Call Me: 8448380779
Comparing Hospital Health Prices and Volumes Across Countries
1. Comparing hospitals and health prices and
volumes across countries: a new approach
Francette Koechlin (OECD), Paul
Konijn(Eurostat), Luca Lorenzoni
(OECD) and Paul Schreyer (OECD)
Presentation by Mary O’Mahony (KCL) to the
IARIW 33rd General Conference
Rotterdam, The Netherlands, August 24-30, 2014
2. Context
• In the past volume of outputs of non-market
services were estimated by volumes of inputs
– Implies zero productivity growth
• OECD, Eurostat and others have worked towards
producing output-based measures of the volume
of these services and growth over time
• This paper looks at the spatial aspect, comparing
across countries
• Requires spatial price indices (PPPs) to deflate
current price aggregates to compare the volume
of output between countries
3. Context
• Previous estimates of PPPs include one for
health
– But based on input prices
• Using GDP PPPs instead is inaccurate as
evidence suggests that medical treatment
prices have been growing faster than other
goods and services
• Hence a need for new measures
4. Methodology: Hospital services
• Three problems in measuring PPPs
– Identifying products that are comparable across
countries
– representativeness of products
– no meaningful market price for comparison
• Requires implementation of an output survey of
hospital services
• A hospital output (case type ) refers to a hospital
service that is similar from a clinical perspective
and in terms of its consumption of resources.
5. Methodology: Hospital services
• Distinguish two case types, medical and
surgical
• Use ICD to identify cases
• Cases included were common procedures or
diagnoses and account for a significant
percentage of hospital expenditure.
• International comparability of product
classification systems is limited for Diagnosis
Related Groups (DRG)-type systems.
6. Sample of Services
• 21 in-hospital surgical cases, plus four surgical
case types using outpatient procedures
• 7 medical case types (no operating room
procedure are performed)
• Only ‘standard’ hospitalisation cases
– Omit very long stays or transfers
• Use ‘quasi-prices’ - costs per unit of case type
– (unobserved) ‘prices’ that emulate a competitive
situation where prices equal average costs per
product
7. Estimating ‘quasi prices’
• in many OECD countries, systems have been put in place
to approximate the monetary value of services provided
by hospitals.
• These provide, in theory, an indication of the
purchasers’ willingness-to-pay (usually government or
insurer)
• and the providers’ willingness-to-accept these values as
the price for hospital services.
• Use administrative data to estimate these ‘quasi prices’
• Can be negotiated price or administered price but need
to include direct costs, capital costs and overheads
8. Data
• Survey collected data for 2011 on hospital activity
and quasi-prices for a basket of 32 hospital
products, using a standardized questionnaire.
• 31 European and 7 non-European with PPPs for
the remaining OECD countries estimated
according to the input approach.
• The number of cases were also collected and
used to calculate values and share weights.
• Derived (PLIs) price level indices (ratios of PPPs to
exchange rates).
9. Results
Price levels for hospital services, 2011, EU28=100
CH LU AUS NO IE AT DK SE NL CAN BE JPN FR UK ES FI USA IT ISR IS OECD PT EU28 CY NZL SI EL CHL KOR CZ MT HR MEX EE TR BA RUS PL RS LV ME SK LT HU AL MK RO BG
300
250
200
150
100
50
0
2011 246 216 207 207 181 156 153 151 142 140 130 127 123 119 118 114 114 111 111 111 111 102 100 91 88 82 73 66 65 60 56 55 52 44 44 43 40 38 31 30 30 29 29 25 22 21 17 17
10. Results
• 3 clusters of countries: 15 mainly CEE and
Western Balkan countries with PLIs below 50,
• 8 with PLIs above 150 (CH, Australia,
Scandinavian countries, Ireland)
• 23 PLIs between 50 and 150 (includes US,
large EU-15 countries, New Zealand, Japan)
11. Results: strong correlation between PLIs and per capita
actual individual consumption
CH
LU
AUS NO
IE
DK AT
NL SE
CAN
JPN BE
ES UK FR ISR IT FI
IS
USA
PT EU28
CY
SI NZL
CHL KOR EL
HR CZ MT MEX
BA TR EE RUS
PL
RS
LV
ME
SK
LT
HU
AL
MK RO
BG
R² = 0.73
300
250
200
150
100
50
0
0 20 40 60 80 100 120 140 160
Hospital price level indices
Volume of AIC per capita
12. Results
• No correlation with average length of stay
• Not clear that quality is adequately taken into
account
– Some captured by stratification
– could look at types of treatment, different
procedures to cure same disease
– Or overall measures such as mortality, waiting
times etc.
13. Total Health Expenditures
• Combine information from the System of Health
Accounts (SHA) with the standard national
accounts expenditure aggregates for health.
• Estimates shares for each of 10 categories
• Use hospital and other PPPs to estimate PLIs
– spread of health PLIs is less pronounced than that of
hospital PLIs
– includes also health products, such as
pharmaceuticals and therapeutic appliances which are
tradable
14. Per Capita Volumes: Comparisons between input measures,
output measures and actual individual consumption
USA DE BE NO CH OECD FR FI DK IS NZL SWE UK CAN NL EU28 LU JPN IE IT MT AUS AT KOR EL CZ HU SK SI LT ES PL RO PT HR CY ISR EE BG LV RS CHL RUS TR ME MK BA MEX AL
250
200
150
100
50
0
Input method 200 130 119 136 139 117 115 112 120 120 104 117 112 101 108 100 127 105 101 88 97 105 101 99 87 84 70 68 87 72 93 71 55 83 70 67 68 56 51 47 50 53 50 43 41 30 25 28 25
Output method 201 136 124 122 117 115 115 115 114 109 104 104 102 102 100 100 99 97 94 93 93 91 90 89 87 85 84 82 81 81 80 75 74 73 68 68 60 59 58 52 48 45 44 42 37 33 26 25 24
AIC 161 123 113 134 127 110 114 114 113 111 97 115 113 118 112 100 138 105 99 103 85 117 119 75 92 72 63 73 81 71 93 70 48 80 59 99 88 59 47 59 44 59 65 59 53 41 36 51 35
Input
method
Output
method
AIC
15. Per capita volumes
• Output-based methodology appears to reduce
the per capita volume indices for health for most
Nordic countries as well as Luxembourg,
Switzerland, Australia, Spain and Austria.
• Per capita volume indices are higher with the
new methodology for a number of CEE countries.
• Aggregate per capita volume indices are more
equal across countries when health-specific PPPs
are used
– price level indices for health vary more across
countries than price level indices for GDP
16. Commentary
• Sound methodology with plausible conclusions
– Increases price level of health products in high income
countries and lowers them in low income countries
• More work needed on
– non-hospital medical spending
– Quality adjustments
• Restriction to ‘standard’ conditions – is this valid?
– Aging society, more comorbidities
• Are the PPPs published?