Download as PDF, PPTX


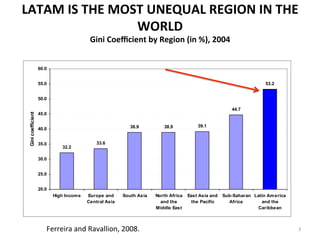


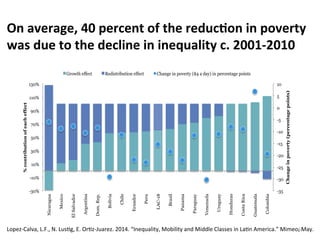


- Inequality in Latin America is high but has been declining significantly since around 2000. This decline has contributed to reductions in poverty and growth of the middle class. - The decline in inequality is seen across most Latin American countries, regardless of political ideology or economic growth levels. It has been driven mostly by declining inequality of wages and more progressive social transfers. - On average, about 40% of the reduction in poverty across Latin America between 2001-2010 can be attributed to the decline in inequality rather than solely economic growth.


