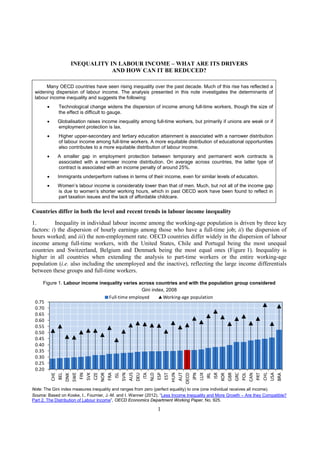
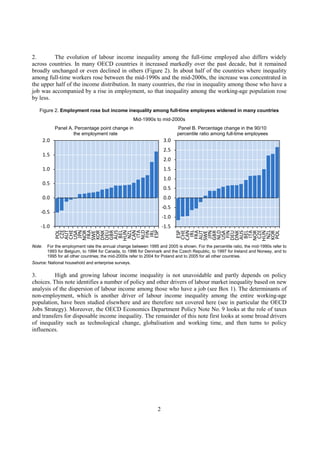
This document analyzes drivers of inequality in labor income and policies that can reduce it. Technological change and globalization contribute to wider income dispersion among full-time workers, though unions and employment protections can moderate these effects. Higher education attainment is generally associated with narrower income distribution. Temporary contracts, gender gaps, and immigrant underperformance also impact inequality. Policy options like more equitable education, moderate job protections, higher minimum wages, and stronger unions can help compress labor income differences across countries.
The 2014 edition of the OECD Employment Outlook reviews recent labour market trends and short-term prospects in OECD and key emerging economies. It zooms in on how the crisis has affected earnings, provides country comparisons of job quality, examines the causes and consequences of non-regular employment, and estimates the impact of qualifications and skills on labour market outcomes.
Project abstract or effective unemployment of somaliaMohamedAli47986
This project is written by Mohamed Ali from Somalia, in my idea I would be very grateful you to share with you the main causes of Somali youth unemployment.
Giving Them an Edge? The Effects of Work Experience on the Employment Prospec...The Rockefeller Foundation
This brief summarizes the results of NCLR’s quantitative analysis of the marginal effects of work experience on the employment prospects of millennials. It focuses on Latino young men, offering an overview of the structural barriers, an investigation of whether and to what extent additional work experience gives millennials a competitive edge in today’s hypercompetitive labor market, and recommendations to ensure that they fully leverage their work to maximize their potential in the labor market. In particular, this brief will examine the labor market outcomes of Latinos, the youngest and fastest-growing segment of the American labor force.
HLEG thematic workshop on Measurement of Well Being and Development in Africa...StatsCommunications
HLEG thematic workshop on Measurement of Well Being and Development in Africa, 12-14 November 2015, Durban, South Africa, More information at: www.oecd.org/statistics/measuring-economic-social-progress
Global unemployment will reach 202 million people in 2013, including almost 74 million youth. Rising skills mismatch and persistently high uncertainty in hiring prevents a faster return of employment. Slowing structural change and weak labour productivity growth hampers faster reduction of working poverty in developing countries. The only green spot: Rising middle class employment in emerging countries can help rebalance global growth over the medium run.
Driven by long‐term shifts in the labor market and on‐going poverty and inequality, youth employment challenges have mounted steadily over the last decade and reached a crisis point in the wake of the Great Recession. Youth unemployment in 2010 reached its highest level since World War II. The short‐ and long‐term consequences of youth unemployment are severe. Individuals who fail to
transition to stable jobs by their early 20s are at risk of experiencing more frequent and prolonged spells of joblessness, permanently lower earnings, and greater difficulty building a secure financial future for themselves and their families. Ultimately, youth unemployment and associated challenges threaten to perpetuate cycles of intergenerational poverty for individuals and communities.
The 2014/15 edition examines the link between wages and inequality at the household level. It shows that wages constitute the largest single source of income for households with at least one member of working age in most countries and points to changes in wages and paid employment as key factors underlying recent trends in inequality. The report also considers wage gaps between certain groups, such as those between women and men, migrants and nationals, and workers in the informal and formal economy.
Inequality can be addressed through policies that affect wage distribution directly or indirectly, as well as through fiscal redistribution. However, increasing inequality in the labour market places a heavier burden on efforts to reduce inequality through taxes and transfers. The report thus emphasizes the need for combined policy action that includes minimum wages, strengthened collective bargaining, interventions to eliminate wage gaps, the promotion of paid employment and redistribution through taxes and transfers.
unemployment in spain, causes and remedies .pptxMgirehBryan
Spain is faced with high unemployment rates since the 1980s. the country consistently ranks among the highest within the European Union with unemployment rate of 11.6% in the third quarter of 2023, which translates up to 2.77 million individuals , according to Statista. the uemployment rate average of the EU is 6.4%. The World bank indicates that the youth unemployment rate is at a concerning 27%. unemployment rates for individuals under 25 years old were above 50% in 2012, 2013, and 2014 but there has been significant decreases in this rates since 2017 where it was determined to be at around 35% (Verd et al., 2019). This prolonged period of elevated youth unemployment has had profound socio-economic repercussions, affecting not only the individuals directly impacted but also the broader economy and society as a whole.
socio-demographic characteristics and career trajectories contributes to this high unemployment rates in spain.
Rolph van der Hoeven -Employment, basic needs, structural adjustment, human development, poverty
Presentation given at conference on 17/18 November in honour of Sir Richard Jolly
The Hays Global Skills Index is the only comprehensive overview of the professional global labour market and examines the challenges faced by organisations as they search for the most sought-after skills. Our latest edition provides an analysis of the employment markets and economic status of 33 countries, featuring insights from Hays experts across the globe.
The Hays Global Skills Index is the only comprehensive overview of the professional global labour market and examines the challenges faced by organisations as they search for the most sought-after skills. Our 2012 edition provides an analysis of the employment markets and economic status of countries, featuring insights from Hays experts across the globe.
Presentation on "Well-being in Regions: building more coherent policies for a better growth model" made at the Hvordan får vi nyt liv i væksten? [How do we spark growth?], Copenhagen Denmark, 2 May 2014, by by Joaquim Oliveira Martins, Head, Regional Development Policy Division & Monica Brezzi, Head of Statistics Unit,OECD. For more information see www.oecd.org/regional/how-is-life-in-your-region.htm.
Education and Earnings Inequality in CameroonAJHSSR Journal
Poverty and wage earnings inequality have co-existed for generations both in developed and
developing nations, and in spite of the multiple interventions, the progress in eliminating this problem remains
elusive. It is from the above count that this study was designed to capture the impact of education on wage
earnings and inequality in Cameroon across sectors of employment using OLS and factual/counterfactual test of
inequality as the technique to analyse data from CLFS 2010. The results obtained revealed that in Cameroon as
a whole, Sector of employment, Work experience, Years of education, Age, and Household size are very
instrumental in explaining wage earnings. However, disintegrating the Cameroonian economy into sectors of
employment made marital status to be significant in the public sector in addition to Years of education, Age and
Household size that were also significant in the overall results while in the private sector only years of education
and household size are significant in explaining wage earnings. Thus working experience is significant only in
the overall results but failed to be significant when disaggregated into sectors of employment. However, years of
education which is our main explanatory variable revealed very significant importance in explaining wage
earnings, be it in Cameroon overall or in the public and private sectors of employment individually.Also from
the inequality test results, the gini coefficient is higher in the factual results than in the counterfactual results in
Cameroon specifically in the public sector while in the private sector the gini coefficient is higher in the
counterfactual than in the factual. This shows that in Cameroon as well as in the public sector, the varied level
of education in the factual results account for greater wage inequality than equalizing years of education in the
factual results while in the private sector the varied level of education in the factual results reduces inequality
compared to equalizing years of education in the counterfactual results. It is thus recommended that education
for all should be encouraged not only at the primary level as spelt out in the development goals but even at
tertiary levels. This can be done by sensitizing the parents on the importance of education for the children as
well as offering study leave possibilities to most workers. It can also be done by further subsidizing education at
the tertiary level and providing adequate educational infrastructures
Presentation by OECD Chief Economist, Laurence Boone, on Inclusive Growth at the farewell conference in honor of Governor Karnit Flug, The Van Leer Institute in Jerusalem, 4 November 2018
Efeitos de crescimento das reformas estruturais na Europa do Sul - 511: O cas...Cláudio Carneiro
Este trabalho desenvolve um modelo de crescimento semi-endógena para analisar os efeitos intertemporais das reformas estruturais nos países do sul da Europa (Itália, Espanha, Portugal e Grécia). O modelo segue o paradigma variedade de produtos em um ambiente semi-endógena, e inclui uma desagregação do trabalho em grupos diferentes de habilidade. Nós usamos um conjunto abrangente de indicadores estruturais, a fim de calibrar o modelo de relações macroeconômicas importantes e os níveis de produtividade e do emprego. Nossos resultados mostram que as reformas estruturais produzir ganhos econômicos significativos a médio e longo prazo. Os resultados apontam para a importância das reformas dos mercados de produtos e de reformas educacionais e fiscais do mercado de trabalho como as áreas mais promissoras de intervenções de política estrutural. Este documento também defende a colocar mais ênfase na política de educação que é fundamental na melhoria da força de trabalho, especialmente naqueles países onde a percentagem de trabalho pouco qualificado está entre as mais altas na área do euro.
The Hays Global Skills Index is the only comprehensive overview of the professional global labour market and examines the challenges faced by organisations as they search for the most sought-after skills. Our 2013 edition provides an analysis of the employment markets and economic status of countries, featuring insights from Hays experts across the globe.
how to sell pi coins in South Korea profitably.DOT TECH
Yes. You can sell your pi network coins in South Korea or any other country, by finding a verified pi merchant
What is a verified pi merchant?
Since pi network is not launched yet on any exchange, the only way you can sell pi coins is by selling to a verified pi merchant, and this is because pi network is not launched yet on any exchange and no pre-sale or ico offerings Is done on pi.
Since there is no pre-sale, the only way exchanges can get pi is by buying from miners. So a pi merchant facilitates these transactions by acting as a bridge for both transactions.
How can i find a pi vendor/merchant?
Well for those who haven't traded with a pi merchant or who don't already have one. I will leave the telegram id of my personal pi merchant who i trade pi with.
Tele gram: @Pi_vendor_247
#pi #sell #nigeria #pinetwork #picoins #sellpi #Nigerian #tradepi #pinetworkcoins #sellmypi
USDA Loans in California: A Comprehensive Overview.pptxmarketing367770
USDA Loans in California: A Comprehensive Overview
If you're dreaming of owning a home in California's rural or suburban areas, a USDA loan might be the perfect solution. The U.S. Department of Agriculture (USDA) offers these loans to help low-to-moderate-income individuals and families achieve homeownership.
Key Features of USDA Loans:
Zero Down Payment: USDA loans require no down payment, making homeownership more accessible.
Competitive Interest Rates: These loans often come with lower interest rates compared to conventional loans.
Flexible Credit Requirements: USDA loans have more lenient credit score requirements, helping those with less-than-perfect credit.
Guaranteed Loan Program: The USDA guarantees a portion of the loan, reducing risk for lenders and expanding borrowing options.
Eligibility Criteria:
Location: The property must be located in a USDA-designated rural or suburban area. Many areas in California qualify.
Income Limits: Applicants must meet income guidelines, which vary by region and household size.
Primary Residence: The home must be used as the borrower's primary residence.
Application Process:
Find a USDA-Approved Lender: Not all lenders offer USDA loans, so it's essential to choose one approved by the USDA.
Pre-Qualification: Determine your eligibility and the amount you can borrow.
Property Search: Look for properties in eligible rural or suburban areas.
Loan Application: Submit your application, including financial and personal information.
Processing and Approval: The lender and USDA will review your application. If approved, you can proceed to closing.
USDA loans are an excellent option for those looking to buy a home in California's rural and suburban areas. With no down payment and flexible requirements, these loans make homeownership more attainable for many families. Explore your eligibility today and take the first step toward owning your dream home.
If you are looking for a pi coin investor. Then look no further because I have the right one he is a pi vendor (he buy and resell to whales in China). I met him on a crypto conference and ever since I and my friends have sold more than 10k pi coins to him And he bought all and still want more. I will drop his telegram handle below just send him a message.
@Pi_vendor_247
Poonawalla Fincorp and IndusInd Bank Introduce New Co-Branded Credit Cardnickysharmasucks
The unveiling of the IndusInd Bank Poonawalla Fincorp eLITE RuPay Platinum Credit Card marks a notable milestone in the Indian financial landscape, showcasing a successful partnership between two leading institutions, Poonawalla Fincorp and IndusInd Bank. This co-branded credit card not only offers users a plethora of benefits but also reflects a commitment to innovation and adaptation. With a focus on providing value-driven and customer-centric solutions, this launch represents more than just a new product—it signifies a step towards redefining the banking experience for millions. Promising convenience, rewards, and a touch of luxury in everyday financial transactions, this collaboration aims to cater to the evolving needs of customers and set new standards in the industry.
Exploring Abhay Bhutada’s Views After Poonawalla Fincorp’s Collaboration With...beulahfernandes8
The financial landscape in India has witnessed a significant development with the recent collaboration between Poonawalla Fincorp and IndusInd Bank.
The launch of the co-branded credit card, the IndusInd Bank Poonawalla Fincorp eLITE RuPay Platinum Credit Card, marks a major milestone for both entities.
This strategic move aims to redefine and elevate the banking experience for customers.
how to sell pi coins effectively (from 50 - 100k pi)DOT TECH
Anywhere in the world, including Africa, America, and Europe, you can sell Pi Network Coins online and receive cash through online payment options.
Pi has not yet been launched on any exchange because we are currently using the confined Mainnet. The planned launch date for Pi is June 28, 2026.
Reselling to investors who want to hold until the mainnet launch in 2026 is currently the sole way to sell.
Consequently, right now. All you need to do is select the right pi network provider.
Who is a pi merchant?
An individual who buys coins from miners on the pi network and resells them to investors hoping to hang onto them until the mainnet is launched is known as a pi merchant.
debuts.
I'll provide you the Telegram username
@Pi_vendor_247
BYD SWOT Analysis and In-Depth Insights 2024.pptxmikemetalprod
Indepth analysis of the BYD 2024
BYD (Build Your Dreams) is a Chinese automaker and battery manufacturer that has snowballed over the past two decades to become a significant player in electric vehicles and global clean energy technology.
This SWOT analysis examines BYD's strengths, weaknesses, opportunities, and threats as it competes in the fast-changing automotive and energy storage industries.
Founded in 1995 and headquartered in Shenzhen, BYD started as a battery company before expanding into automobiles in the early 2000s.
Initially manufacturing gasoline-powered vehicles, BYD focused on plug-in hybrid and fully electric vehicles, leveraging its expertise in battery technology.
Today, BYD is the world’s largest electric vehicle manufacturer, delivering over 1.2 million electric cars globally. The company also produces electric buses, trucks, forklifts, and rail transit.
On the energy side, BYD is a major supplier of rechargeable batteries for cell phones, laptops, electric vehicles, and energy storage systems.
when will pi network coin be available on crypto exchange.DOT TECH
There is no set date for when Pi coins will enter the market.
However, the developers are working hard to get them released as soon as possible.
Once they are available, users will be able to exchange other cryptocurrencies for Pi coins on designated exchanges.
But for now the only way to sell your pi coins is through verified pi vendor.
Here is the telegram contact of my personal pi vendor
@Pi_vendor_247
Even tho Pi network is not listed on any exchange yet.
Buying/Selling or investing in pi network coins is highly possible through the help of vendors. You can buy from vendors[ buy directly from the pi network miners and resell it]. I will leave the telegram contact of my personal vendor.
@Pi_vendor_247
how to sell pi coins in all Africa Countries.DOT TECH
Yes. You can sell your pi network for other cryptocurrencies like Bitcoin, usdt , Ethereum and other currencies And this is done easily with the help from a pi merchant.
What is a pi merchant ?
Since pi is not launched yet in any exchange. The only way you can sell right now is through merchants.
A verified Pi merchant is someone who buys pi network coins from miners and resell them to investors looking forward to hold massive quantities of pi coins before mainnet launch in 2026.
I will leave the telegram contact of my personal pi merchant to trade with.
@Pi_vendor_247
How to get verified on Coinbase Account?_.docxBuy bitget
t's important to note that buying verified Coinbase accounts is not recommended and may violate Coinbase's terms of service. Instead of searching to "buy verified Coinbase accounts," follow the proper steps to verify your own account to ensure compliance and security.
what is the future of Pi Network currency.DOT TECH
The future of the Pi cryptocurrency is uncertain, and its success will depend on several factors. Pi is a relatively new cryptocurrency that aims to be user-friendly and accessible to a wide audience. Here are a few key considerations for its future:
Message: @Pi_vendor_247 on telegram if u want to sell PI COINS.
1. Mainnet Launch: As of my last knowledge update in January 2022, Pi was still in the testnet phase. Its success will depend on a successful transition to a mainnet, where actual transactions can take place.
2. User Adoption: Pi's success will be closely tied to user adoption. The more users who join the network and actively participate, the stronger the ecosystem can become.
3. Utility and Use Cases: For a cryptocurrency to thrive, it must offer utility and practical use cases. The Pi team has talked about various applications, including peer-to-peer transactions, smart contracts, and more. The development and implementation of these features will be essential.
4. Regulatory Environment: The regulatory environment for cryptocurrencies is evolving globally. How Pi navigates and complies with regulations in various jurisdictions will significantly impact its future.
5. Technology Development: The Pi network must continue to develop and improve its technology, security, and scalability to compete with established cryptocurrencies.
6. Community Engagement: The Pi community plays a critical role in its future. Engaged users can help build trust and grow the network.
7. Monetization and Sustainability: The Pi team's monetization strategy, such as fees, partnerships, or other revenue sources, will affect its long-term sustainability.
It's essential to approach Pi or any new cryptocurrency with caution and conduct due diligence. Cryptocurrency investments involve risks, and potential rewards can be uncertain. The success and future of Pi will depend on the collective efforts of its team, community, and the broader cryptocurrency market dynamics. It's advisable to stay updated on Pi's development and follow any updates from the official Pi Network website or announcements from the team.
1. Please cite this paper as:
OECD 2012, “Inequality in labour income –
What are its drivers and how can it be
reduced?”, OECD Economics Department
Policy Notes, No. 8. January 2012.
Economics Department
Organisation for Economic Co-operation and Development
ECONOMICS DEPARTMENT POLICY NOTE No. 8
INEQUALITY IN LABOUR
INCOME – WHAT ARE ITS
DRIVERS AND HOW CAN IT
BE REDUCED?
3. 1
INEQUALITY IN LABOUR INCOME – WHAT ARE ITS DRIVERS
AND HOW CAN IT BE REDUCED?
Many OECD countries have seen rising inequality over the past decade. Much of this rise has reflected a
widening dispersion of labour income. The analysis presented in this note investigates the determinants of
labour income inequality and suggests the following:
• Technological change widens the dispersion of income among full-time workers, though the size of
the effect is difficult to gauge.
• Globalisation raises income inequality among full-time workers, but primarily if unions are weak or if
employment protection is lax.
• Higher upper-secondary and tertiary education attainment is associated with a narrower distribution
of labour income among full-time workers. A more equitable distribution of educational opportunities
also contributes to a more equitable distribution of labour income.
• A smaller gap in employment protection between temporary and permanent work contracts is
associated with a narrower income distribution. On average across countries, the latter type of
contract is associated with an income penalty of around 25%.
• Immigrants underperform natives in terms of their income, even for similar levels of education.
• Women’s labour income is considerably lower than that of men. Much, but not all of the income gap
is due to women’s shorter working hours, which in past OECD work have been found to reflect in
part taxation issues and the lack of affordable childcare.
Countries differ in both the level and recent trends in labour income inequality
1. Inequality in individual labour income among the working-age population is driven by three key
factors: i) the dispersion of hourly earnings among those who have a full-time job; ii) the dispersion of
hours worked; and iii) the non-employment rate. OECD countries differ widely in the dispersion of labour
income among full-time workers, with the United States, Chile and Portugal being the most unequal
countries and Switzerland, Belgium and Denmark being the most equal ones (Figure 1). Inequality is
higher in all countries when extending the analysis to part-time workers or the entire working-age
population (i.e. also including the unemployed and the inactive), reflecting the large income differentials
between these groups and full-time workers.
Figure 1. Labour income inequality varies across countries and with the population group considered
Gini index, 2008
Note: The Gini index measures inequality and ranges from zero (perfect equality) to one (one individual receives all income).
Source: Based on Koske, I., Fournier, J.-M. and I. Wanner (2012), “Less Income Inequality and More Growth – Are they Compatible?
Part 2. The Distribution of Labour Income”, OECD Economics Department Working Paper, No. 925.
0.20
0.25
0.30
0.35
0.40
0.45
0.50
0.55
0.60
0.65
0.70
0.75
CHE
BEL
DNK
SWE
FIN
SVK
CZE
NOR
FRA
ISL
SVN
AUS
DEU
ITA
NLD
ESP
EST
HUN
AUT
OECD
JPN
LUX
IRL
ISR
KOR
GBR
GRC
POL
CAN
PRT
CHL
USA
BRA
Full-time employed Working-age population
4. 2
2. The evolution of labour income inequality among the full-time employed also differs widely
across countries. In many OECD countries it increased markedly over the past decade, but it remained
broadly unchanged or even declined in others (Figure 2). In about half of the countries where inequality
among full-time workers rose between the mid-1990s and the mid-2000s, the increase was concentrated in
the upper half of the income distribution. In many countries, the rise in inequality among those who have a
job was accompanied by a rise in employment, so that inequality among the working-age population rose
by less.
Figure 2. Employment rose but income inequality among full-time employees widened in many countries
Mid-1990s to mid-2000s
Panel A. Percentage point change in Panel B. Percentage change in the 90/10
the employment rate percentile ratio among full-time employees
Note: For the employment rate the annual change between 1995 and 2005 is shown. For the percentile ratio, the mid-1990s refer to
1993 for Belgium, to 1994 for Canada, to 1996 for Denmark and the Czech Republic, to 1997 for Ireland and Norway, and to
1995 for all other countries; the mid-2000s refer to 2004 for Poland and to 2005 for all other countries.
Source: National household and enterprise surveys.
3. High and growing labour income inequality is not unavoidable and partly depends on policy
choices. This note identifies a number of policy and other drivers of labour market inequality based on new
analysis of the dispersion of labour income among those who have a job (see Box 1). The determinants of
non-employment, which is another driver of labour income inequality among the entire working-age
population, have been studied elsewhere and are therefore not covered here (see in particular the OECD
Jobs Strategy). Moreover, the OECD Economics Department Policy Note No. 9 looks at the role of taxes
and transfers for disposable income inequality. The remainder of this note first looks at some broad drivers
of inequality such as technological change, globalisation and working time, and then turns to policy
influences.
-1.0
-0.5
0.0
0.5
1.0
1.5
2.0
POL
CZE
AUT
CHE
USA
JPN
NOR
FRA
SWE
KOR
DNK
DEU
GBR
AUS
BEL
HUN
NZL
CAN
ITA
NLD
FIN
IRL
ESP
-1.5
-1.0
-0.5
0.0
0.5
1.0
1.5
2.0
2.5
3.0
ESP
CHE
CAN
IRL
FRA
AUT
SWE
JPN
GBR
NLD
USA
FIN
DEU
DNK
AUS
BEL
ITA
NOR
CZE
HUN
NZL
KOR
POL
5. 3
Box 1. Investigating the determinants of labour income inequality
This policy note draws on two types of datasets to assess the effect of macroeconomic developments and
structural policies on income inequality:
• Country-level data for 22 OECD countries over the period 1981 to 2008. The analysis looks at the
effect on labour income inequality of a wide range of factors, including, among others, measures of
globalisation and technological change, the share of the population with post-secondary education, and
indicators of labour market policies and institutions (the overall level of employment protection, the
level of protection of regular and temporary work, the unemployment benefit replacement rate, the ratio
of the minimum to the median wage, and union density).
• Household survey data from 32 countries in or around 2008. The analysis investigates the effect on
individual part-time and full-time workers’ income of various factors such as the number of working
hours, gender, age and the education level. In addition, the role of the sector of work, the type of work
contract (temporary versus permanent), union membership and the country of birth is explored for
those countries for which the necessary data are available.
Technological change and globalisation play some role in driving income inequality
4. New empirical analysis indicates that technological change has contributed to a rise in income
inequality among full-time workers, even though the size of the effect is difficult to pin down. The impact
on inequality might reflect that technological change reduces the demand for medium-skilled (medium-
income) workers who carry out routine tasks that can also be accomplished by computers, while increasing
the demand for low- and high-skilled workers who tend to focus on respectively abstract and manual non-
routine tasks that are harder to replace by machines. If the demand shifts are not offset by equal shifts in
the composition of labour supply (e.g. by a large enough rise in tertiary education attainment and therefore
in the supply of high-skilled workers), technological progress can reduce the income of medium-skilled
workers relative to that of both the high- and low-skilled ones.
5. Globalisation may also widen the dispersion of labour income, for example through greater
outsourcing of tasks from richer to poorer countries. To the extent that these tasks are not skill intensive
from the perspective of the rich country, but they are from the perspective of the poor country, labour
demand will become more skill intensive in both poorer and richer countries, thus increasing inequality in
both groups of countries. Another channel for trade to increase labour income inequality operates if firms
differ in their profitability and low-income workers work disproportionately in low-productivity firms that
are battered by import competition. The positive link between globalisation and inequality implied by these
two channels is supported by a growing body of studies of individual firms, but it is more difficult to
establish a robust link at the country level. New empirical evidence suggests that trade raises the dispersion
of income among full-time workers only when unions have little clout or when employment protection is
lax. However, trade seems to have more negative employment effects in the presence of strong unions.
Part-time work is an important driver of labour income inequality
6. Differences in the average number of hours worked are an important determinant of countries’
income inequality among workers. And cross-country differences in the average number of hours worked
are again likely to reflect differences in the share of part-time employment. Removing policies and
practices that distort workers’ choice of working hours should reduce income inequality among workers.
6. 4
More education seems to narrow the distribution of income in most countries
7. More education may reduce or boost income inequality, depending on where on the education
ladder the increase takes place and how well the population was educated at the outset. Specifically:
• New analysis shows that in most countries a rise in the share of workers with upper-secondary
education is associated with a decline in the dispersion of labour income among full- and part-time
workers.
• Encouraging more students to pursue tertiary studies has a more ambiguous effect on labour income
inequality. While such reforms may widen income dispersion by increasing the share of high-income
earners, these direct effects on inequality may be more than offset by a decline in the relative income
of better-educated workers.
• Ensuring greater equity in educational attainment, for example by providing high-quality basic
education for all and making educational outcomes less dependent on personal and social
circumstances, unambiguously helps to reduce labour income inequality among workers.
Poorly designed job protection increases labour income inequality among workers
8. Evidence at the household level suggests that employees on temporary contracts generally earn
less than otherwise similar employees on permanent ones – a loss that comes on top of the intrinsic lack of
job stability. On average across countries, workers on temporary contracts earn 25% less than workers on
permanent contracts (Figure 3), even if the workers have similar working hours, education, age and gender.
The income penalty is particularly high at the bottom of the income distribution, while the incomes of
high-income employees are less dependent on the type of work contract. Consequently, a general rise in
the share of workers with a temporary contract (distributed evenly across the population) should be
associated with a rise in income inequality. Consistent with this, evidence at the country level indicates that
a larger gap between employment protection on regular and temporary contracts is associated with a
greater dispersion of labour income among full-time employees.
Figure 3. Workers on temporary contracts earn less than those on permanent contracts
Median income of workers with a temporary contract as a share of median income of workers with a permanent
contract for workers with broadly similar characteristics, 2008 or latest available year
Note: The estimates control for gender, age, education and hours worked and refer to full- and part-time workers.
Source: Based on Fournier, J.-M. and I. Koske (2012), “Less Income Inequality and More Growth – Are They Compatible? Part 7. The
Drivers of Labour Earnings Inequality – An Analysis Based on Conditional and Unconditional Quantile Regressions”, OECD
Economics Department Working Paper, No. 930.
0%
10%
20%
30%
40%
50%
60%
70%
80%
90%
100%
CHE
CZE
AUS
SVK
HUN
NOR
AUT
BEL
NLD
SWE
ISL
PRT
FRA
ESP
CHL
IRL
ITA
FIN
EST
LUX
POL
CAN
SVN
DEU
JPN
GRC
KOR
7. 5
Higher union membership tends to be associated with lower income inequality
9. The influence of unions on labour income inequality among workers is a priori ambiguous and
depends on two factors: i) the number of workers who are covered by collective agreements – be it through
union membership or through administrative extensions of collective agreements – and ii) the influence of
unions on the level and dispersion of income between union and non-union members (or workers not
covered by collective agreements). New empirical evidence indicates the following:
• The income of union members is generally higher and less dispersed than that of other
workers of similar age, education and gender. The lower dispersion of income among union
members may reflect that unions push for greater income equality among their members, but
also that the incentives to join a union may vary across the income distribution.
• The effect of union membership on labour income inequality among the employed varies by
country. In Australia, Canada, Switzerland and the United States union membership appears
to raise the income of low-income workers the most, meaning that unions are beneficial for
equality among the employed. In Chile and Japan, union membership seems to boost incomes
the most for medium-income workers and in Korea it benefits all workers more or less
equally and therefore has no noticeable impact on inequality among the employed.
10. The impact of unions on inequality among all individuals of working age is even more complex
as the employment effects need to be taken into account. These depend on various factors, in particular the
power of unions and the level of centralisation and coordination of wage bargaining.
Higher minimum wages tend to be associated with a more compressed income distribution
11. A rise in the minimum wage raises the income of those at the bottom of the income distribution,
thereby contributing to greater income equality. This positive link between the level of the minimum wage
(as a ratio of the median wage) and income equality is supported by the existing empirical literature and by
new analysis of country-level data. However, if minimum wages are set too high they may limit the job
market opportunities for young and low-skilled workers, thus at least partly offsetting the inequality-
reducing effect through lower employment of these groups.
The sectoral composition of economies seems to matter little
12. Analysis of household-level data shows that in general, an economy’s sectoral composition
matters little for the distribution of labour income. One exception is financial intermediation. In countries
with a higher share of this sector in total employment labour income tends to be distributed more unevenly
as the gain from working in this sector is higher for high-income workers (Figure 4). Still, the overall
contribution of this share to cross-country differences in inequality is rather small.
8. 6
Figure 4. Workers in the financial sector enjoy an income premium, particular at the top
Income premium of working in financial intermediation rather than in manufacturing,
cross-country average, 2008 or latest available year
Note: The estimates control for gender, age, education and hours worked and refer to full- and part-time workers.
Source: Based on Fournier, J.-M. and I. Koske (2012), “Less Income Inequality and More Growth – Are They Compatible? Part 7. The
Drivers of Labour Earnings Inequality – An Analysis Based on Conditional and Unconditional Quantile Regressions”, OECD
Economics Department Working Paper, No. 930.
In most OECD countries immigrants underperform natives in terms of their labour income
13. In about two-thirds of OECD countries, foreign-born workers (workers who are born outside of
the EU in the case of EU countries) earn significantly less than natives, even for similar levels of education
(Figure 5). On average across these countries, the income penalty amounts to about 19% for the median
worker. This gap could reflect firms’ difficulties in properly assessing qualifications obtained in a foreign
country, the fact that at least some of the immigrants may have acquired their skills in a lower-quality
educational environment, immigrants’ lack of work experience in the host country, their lack of language
skills, or discrimination. In six OECD countries (Australia, Germany, Norway, Portugal, Slovenia and
Switzerland), there is no significant income gap between natives and foreigners after accounting for
differences in education, and in Chile as well as Brazil, foreign-born workers even earn more than their
native counterparts. The cross-country differences in the income gap may reflect in part differences in the
structure of the immigrant population (in terms of country of origin, timing of immigration or motivation)
and differences in countries’ policy settings, such as the availability of language courses and transparent
systems of recognising foreign qualifications.
0%
10%
20%
30%
40%
50%
60%
10 20 30 40 50 60 70 80 90
Income quantile
9. 7
Figure 5. Countries differ on the income of immigrants relative to natives
Median income of foreign-born as a share of median income of natives, 2008 or latest available year
Note: The estimates control for gender, age, education and hours worked and refer to full- and part-time workers.
Source: Based on Fournier, J.-M. and I. Koske (2012), “Less Income Inequality and More Growth – Are They Compatible? Part 7. The
Drivers of Labour Earnings Inequality – An Analysis Based on Conditional and Unconditional Quantile Regressions”, OECD
Economics Department Working Paper, No. 930.
Addressing the gender income gap could reduce inequality
14. Despite some decline over past decades, gender differences in labour income are still striking in
most OECD countries. Women are less likely to be employed than men and those who work typically earn
less than their male counterparts. Women’s shorter working hours (which partly reflect that they take on
more caring obligations for children and elderly relatives than men) play an important role in explaining
the income relative to men. However, even after fully accounting for differences in working hours and
education between men and women, a significant income gap remains, reaching over 25% for the median
worker in many OECD countries. Possible reasons include career breaks around child-birth, a financially
less favourable choice of occupation or sector of employment, but also discrimination. Policies that address
these issues – for example, improvements in the availability of formal care for children and the elderly –
therefore may help to reduce labour income inequality.
0%
20%
40%
60%
80%
100%
120%
140%
IRL
GRC
LUX
FIN
CAN
AUT
ISL
BEL
EST
ESP
ITA
SWE
DNK
FRA
USA
NLD
GBR
NOR
SVN
DEU
CHE
PRT
AUS
CHL
BRA
10. 8
Suggested further reading
The main papers providing the background to this note are:
Fournier, J.-M. and I. Koske (2012), “Less Income Inequality and More Growth – Are They Compatible?
Part 7. The Drivers of Labour Earnings Inequality – An Analysis Based on Conditional and
Unconditional Quantile Regressions”, OECD Economics Department Working Papers, No. 930.
Koske, I., Fournier, J.-M. and I. Wanner (2012), “Less Income Inequality and More Growth – Are They
Compatible? Part 2. The Distribution of Labour Income”, OECD Economics Department Working
Papers, No. 925.
Additional related papers include:
Fredriksen, K. (2012), “Less Income Inequality and More Growth – Are They Compatible? Part 6. The
Distribution of Wealth”, OECD Economics Department Working Paper, No. 929.
Hoeller, P. (2012), “Less Income Inequality and More Growth – Are They Compatible? Part 4. Top
Incomes”, OECD Economics Department Working Paper, No. 927.
Hoeller, P., I. Joumard, M. Pisu and D. Bloch (2012), “Less Income Inequality and More Growth – Are
They Compatible? Part 1. Mapping Income Inequality Across the OECD”, OECD Economics
Department Working Paper, No. 924.
Joumard, I., M. Pisu and D. Bloch (2012), “Less Income Inequality and More Growth – Are They
Compatible? Part 3. Income Redistribution via Taxes and Transfers across OECD Countries”,
OECD Economics Department Working Paper, No. 926.
Kierzenkowski, R. and I. Koske (2012), “Less Income Inequality and More Growth – Are They
Compatible? Part 8. The Drivers of Labour Income Inequality – A Review of the Recent Literature”,
OECD Economics Department Working Paper, No. 931.
OECD (2006), Boosting Jobs and Incomes – Policy Lessons from Reassessing the OECD Jobs Strategy,
OECD Publishing.
OECD (2011), Divided We Stand: Why Inequality Keeps Rising, OECD Publishing.
OECD (2012), “Income Inequality and Growth: The Role of Taxes and Transfers”, OECD Economics
Department Policy Note, No. 9.
Pisu, M. (2012), “Less Income Inequality and More Growth – Are They Compatible? Part 5. Poverty in
OECD Countries”, OECD Economics Department Working Paper, No. 928.
11.
12. ECONOMICS DEPARTMENT POLICY NOTES
This series of Policy Notes is designed to make available, to
a wider readership, selected studies which the Department
has prepared for use within OECD.
Comment on this Policy Note is invited, and may be sent to
OECD Economics Department, 2 rue André Pascal, 75775
Paris Cedex 16, France, or by e-mail to
isabell.koske@oecd.org.