Download to read offline
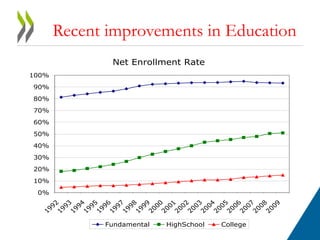
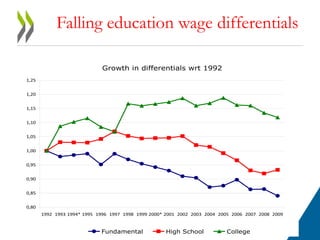
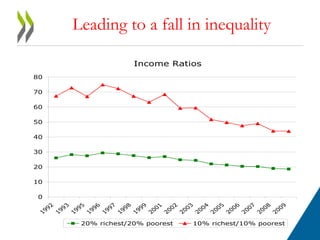
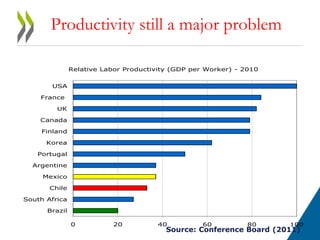
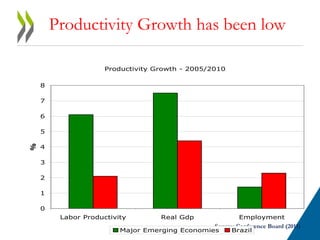

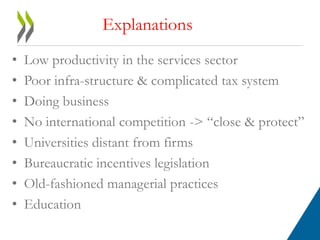
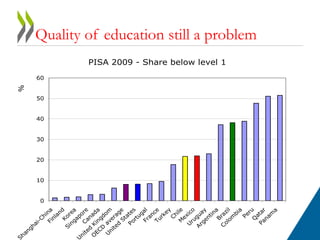
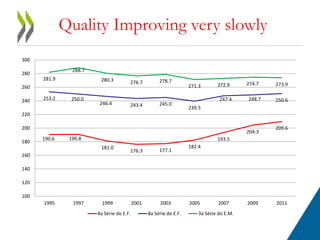
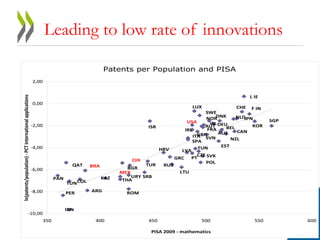
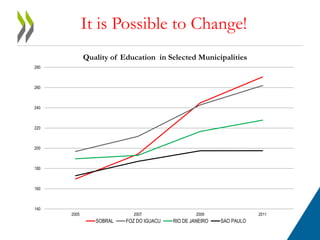
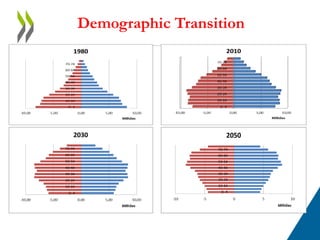

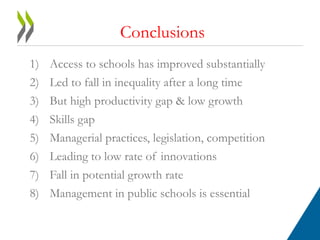

The document discusses education and inclusive growth in Brazil. It summarizes that while access to education has improved substantially, reducing inequality, productivity remains low due to poor education quality. Test scores are below OECD averages and have improved slowly. This skills gap and low innovation rate have led to a decline in Brazil's potential growth rate. The quality of management in public schools is essential to address these issues.


