SlideShare a Scribd company logo
Social Trends in Latin America: Time to Move Beyond Growth?


                                           George Gray Molina1


Latin America is into its tenth year of sustained economic growth. Since 2002, poverty has dropped by
about 51 million people, (31 percent of the population is poor using national poverty lines, and 28 percent
is poor using the $US 4/day international poverty line).2 Inequality has also dropped in 14 of 17 countries,
led by improvements in labor income and better educational returns at the bottom of the income
distribution.3 Despite the good news, the region continues to face structural challenges hindering further
progress. This is a good time to take stock of the growth-poverty linkages, and ask what lessons can be
learned from the Latin American track record.

An important question is whether further social gains can be expected from economic growth –or whether
gains are slowing down. The evidence on this question is, so far, mixed. On the one hand, most poverty
and inequality reduction can be explained by rapid and sizeable increases in labor income, followed by
the effect of public (CCTs or non-contributive pensions) and private transfers (remittances and the like).4
The rapid rise in labor incomes tends to support the view that most achievements are growth-led.

On the other hand, not enough is known about how labor markets translate firm-level growth into broad-
based income generation. Rather than trickle-down via good jobs in high-productivity sectors, most recent
growth is occurring in service sectors fueled by consumer demand. Can current gains be accounted for by
what is happening solely in the labor markets or are the long run effects of educational and health policies


1
  George Gray Molina, United Nations Development Programme (UNDP), Regional Bureau for Latin American and
the Caribbean. Email: george.gray.molina@undp.org. All opinions are personal, and do not reflect the institutional
position of UNDP. Many thanks to Susana Martinez for permission to use research from Martinez, Susana and
George Gray Molina, 2012, “The High Hanging Fruit of Latin America Progress”, Human Development Research
Brief 01/2012, New York, UNDP.
2
  World Bank, 2011, On the Edge of Uncertainty: Poverty Reduction in Latin America and the Caribbean during the
Great Recession and Beyond, Washington DC: The World Bank, CEPAL 2011, Panorama Social de America
Latina, Santiago: CEPAL.
3
  Lopez-Calva, Luis Felipe and Nora Lustig (editors), 2010, Declining Inequality in Latin America: A Decade of
Progress?, Washington: Brookings Institution and UNDP. 2009, Gasparini, Leonardo and Nora Lustig, 2011, “The
Rise and Fall of Income Inequality in Latin America”, La Plata: CEDLAS.
4
  World Bank, 2011, op. cit.

                                                                                                                1
playing an enabling role?5 In addition, are policy interventions in the labor market, such as formalization
or minimum wage floors, also playing a role?6 If so, inequality-reducing actions set the stage for current
poverty reduction.

This brief is organized in three parts. The first part describes the existing pattern of poverty reduction.
Where did most of it happen? Who missed out and why? The second part describes microtrends that
diverge from country averages, and may set the stage for a future wave of social progress: idle youth,
female labor participation, service sector changes and growth of intermediate cities. The third part
considers policy challenges. What to do?

The High-hanging Fruit of Latin American Progress
The recent track record is non-random –i.e. labor income gains concentrate mostly in the service sectors
of LAC economies, favoring male workers more than women, and largely bypassing youth employment.
Labor income was also tempered cyclically, as labor shares improved during crises, and public transfers
weighed most at the peak of the economic crisis in 2009. This pattern reveals a number of interesting
stylized facts that run counter to the conventional wisdom.

First, rises in labor income account for an estimated 45 percent of the total poverty reduction effect,
followed by social transfers (16 percent) and pensions (10 percent) and an increase in the number of
working age individuals (9 percent).7 While the regional proportions vary from country to country, with
Brazil and Chile showing more of an impact from transfers and pensions, and Mexico showing a larger
impact from labor income, the overall figures are significant, if only because they provide an order of
magnitude on what matters. Wages are rising in Latin America, like they haven’t for close to two decades.

Second, the mechanisms that secured poverty reduction are also different from either the Chinese or
Asian patterns of growth. In contrast to economies that are driven by strong manufacturing/export sectors
that create jobs in non tradeable sectors –transportation, logistics, processing, and export-oriented
services--LAC economies seem to be growing primarily on the basis of domestic consumption driven by
commodity exports, but not by improvements in manufacturing or technological upgrading. Easy and
available credit fueled consumer growth that made its way to construction and low-skilled services –this
is the heart of new job creation and rising wages.

Third, if the low-hanging fruit is exhausted –if labor markets are tightening for low-skilled service sector
jobs, mostly male, mostly for 25 to 49 year olds —we will need to focus on those left-out or excluded
from the dynamic labor markets the high-hanging fruit of Latin American social progress: youth
employment, female labor participation, non-agricultural rural markets and manufacturing and knowledge
intensive sectors. This maps out a potential policy agenda for the future. The ongoing economic

5
   UNDP 2010, Human Development Report 2010: The Real Wealth of Nations: Pathways to Human Development,
New York, UNDP, Gray Molina, George and Mark Purser, 2010, “Human Development Trends since 1970: A
Social Convergence Story”, Working Paper 02/2010, Kenny, Charles, 2011, Getting Better: Why Global
Development Is Succeeding--And How We Can Improve the World Even More, New York: Basic Books.
6
  Saúl N. Keifman and Roxana Maurizio, 2012, Changes in Labour Market Conditions and Policies: Their Impact on
Wage Inequality during the Last Decade, Helsinki: UNU-Wider.
7
  Azevedo, Joao Pedro, Gabriela Inchauste and Vivian Sanfelice, 2012, “Decomposing the Decline in Income
Inequality in Latin America”, paper presented at the Network for Inequality and Poverty (NIP) Conference, April,
Columbia University, New York, NY.

                                                                                                              2
transformation in the region can be described as one in which employees are leaving low-skilled, low
productivity and poorly paid jobs in agriculture or the manufacturing sector, moving to low-skill services
such as retail trade and personal services, mostly in the informal sector (domestic service, street vendors
or beauty parlor owners).

According to the recent regional data, 177 million people still live under the poverty line in Latin America
and the Caribbean –70 million under the indigence line.8 Can further gains in poverty reduction be
achieved by a longer growth spell? Yes, because there are still gains to be made with further growth in
labor income and by expanding coverage of existing fiscal and social protection programs. But, no,
because much of the remaining poverty is concentrated in non-random pockets of the population , sectors
and geographic areas, that have either hit declining returns upon more of the same, or are simply excluded
from the dynamic sectors of the economy and/or existing social safety nets.

Two general trends are salient. First, labor participation and wages have increased since 1995. Males have
benefited to a greater extent from the increase in wages and labor participation. The second trend is that
the share of labor participation in the service sector accounts for more than 60 percent of total
employment and --with the exception of Peru-- has increased since 1995. The manufacturing sector and
primary sectors have also shrunk since 1995 with the exception of Brazil in manufacturing and Peru in
primary activities.

Microtrends that Point to New Challenges
Microtrends, group-specific trends that deviate from country averages, help describe the speed
and direction of ongoing social and economic change. For example, increased access to
education will, in the absence of technological upgrading, erode returns to education;
urbanization, which improved access to services in large cities in the past, will tend to reach
scale diseconomies; and the demographic dividend, which delivered a decline in labor
dependency ratios, will eventually stretch labor markets and start to age.9 Some microtrends have
gained demographic traction in the past and describe the trends of today. Others have simply
disappeared or become less relevant over time.

There are some advantages to describing microtrends in systematic fashion. First, there is insight
to be gained from disaggregating demographic, social and labor data by age, geographic location,
sex, ethnic group and so on. Disaggregation points to existing and enduring disparities, to
growing or shrinking gaps. Second, by pinpointing microtrends for certain groups –women
participating in the formal labor market or youth entering the labor force for the first time, for
example—we are able to focus more tightly on hypotheses and mechanisms that might have a
large impact over future trends (human capital, skills premium, labor productivity, wage shares,
etc). Third, by describing microtrends we may foresee important future policy opportunities and
challenges. If the past three decades were mostly marked by urbanization, drops in fertility rate
and increased access to female education, the next decade is likely to be marked by processes
8
 CEPAL, 2011, op cit.
9
 The term “microtrend” comes from Mark Penn, 2007, Microtrends: The Small Forces Behind Tomorrow’s Big
Changes (New York: Twelve), who constructs an insightful map and toolkit for grassroots political organizing.

                                                                                                                3
that are, perhaps, only incipient today (increased global migration, climate change patterns,
changing demographic composition of the household, adoption of new communication
technologies, crime and violence). In this section I describe four microtrends that might have an
impact in the future.

Idle Youth, as labor markets are booming
One of the paradoxes of economic growth in Latin America is that despite greater educational
and labor opportunities, there is a large number of young individuals who do not study and do
not work. This is a phenomenon known as “idle youth”10 or NINIs, referring to those that “ni
estudian, ni trabajan.”

Currently, 18.5 percent of Latin American youth between the ages of 15 and 18 (9.4 million) do
not work and do not study. The interesting thing is that the highest rates observed for these age
groups are in countries with very different economic and cultural trajectories: By 2009, it
represented 28 percent of the age group of 15 to 18 in Honduras (237.000), 25.3 percent in
Guatemala (237.000), 26.1 percent in Peru (754.000), 20.5 percent in Chile (304.000), and 20.4
percent in Colombia (865.000)11. Figure 1, reveals that except for the cases of Peru, Bolivia and
the Dominican Republic, between 50 to 60 percent of idle youth is concentrated in the lowest
income quintiles (Quintiles 1 and 2).

Figure 1. Idle youth by Income Quintiles LAC12 (Age Group 15 to 18)

                                                                                                Quintile 5
     100%                                                                                       (Highest)

     80%                                                                                        Quintile 4

     60%                                                                                        Quintile 3

     40%                                                                                        Quintile 2

     20%
                                                                                                Quintile 1
      0%                                                                                        (Lowest)


10
  World Bank, 2011, op. cit.
11
   Cardenas, M., de Hoyos, R., Szekely, M. (2011), Idle Youth in Latin America: A Persistent Problem in a Decade
of Prosperity. In Latin America Initiative at Brookings.

                                                                                                              4
Note: Authors elaboration based on calculations using micro data from 214 household surveys
(for the years 2007 and 2008) by Cardenas et al (2011).

How to explain this phenomenon, in such diverse countries and in a context of sustained
economic growth in the region since 2002? Figure 2, shows a snap shot of the Brazilian case. We
observe several trends: first, there is increasing secondary school enrollment, with decreasing
employment for the young population. This could suggest that greater educational opportunities
are driving the young population out of the labor market. Nevertheless, we also observe that
unemployment has increased by 5 percent since 1995. This trend suggests that although a lower
percentage of young individuals are working, many are looking for a job and not finding one.
This could explain why we also observe a steady trend of idle youth since 1995. Taking into
consideration demographic growth, a 2 percent reduction of idle young would still imply that the
same amount of young individuals are not studying and not working.

Figure 2. Jobs, Schooling and Idle Youth in Brazil from 1995 to 2009

                                                                               School enrollment,
 80.0                                                                          secondary (% Net),
                                                                                      82.0
 70.0           65.8
                                                                               Employment ages
 60.0
           58.0                                                                 15-24, total (%),
                                                                                     52.5
 50.0

 40.0

 30.0
                                                                             Idle Youth (15-24),
           20.7                                                                     18.6
 20.0
         11.4                                                                 Unemployment
 10.0                                                                           (%15-24), 17.8
                 1995              2000                2005                2009
Note: Author’s own elaboration using SEDLAC – World Bank Data and the World Development
Indicators.

Young individuals do not seem to be benefiting to the same extent as adults from increasing
economic growth and labor opportunities. Indeed, recent studies suggest that idleness is
associated with factors such as extreme poverty and youth long term unemployment. More
research needs to examine the role of other determinants that include the consumption of risky


                                                                                                   5
behaviors (eg. drugs, alcohol, distance to school, teen pregnancy, violence, the number of
siblings in the household or structure of the household).12

20 to 50 Million Women Missing from Formal Labor Markets

Another interesting microtrend, that has become a macrotrend in recent years, is the growing
share of women in the formal labor force. The magnitude of this change is enormous. Over thirty
years, participation rates moved by 10 to 15 percentage points in most countries. However, if
LAC female participation rates converged with respect to female participation rates in OECD
countries, 19 million more women would be employed in formal labor markets. If participation
rates between men and women converged in Latin America, 50 million more women would join.
Given the current structure of income generation and poverty reduction, the massive inclusion of
women in formal labor markets is a must for future gains.

The literature on female labor participation points to economic, cultural and technological
obstacles to further expansions (Goldin 1997; Gutierrez 2009 and Katz and Goldin 2008).
Beyond averages, however, there are particular stories that merit closer scrutiny. The key
question is whether and how policy interventions can change incentives for increased
participation. If they can, such policies are critical to move millions more out of poverty.

Figure 3. Female labor participation
                                                                                            LAC
     70.0                                                                                   Argentina
                                                                                            Bolivia
     65.0
                                                                                            Brazil
                                                                                            Chile
     60.0
                                                                                            Colombia
                                                                                            Costa Rica
     55.0
                                                                                            Dominican Rep.
     50.0                                                                                   Ecuador
                                                                                            El Salvador
     45.0                                                                                   Grenada
                                                                                            Guatemala
     40.0                                                                                   Guyana
                                                                                            Honduras
     35.0                                                                                   Jamaica
                                                                                            Mexico
     30.0                                                                                   Nicaragua
                                                                                            Panama
     25.0                                                                                   Paraguay
                                                                                            Peru
     20.0                                                                                   Trinidad and Tobago
            1980
            1981
            1982
            1983
            1984
            1985
            1986
            1987
            1988
            1989
            1990
            1991
            1992
            1993
            1994
            1995
            1996
            1997
            1998
            1999
            2000
            2001
            2002
            2003
            2004
            2005
            2006
            2007
            2008
            2009


                                                                                            Uruguay
                                                                                            Venezuela


12
  For evidence about Brazil’s idle youth see: Susana Martinez-Restrepo, “The Economics of Adolescents’ Time
Allocation: Evidence from the Young Agent Project in Brazil” (PhD diss., Columbia University, 2012). For
evidence about Mexico See: Arceo-Gómez, Eva; Campos Vasquez-Raymundo (2011). ¿Quienes son los NiNis en
México?


                                                                                                                  6
Figure 4. Labor force, female (% of total labor force)

 66.0
                                                                                LAC
 61.0

 56.0                                                                           Brazil all >15


 51.0
                                                                                Brazil (25-64)
 46.0

 41.0                                                                           Brazil (15-24)

 36.0
                                                                                Brazil Lowest
 31.0                                                                           Income Quintile


 26.0                                                                           Brazil Highest
        1981
        1982
        1983
        1984
        1985
        1986
        1987
        1988
        1989
        1990
        1991
        1992
        1993
        1994
        1995
        1996
        1997
        1998
        1999
        2000
        2001
        2002
        2003
        2004
        2005
        2006
        2007
        2008
        2009
                                                                                Income Quintile


Note: Author’s own elaboration based on the Socio-Economic Database for Latin America and
the Caribbean (CEDLAS and The World Bank)


Two microtrends stand side by side in Figure 4. First, the richest 20 percent of the female
population in Brazil is moving in the direction of greater female labor participation and higher
incomes. Secondly, the poorest 20 percent of the female population is moving in the opposite
direction of declining labor participation. When we zoom in on age groups, we observe that
female labor participation rates have plateaued for 15 to 24 year olds since the 1990s. What is
going on behind this trend? More educational opportunities? More barriers to youth
employment?

Another interesting microtrend is the case of the Dominican Republic. Despite the overall
educational upgrade, the labor market seems to be benefiting low-skilled males in the informal
sector. Figure 5 shows a change in the education attainment of unemployed individuals. In 2005,
most unemployed males+ and females were those with primary (or less) education. Today, the
unemployed individuals with tertiary (higher) education have increased 3 percent and those with
secondary education, around 7 percent since 2005. The gender gap closed for the unemployed
with secondary education but increased for those with primary education, benefiting more
females than males.

Figure 5. Share of unemployment by education level and gender


                                                                                                  7
47.0
                                                                                     With secondary
              43.7
                                                                                  education, female, 42.4
     42.0
            41.1                                                                           With secondary
            37.4                                                                         education, male, 42.0
     37.0
              36.1                                                                             With primary
                                                                                            education, male, 35.6
     32.0

                                                                                              With primary
     27.0                                                                                 education, female, 29.4


     22.0                                                                                With tertiary education,
                                                                                               female, 20.6
             17.0
     17.0
                                                                               With tertiary education,
              15.6
                                                                                      male, 18.0
     12.0
                   2005    2006           2007           2008           2009              2010

Source: Authors’ elaboration based on data from the World Development Indicators.

Recent evidence suggests that the fall in the skill premia affects both employment and wages.13
In a 2006 study, Levy and Murnane, argue that middle-skilled jobs are most vulnerable to an
increasingly global labor market. They suggest that while low-skilled service jobs must be done
on-site, (eg. janitors, security guards, restaurant helpers, nursing home, construction workers,
cleaning personnel), middle-skilled jobs (call centers, office assistants) can be outsourced
offshore. These studies use evidence from the United States and OECD countries, so should be
taken with caution14. The observation, however, does seem to apply to certain sectors of the
Dominican Republic economy. The tourist industry in the Dominican Republic produces many
direct and indirect jobs, most of which are low-skilled and low-paid jobs. Recent evidence
reveals a drop in male and female participation in manufacturing industries that employ middle-
skilled workers. Males present minor but increasing labor participation in activities in
transportation and commerce. Job informality remains very high and constant since 2000 in the
Dominican Republic among both males (48 percent) and females (47 percent).

The Lop-Sided Service Sectors
Recent growth has led to a growing share of employment in the service sectors, and a decreasing
share in manufacturing and primary activities. Numbers of workers in the commerce,
construction, and educational and health services have been particularly important throughout the


13
   Gasparini, et al., Educational Upgrading and Return to Skills in Latin America Evidence from a Supply-Demand
Framework, 1990–2010. Policy Research Working Paper 5921, Washington, DC: The World Bank, 2012.
14
   Frank Levy, and Richard J. Murnane, For now, middle-skilled jobs are the most vulnerable,CESifo Forum, Ifo
Institute for Economic Research at the University of Munich, vol. 7(2), pages 38-38, 07 . http://www.cesifo-
group.de/portal/pls/portal/docs/1/1191752.PDF


                                                                                                                    8
decade. The current composition of service sectors tends to weigh heavily in favor of low-
skilled, low-pay labor markets.

Graph 6. Service sector as % of occupied labor force

  80.0
                                                                           Argentina, 76.1
  75.0
                                                                           Uruguay, 70.5
  70.0
                                                                           Dominic Rep., 68.2
  65.0
                                                                            Panama, 62.7
  60.0
                                                                      Brazil , 61.3
  55.0
                                                                           Paraguay, 53.6
  50.0
  45.0                                                                     Bolivia, 43.5
                                                                           Honduras, 42.9
  40.0
  35.0                                                                     Peru, 34.1
  30.0
               1995               2000              2005               2009


Note: Author’s own elaboration based on the Socio-Economic Database for Latin America and
the Caribbean (CEDLAS and The World Bank)


The Peruvian case, however, suggests a different story. Although the service sector represents 56
percent of total jobs in Peru, it is the only country --among those studied in this brief-- where the
share of the service sector has decreased and where the share of primary activities has increased.
Figures 7 and 8 below show the share of employment from 1995 to 2009 in Peru within the
primary activities and within the service sector. Most job creation since 1995 has been in
agriculture related jobs and mining in primary activities. Despite a general decrease of the share
of the overall service sector in the economy, industries such as commerce, transportation and
communications, health and social services have also increased their share since 1995. The
strong economic growth in Peru since 2003 is mainly a result of a booming tourism sector, the
development of agriculture and agro-business, extractive industry sector (mining), and
infrastructure development.


                                                                                                   9
Figure 7. Share of employment within Figure 8. Share of employment within the
Primary activities                   service sector
                                                                                                           Domestic servants
45.0                                                             60.0                                      Other services
                                                                         3.2     3.1
40.0                                                                     3.5     3.2             1.4
                               0.9       5.8      Mining &               2.0     2.2     3.6               Health and social
                                                                 50.0                    3.5     7.3
                     0.6       0.6       1.1      quarrying              4.8     5.2                       services
35.0                                                                                     1.6
           0.7       0.7                                                 3.5     3.0     4.7     5.3       Teaching
30.0                                                             40.0    3.7     3.2     3.3     0.9 0.8
                                                                                                 1.0
           0.6                                    Agriculture,           5.4     5.9     3.1
                                                                                                 6.3       Public
25.0                                              Fishing        30.0    4.5     5.6     5.6     0.8       administration
20.0                                                                                     5.2               Business services
                              36.2      34.5
          31.0      31.6                          Agriculture,   20.0
15.0                                                                     21.4    21.9            23.2      Finance
                                                  hunting &                              18.5
10.0                                              forestry       10.0                                      Transportation&
                                                                         4.5     4.1             4.9       communications
 5.0                                                                                     3.3               Restaurants &
                                                                  0.0
 0.0                                                                    Circa   Circa   Circa   Circa      hotels
                                                                                                           Commerce
       Circa 1995Circa 2000Circa 2005Circa 2009                         1995    2000    2005    2009

Note: Author’s own elaboration using aggregates of national household surveys calculated by
SEDLAC – World Bank.


Despite a greater share of the primary sector in overall employment, the service and
manufacturing sectors have seen a greater increase in monthly wages since 1995. Wages in main
activities in the service sector went from US$3,638 in 1995 to US$4,973 in 2009. In the
manufacturing sector they went from US$ 962 to US$1402. They also increased in the primary
sector but at a lower rate, from US$231 to US$ 353. This data suggests that it is workers in the
service sector that are benefiting the most from Peru’s recent economic growth and increased in
labor income.

With increasing wages, there is a large share of service-sector and primary-sector jobs (such as
agro-business, mining and commodities) that are also low-productivity and low-wage. Informal
jobs accounted in 2009 for 63 percent of total workers in the labor market . Despite a small
reduction of 1.5 percent in comparison to 1995, it remains the highest share among selected
countries.

Figure 9. Distribution of Services, Manufacturing and Primary Activity wages (USD)


                                                                                                                               10
5000                                                                        Services Monthly
     4500                                                                          Income, 4973
     4000
              3638
     3500
     3000
     2500
     2000                                                                         Manufacture Monthly
                                                                                     Income, 1402
     1500
                 962
     1000
      500                                                                          Primary Activities
               231                                                                Monthly Income, 353
       0
                Circa 1995          Circa 2000          Circa 2005         Circa 2009

Note: Author’s own elaboration using aggregates of national household surveys calculated by
SEDLAC – World Bank. Informality refers to salaried workers in a small firm, a non-
professional self-employed, or a zero-income.

The aggregate figures do not account for the fact that within each sector, there are different types
of jobs –the mining sector, for example, employs both highly qualified and highly paid
individuals (such as mining managers) and low paid and qualified individuals (such as miners).
The individuals in low productivity jobs are the high hanging fruit of current economic growth.
The question is then what relevant policies need to address this economic growth that is
maintaining existing structural economic inequalities within internal economic transformations.

Will Social Gains Slow Down?

Fiscal constraints slow parts of the expansion
Despite the additional fiscal space gained since the 2008/9 crisis, most Latin American
economies –excluding Brazil, Uruguay and Argentina—face serious obstacles to raise tax
revenue levels.15 Current revenues are about half the OECD rates and lead to a very constrained
set of spending priorities. Most new spending --beyond inertial public sector allocations-- have
either focused on the expansion of social transfers, or on expanding public sector employment.
With close to 113 million social transfer recipients (25 percent of the population) in every
country in the region, it is worth considering whether transfers will expand or target increasingly
excluded groups.

There are at least three aspects to the fiscal constraint question. The first concerns the sources of
fiscal expansion. The region currently raises revenues from value added taxes and social security
contributions, followed by specific consumption taxes. Corporate and income taxes still lag with
respect to the OECD and other middle economies.16 In federal countries like Brazil, Argentina

15
     IMF, 2012, World Economic Outlook (April 2012), Washington, DC: IMF.
16
     OECD, ECLAC and CIAT, 2012, Revenue Statistics in Latin America, Santiago: CEPAL.

                                                                                                        11
and Mexico, a large share of revenue mobilization occurs at the subnational level and/or is
earmarked to subnational spending or investment priorities. There are few sources for additional
revenues beyond raising income taxes that already grate against middle class preferences. A new
fiscal pact will need to focus on the structural demands of a growing population.

Second, the pro-poor impact of fiscal transfers is still low or moderate. The evidence suggests,
barring Chile, Brazil and perhaps Argentina, that most poor households in the region do not
benefit from a significant change between their pre- and post-fiscal income –meaning that CCTs
and other non-conditional transfers are not having much of a dent on poverty or income
inequality.17 One problem is that transfers are typically too small to make up for large poverty
gaps at the bottom of the distribution. An additional problem is that transfers typically show a lot
of leakage from poor to non-poor households. The targeting question continues to dampen the
overall impact.

Finally, beyond the immediate monetary impact of transfers, most CCTs are not meant to bring
households out of poverty but to provide demand incentives for human capital accumulation –to
allow children to go to school and use public health services.18 The supply side is frequently
missing in social services, and this deficit, which is both material and human resource-based,
will take decades to fulfill. The supply-side constraint is particularly important for countries with
large rural populations, and for rapidly growing urban centers that haven’t caught up with
demand in the 2000s.

A bridge from CCTs to a universal safety net is needed
Beyond fiscal constraints, the move from targeted transfers to a universal basic income or service
safety net is riddled with other challenges. The most important has to do with female labor
participation and youth employment –both of which constrain the rate of broad-based progress
because of their size. A welfare regime perspective is useful to gauge the magnitude of this
shift.19 A large hidden cost to household decision-making is borne by women. While most
OECD economies are underwritten by either market-led or state-provided safety nets, pensions
or insurance from risk, most Latin American households are “familistic” in their labor and
income strategies. The double burden faced by millions of women acts as a hidden subsidy on
the rest of society, markets and state. It undergirds the current welfare regime in Latin America,
and is among other things, blatantly unfair.

The cost of transitioning millions of youth or women into the labor force –thus sustaining the
rhythm of poverty reduction over the next decade --will require a new type of social compact that

17
   Lustig, Nora et al, 2011, “Fiscal Policy and Income Redistribution in Latin America: Challenging the
Conventional Wisdom”, New Orleans: Tulane University and Inter-American Dialogue.
18
   Cecchini, Simone and Aldo Madariaga, 2011, Programas de Transferencias Condicionadas: Balance de la
experiencia reciente de América Latina y el Caribe, Santiago: CEPAL.
19
   Martinez, Juliana, 2008, “Welfare Regimes in Latin America: Capturing Constellations of Markets, Families and
Policies” (Latin American Politics and Society, vol. 50, 2: 67-100).

                                                                                                              12
transcends fiscal revenue pressure. This is an issue that is likely to dominate future discussions of
social policy because it intersects with economic policymaking –particularly job creation.
Santiago Levy has focused on one important aspect of this question by zooming in on the
behavioral impact of social protection policies over labor markets.20 An additional focus has
been provided by a burgeoning literature on the economics of care.21 Both strands of research are
focusing on the balance between labor markets and household decision-making.

A third strand of work pulls some of these concerns together.22 How to integrate social and
economic policymaking on job creation in the region? The trend, so far, has been marked by a
division of labor. Economic policymaking has focused on stabilizing welfare in turbulent times
and promoting economic growth in the good times; social policy tends to be compensatory
and/or aimed at long-run human capital accumulation. The key in the future is to focus on the
intersection which focuses on job creation with both market and state-led policy levers. This is
what we turn to next.

Are good jobs out of reach?
In many respects, this is the best of times for labor markets. Labor participation –as measured by
hours worked—is expanding, and labor income –as measured by income per hour—is also
growing. At the same time, this is a unique moment to describe the job-creating pattern of
current economic growth, most of it occurring in low-skill service sectors, for male workers from
25 to 49 years of age. The level of growth and poverty reduction is significant, but the reach is
limited.

Two forces move against “good job” creation in the region. The first is macro, linked to the
pattern of economic specialization, technology content and export diversification of Latin
American economies. Most growth is driven by a surge in commodity demand, and while this
has not been detrimental to growth, it has structured incentives for labor market upgrading in the
2000s. The second force is micro, linked to the pattern of female labor participation and youth
employment described earlier in this brief. The sectors that create new jobs are not likely to
break through to non-participating females and youth, because the incentives are not there. The
welfare regime that might employ more women in the labor force is largely absent in the region
and shows little signs of materializing. Together, macro and micro incentives create a scissors for
future poverty alleviation in the Latin America.

In theory, we know from existing research that there is an important deficit in building higher
productivity building blocks –service sectors, in particular, are frequently the weak link of global

20
   Levy, Santiago, 2010, Good Intentions, Bad Outcomes: Social Policy, Informality, and Economic Growth in
Mexico, Brookings Institution: Washington, DC.
21
   Esquivel, Valeria, 2012, “La economía del cuidado en América Latina: poniendo a los cuidados en el centro de la
agenda”, Area de Practica Genero, PNUD: Panama.
22
   Martinez, Juliana and Diego Sanchez Ancochea, 2011, “The Productive Bottlenecks of Progressive Social
Policies: Lessons from Costa Rica and Beyond”. CROP Poverty Brief, Bergen: CROP.

                                                                                                                13
supply chains.23 We also know from time-use surveys that the gap between male and female
labor participation will not change without behavioral changes in the household and incentives
from the state. What is holding the region back from moving ahead with reforms that might
reach the “high-hanging fruit” of poverty reduction? Part of the answer seems to be political –
linked to the time horizon of structural changes. But part of the answer is managerial: why
engage in gender-equalizing, productivity-enhancing, sustainable development reforms when
cutting the cost of doing business in the region is often seen as a more expedient route to
enhancing competitiveness.

This is a good moment to reflect on the kinds of structural obstacles that prevent future social
and economic progress. Latin America is facing a crossroads. The best of times shows us how
things are when we get our economic-growth wish. This might be the time to focus on our social
wishes to spur future progress.


23
 IDB, 2010, The Age of Productivity: Transforming LAC Economies from the Bottom-Up, Washington, DC: Inter-
American Development Bank.

                                                                                                        14

More Related Content

What's hot

202859367-Worker-CooperativeWorker-Cooperatives-for-New-York-City-A-Vision-fo...
202859367-Worker-CooperativeWorker-Cooperatives-for-New-York-City-A-Vision-fo...202859367-Worker-CooperativeWorker-Cooperatives-for-New-York-City-A-Vision-fo...
202859367-Worker-CooperativeWorker-Cooperatives-for-New-York-City-A-Vision-fo...Krystal Tena
 
Pre-ICAconference: Inequality and emancipation
Pre-ICAconference: Inequality and emancipationPre-ICAconference: Inequality and emancipation
Pre-ICAconference: Inequality and emancipationCarolina Matos
 
The cooperatives and the national development goals and agenda
The cooperatives and the national development goals and agendaThe cooperatives and the national development goals and agenda
The cooperatives and the national development goals and agenda
DianNa PastRana
 
Politicsof l asnewmiddleclassfrankfukuyamafinal_1
Politicsof l asnewmiddleclassfrankfukuyamafinal_1Politicsof l asnewmiddleclassfrankfukuyamafinal_1
Politicsof l asnewmiddleclassfrankfukuyamafinal_1
Centro de Competitividad e Innovación
 
Mgi poorer-than-their-parents-flat-or-falling-incomes-in-advanced-economies-e...
Mgi poorer-than-their-parents-flat-or-falling-incomes-in-advanced-economies-e...Mgi poorer-than-their-parents-flat-or-falling-incomes-in-advanced-economies-e...
Mgi poorer-than-their-parents-flat-or-falling-incomes-in-advanced-economies-e...
David Sarmiento
 
Understanding the Informal Sector
Understanding the Informal SectorUnderstanding the Informal Sector
Understanding the Informal Sector
Dr Lendy Spires
 
social enterprise a new model for poverty reduction and employment generation
social enterprise a new model for poverty reduction and employment generationsocial enterprise a new model for poverty reduction and employment generation
social enterprise a new model for poverty reduction and employment generationBoni
 
Why Baby Boomers Will Need To Work Longer
Why Baby Boomers Will Need To Work LongerWhy Baby Boomers Will Need To Work Longer
Why Baby Boomers Will Need To Work Longer
lalitranka
 
The Economist: Securing Livelihoods Special Edition
The Economist: Securing Livelihoods Special EditionThe Economist: Securing Livelihoods Special Edition
The Economist: Securing Livelihoods Special Edition
The Rockefeller Foundation
 
Agenda Suramerica January 2013
Agenda Suramerica January 2013Agenda Suramerica January 2013
Agenda Suramerica January 2013
The Rockefeller Foundation
 
Population Stratification, U.S. 1 C
Population Stratification, U.S. 1 CPopulation Stratification, U.S. 1 C
Population Stratification, U.S. 1 Cjcarlson1
 
20090422 Dinokeng Presentation Master V7 1
20090422 Dinokeng Presentation Master V7 120090422 Dinokeng Presentation Master V7 1
20090422 Dinokeng Presentation Master V7 1
Saine
 
Case for More Capitalism
Case for More CapitalismCase for More Capitalism
Case for More Capitalism
Alan Rudi
 
The Longevity Economy: How People Over 50 Are Driving Economic and Social Val...
The Longevity Economy: How People Over 50 Are Driving Economic and Social Val...The Longevity Economy: How People Over 50 Are Driving Economic and Social Val...
The Longevity Economy: How People Over 50 Are Driving Economic and Social Val...
Longevity Network
 
Luis Felipe López-Calva
Luis Felipe López-CalvaLuis Felipe López-Calva
Рейтинг вільних економік світу за 2016 рік
Рейтинг вільних економік світу за 2016 рікРейтинг вільних економік світу за 2016 рік
Рейтинг вільних економік світу за 2016 рік
tsnua
 
The crisis of youth unemployment in the mint countries
The crisis of youth unemployment in the mint countriesThe crisis of youth unemployment in the mint countries
The crisis of youth unemployment in the mint countries
Alexander Decker
 

What's hot (19)

Hansen_Essay_3
Hansen_Essay_3Hansen_Essay_3
Hansen_Essay_3
 
202859367-Worker-CooperativeWorker-Cooperatives-for-New-York-City-A-Vision-fo...
202859367-Worker-CooperativeWorker-Cooperatives-for-New-York-City-A-Vision-fo...202859367-Worker-CooperativeWorker-Cooperatives-for-New-York-City-A-Vision-fo...
202859367-Worker-CooperativeWorker-Cooperatives-for-New-York-City-A-Vision-fo...
 
Working for the Few
Working for the FewWorking for the Few
Working for the Few
 
Pre-ICAconference: Inequality and emancipation
Pre-ICAconference: Inequality and emancipationPre-ICAconference: Inequality and emancipation
Pre-ICAconference: Inequality and emancipation
 
The cooperatives and the national development goals and agenda
The cooperatives and the national development goals and agendaThe cooperatives and the national development goals and agenda
The cooperatives and the national development goals and agenda
 
Politicsof l asnewmiddleclassfrankfukuyamafinal_1
Politicsof l asnewmiddleclassfrankfukuyamafinal_1Politicsof l asnewmiddleclassfrankfukuyamafinal_1
Politicsof l asnewmiddleclassfrankfukuyamafinal_1
 
Mgi poorer-than-their-parents-flat-or-falling-incomes-in-advanced-economies-e...
Mgi poorer-than-their-parents-flat-or-falling-incomes-in-advanced-economies-e...Mgi poorer-than-their-parents-flat-or-falling-incomes-in-advanced-economies-e...
Mgi poorer-than-their-parents-flat-or-falling-incomes-in-advanced-economies-e...
 
Understanding the Informal Sector
Understanding the Informal SectorUnderstanding the Informal Sector
Understanding the Informal Sector
 
social enterprise a new model for poverty reduction and employment generation
social enterprise a new model for poverty reduction and employment generationsocial enterprise a new model for poverty reduction and employment generation
social enterprise a new model for poverty reduction and employment generation
 
Why Baby Boomers Will Need To Work Longer
Why Baby Boomers Will Need To Work LongerWhy Baby Boomers Will Need To Work Longer
Why Baby Boomers Will Need To Work Longer
 
The Economist: Securing Livelihoods Special Edition
The Economist: Securing Livelihoods Special EditionThe Economist: Securing Livelihoods Special Edition
The Economist: Securing Livelihoods Special Edition
 
Agenda Suramerica January 2013
Agenda Suramerica January 2013Agenda Suramerica January 2013
Agenda Suramerica January 2013
 
Population Stratification, U.S. 1 C
Population Stratification, U.S. 1 CPopulation Stratification, U.S. 1 C
Population Stratification, U.S. 1 C
 
20090422 Dinokeng Presentation Master V7 1
20090422 Dinokeng Presentation Master V7 120090422 Dinokeng Presentation Master V7 1
20090422 Dinokeng Presentation Master V7 1
 
Case for More Capitalism
Case for More CapitalismCase for More Capitalism
Case for More Capitalism
 
The Longevity Economy: How People Over 50 Are Driving Economic and Social Val...
The Longevity Economy: How People Over 50 Are Driving Economic and Social Val...The Longevity Economy: How People Over 50 Are Driving Economic and Social Val...
The Longevity Economy: How People Over 50 Are Driving Economic and Social Val...
 
Luis Felipe López-Calva
Luis Felipe López-CalvaLuis Felipe López-Calva
Luis Felipe López-Calva
 
Рейтинг вільних економік світу за 2016 рік
Рейтинг вільних економік світу за 2016 рікРейтинг вільних економік світу за 2016 рік
Рейтинг вільних економік світу за 2016 рік
 
The crisis of youth unemployment in the mint countries
The crisis of youth unemployment in the mint countriesThe crisis of youth unemployment in the mint countries
The crisis of youth unemployment in the mint countries
 

Similar to Social trendsgeorgegrayfinal 1

Brazil poverty and inequality. Where to next?
Brazil poverty and inequality. Where to next?Brazil poverty and inequality. Where to next?
Brazil poverty and inequality. Where to next?
Oxfam Brasil
 
Analysis On The Result And Implication Of The Policy
Analysis On The Result And Implication Of The PolicyAnalysis On The Result And Implication Of The Policy
Analysis On The Result And Implication Of The Policy
Crystal Torres
 
YOUTH AND EMPLOYMENT IN LATIN AMERICA AND THE CARIBBEAN: PROBLEMS, PROSPECTS ...
YOUTH AND EMPLOYMENT IN LATIN AMERICA AND THE CARIBBEAN: PROBLEMS, PROSPECTS ...YOUTH AND EMPLOYMENT IN LATIN AMERICA AND THE CARIBBEAN: PROBLEMS, PROSPECTS ...
YOUTH AND EMPLOYMENT IN LATIN AMERICA AND THE CARIBBEAN: PROBLEMS, PROSPECTS ...
suzi smith
 
Act Local Please respond to the following in 2-3 paragraphsBased .docx
Act Local Please respond to the following in 2-3 paragraphsBased .docxAct Local Please respond to the following in 2-3 paragraphsBased .docx
Act Local Please respond to the following in 2-3 paragraphsBased .docx
bobbywlane695641
 
Youth and Skills
Youth and SkillsYouth and Skills
Youth and Skills
The Rockefeller Foundation
 
Localization And Globalization
Localization And GlobalizationLocalization And Globalization
Localization And Globalization
Lisa Martinez
 
Working For the Few - Political Capture and Economic Inequality
Working For the Few - Political Capture and Economic InequalityWorking For the Few - Political Capture and Economic Inequality
Working For the Few - Political Capture and Economic Inequality
Miqui Mel
 
A R T I C L E STHE AGING OF THE WORLD’S POPULATION AND ITS.docx
A R T I C L E STHE AGING OF THE WORLD’S POPULATION AND ITS.docxA R T I C L E STHE AGING OF THE WORLD’S POPULATION AND ITS.docx
A R T I C L E STHE AGING OF THE WORLD’S POPULATION AND ITS.docx
ransayo
 
Trade and Financial Liberalization and Its Effects on Growth, Employment and ...
Trade and Financial Liberalization and Its Effects on Growth, Employment and ...Trade and Financial Liberalization and Its Effects on Growth, Employment and ...
Trade and Financial Liberalization and Its Effects on Growth, Employment and ...
Grupo de Economia Política IE-UFRJ
 
Economic growth and poverty reduction in nigeria an empirical investigation
Economic growth and poverty reduction in nigeria an empirical investigationEconomic growth and poverty reduction in nigeria an empirical investigation
Economic growth and poverty reduction in nigeria an empirical investigation
Alexander Decker
 
How demographic change affects development
How demographic change affects developmentHow demographic change affects development
How demographic change affects development
AshikurRahman177
 
Surname 1Surname 13Students NameInstitutional Affiliat.docx
  Surname 1Surname 13Students NameInstitutional Affiliat.docx  Surname 1Surname 13Students NameInstitutional Affiliat.docx
Surname 1Surname 13Students NameInstitutional Affiliat.docx
ShiraPrater50
 
Fmgd pre course assgn
Fmgd  pre course assgnFmgd  pre course assgn
Fmgd pre course assgn
Krishna Sahoo
 
The global financial crisis in colombia and the international conference on p...
The global financial crisis in colombia and the international conference on p...The global financial crisis in colombia and the international conference on p...
The global financial crisis in colombia and the international conference on p...
UN Global Pulse
 
Final blue-print-365-policy-report
Final blue-print-365-policy-reportFinal blue-print-365-policy-report
Final blue-print-365-policy-report
T'Ron Hiriams
 
How Middle-Class is Latin America?
How Middle-Class is Latin America?How Middle-Class is Latin America?
test-bank-ch-chapter-questions chap 5.pdf
test-bank-ch-chapter-questions chap 5.pdftest-bank-ch-chapter-questions chap 5.pdf
test-bank-ch-chapter-questions chap 5.pdf
HiLinh29
 
Aging and Financial Inclusion
Aging and Financial InclusionAging and Financial Inclusion
Aging and Financial InclusionAliMaryLiv
 

Similar to Social trendsgeorgegrayfinal 1 (20)

Brazil poverty and inequality. Where to next?
Brazil poverty and inequality. Where to next?Brazil poverty and inequality. Where to next?
Brazil poverty and inequality. Where to next?
 
Analysis On The Result And Implication Of The Policy
Analysis On The Result And Implication Of The PolicyAnalysis On The Result And Implication Of The Policy
Analysis On The Result And Implication Of The Policy
 
YOUTH AND EMPLOYMENT IN LATIN AMERICA AND THE CARIBBEAN: PROBLEMS, PROSPECTS ...
YOUTH AND EMPLOYMENT IN LATIN AMERICA AND THE CARIBBEAN: PROBLEMS, PROSPECTS ...YOUTH AND EMPLOYMENT IN LATIN AMERICA AND THE CARIBBEAN: PROBLEMS, PROSPECTS ...
YOUTH AND EMPLOYMENT IN LATIN AMERICA AND THE CARIBBEAN: PROBLEMS, PROSPECTS ...
 
Act Local Please respond to the following in 2-3 paragraphsBased .docx
Act Local Please respond to the following in 2-3 paragraphsBased .docxAct Local Please respond to the following in 2-3 paragraphsBased .docx
Act Local Please respond to the following in 2-3 paragraphsBased .docx
 
Youth and Skills
Youth and SkillsYouth and Skills
Youth and Skills
 
Localization And Globalization
Localization And GlobalizationLocalization And Globalization
Localization And Globalization
 
Working For the Few - Political Capture and Economic Inequality
Working For the Few - Political Capture and Economic InequalityWorking For the Few - Political Capture and Economic Inequality
Working For the Few - Political Capture and Economic Inequality
 
A R T I C L E STHE AGING OF THE WORLD’S POPULATION AND ITS.docx
A R T I C L E STHE AGING OF THE WORLD’S POPULATION AND ITS.docxA R T I C L E STHE AGING OF THE WORLD’S POPULATION AND ITS.docx
A R T I C L E STHE AGING OF THE WORLD’S POPULATION AND ITS.docx
 
Trade and Financial Liberalization and Its Effects on Growth, Employment and ...
Trade and Financial Liberalization and Its Effects on Growth, Employment and ...Trade and Financial Liberalization and Its Effects on Growth, Employment and ...
Trade and Financial Liberalization and Its Effects on Growth, Employment and ...
 
finalproject
finalprojectfinalproject
finalproject
 
Economic growth and poverty reduction in nigeria an empirical investigation
Economic growth and poverty reduction in nigeria an empirical investigationEconomic growth and poverty reduction in nigeria an empirical investigation
Economic growth and poverty reduction in nigeria an empirical investigation
 
How demographic change affects development
How demographic change affects developmentHow demographic change affects development
How demographic change affects development
 
Surname 1Surname 13Students NameInstitutional Affiliat.docx
  Surname 1Surname 13Students NameInstitutional Affiliat.docx  Surname 1Surname 13Students NameInstitutional Affiliat.docx
Surname 1Surname 13Students NameInstitutional Affiliat.docx
 
Fmgd pre course assgn
Fmgd  pre course assgnFmgd  pre course assgn
Fmgd pre course assgn
 
The global financial crisis in colombia and the international conference on p...
The global financial crisis in colombia and the international conference on p...The global financial crisis in colombia and the international conference on p...
The global financial crisis in colombia and the international conference on p...
 
Final blue-print-365-policy-report
Final blue-print-365-policy-reportFinal blue-print-365-policy-report
Final blue-print-365-policy-report
 
THIS IS IT
THIS IS ITTHIS IS IT
THIS IS IT
 
How Middle-Class is Latin America?
How Middle-Class is Latin America?How Middle-Class is Latin America?
How Middle-Class is Latin America?
 
test-bank-ch-chapter-questions chap 5.pdf
test-bank-ch-chapter-questions chap 5.pdftest-bank-ch-chapter-questions chap 5.pdf
test-bank-ch-chapter-questions chap 5.pdf
 
Aging and Financial Inclusion
Aging and Financial InclusionAging and Financial Inclusion
Aging and Financial Inclusion
 

More from Centro de Competitividad e Innovación

Carta a los Ecuatorianos
Carta a los EcuatorianosCarta a los Ecuatorianos
Carta a los Ecuatorianos
Centro de Competitividad e Innovación
 
Summary paper of the Conference "Sustainable Development, FDI and Investment ...
Summary paper of the Conference "Sustainable Development, FDI and Investment ...Summary paper of the Conference "Sustainable Development, FDI and Investment ...
Summary paper of the Conference "Sustainable Development, FDI and Investment ...
Centro de Competitividad e Innovación
 
Programa Final Day of Ecuador at Harvard Breaking the natural resources depen...
Programa Final Day of Ecuador at Harvard Breaking the natural resources depen...Programa Final Day of Ecuador at Harvard Breaking the natural resources depen...
Programa Final Day of Ecuador at Harvard Breaking the natural resources depen...
Centro de Competitividad e Innovación
 
Day of Ecuador at Harvard KSG
Day of Ecuador at Harvard KSGDay of Ecuador at Harvard KSG
Day of Ecuador at Harvard KSG
Centro de Competitividad e Innovación
 
Quilotoa Loop, Ecuador´s hidden secret
Quilotoa Loop, Ecuador´s hidden secret Quilotoa Loop, Ecuador´s hidden secret
Quilotoa Loop, Ecuador´s hidden secret
Centro de Competitividad e Innovación
 
Tribunal permite demandas de ciudadanos ecuatorianos en caso CHEVRON
Tribunal permite demandas de ciudadanos ecuatorianos en caso CHEVRONTribunal permite demandas de ciudadanos ecuatorianos en caso CHEVRON
Tribunal permite demandas de ciudadanos ecuatorianos en caso CHEVRON
Centro de Competitividad e Innovación
 
Day of Ecuador at Yale: Sumak Kawsay, Good Living Policies
Day of Ecuador at Yale: Sumak Kawsay, Good Living Policies Day of Ecuador at Yale: Sumak Kawsay, Good Living Policies
Day of Ecuador at Yale: Sumak Kawsay, Good Living Policies
Centro de Competitividad e Innovación
 
Degustación Comida Ecuatoriana
Degustación Comida EcuatorianaDegustación Comida Ecuatoriana
Degustación Comida Ecuatoriana
Centro de Competitividad e Innovación
 
Ecuador Pushes Back Against Chevron's Drive To Suspend Trade Preferences
Ecuador Pushes Back Against Chevron's Drive To Suspend Trade PreferencesEcuador Pushes Back Against Chevron's Drive To Suspend Trade Preferences
Ecuador Pushes Back Against Chevron's Drive To Suspend Trade Preferences
Centro de Competitividad e Innovación
 
Laa121003 atpdea ecuador oct 2012
Laa121003  atpdea   ecuador  oct 2012Laa121003  atpdea   ecuador  oct 2012
Laa121003 atpdea ecuador oct 2012
Centro de Competitividad e Innovación
 
Respuesta Nathalie Cely a Latin American Advisor sobre Asilo Assange
Respuesta Nathalie Cely a Latin American Advisor sobre Asilo AssangeRespuesta Nathalie Cely a Latin American Advisor sobre Asilo Assange
Respuesta Nathalie Cely a Latin American Advisor sobre Asilo Assange
Centro de Competitividad e Innovación
 
Food FDI investment trend
Food FDI investment trendFood FDI investment trend
Food FDI investment trend
Centro de Competitividad e Innovación
 
Taxes transfersandredistributionnoralusitgfinal
Taxes transfersandredistributionnoralusitgfinalTaxes transfersandredistributionnoralusitgfinal
Taxes transfersandredistributionnoralusitgfinal
Centro de Competitividad e Innovación
 

More from Centro de Competitividad e Innovación (20)

Carta a los Ecuatorianos
Carta a los EcuatorianosCarta a los Ecuatorianos
Carta a los Ecuatorianos
 
Summary paper of the Conference "Sustainable Development, FDI and Investment ...
Summary paper of the Conference "Sustainable Development, FDI and Investment ...Summary paper of the Conference "Sustainable Development, FDI and Investment ...
Summary paper of the Conference "Sustainable Development, FDI and Investment ...
 
Programa Final Day of Ecuador at Harvard Breaking the natural resources depen...
Programa Final Day of Ecuador at Harvard Breaking the natural resources depen...Programa Final Day of Ecuador at Harvard Breaking the natural resources depen...
Programa Final Day of Ecuador at Harvard Breaking the natural resources depen...
 
Day of Ecuador at Harvard KSG
Day of Ecuador at Harvard KSGDay of Ecuador at Harvard KSG
Day of Ecuador at Harvard KSG
 
Quilotoa Loop, Ecuador´s hidden secret
Quilotoa Loop, Ecuador´s hidden secret Quilotoa Loop, Ecuador´s hidden secret
Quilotoa Loop, Ecuador´s hidden secret
 
Tribunal permite demandas de ciudadanos ecuatorianos en caso CHEVRON
Tribunal permite demandas de ciudadanos ecuatorianos en caso CHEVRONTribunal permite demandas de ciudadanos ecuatorianos en caso CHEVRON
Tribunal permite demandas de ciudadanos ecuatorianos en caso CHEVRON
 
Day of Ecuador at Yale: Sumak Kawsay, Good Living Policies
Day of Ecuador at Yale: Sumak Kawsay, Good Living Policies Day of Ecuador at Yale: Sumak Kawsay, Good Living Policies
Day of Ecuador at Yale: Sumak Kawsay, Good Living Policies
 
Ecuador country outlook mar13
Ecuador country outlook mar13Ecuador country outlook mar13
Ecuador country outlook mar13
 
Mercado de turismo desde estados unidos vf rvncs-1
Mercado de turismo desde estados unidos  vf rvncs-1Mercado de turismo desde estados unidos  vf rvncs-1
Mercado de turismo desde estados unidos vf rvncs-1
 
Lista de empresasapoyo sgp
Lista de empresasapoyo sgpLista de empresasapoyo sgp
Lista de empresasapoyo sgp
 
Hm informe macroeconómico 0113
Hm informe macroeconómico 0113Hm informe macroeconómico 0113
Hm informe macroeconómico 0113
 
Degustación Comida Ecuatoriana
Degustación Comida EcuatorianaDegustación Comida Ecuatoriana
Degustación Comida Ecuatoriana
 
Resultados2011 códigoypoliticas
Resultados2011 códigoypoliticasResultados2011 códigoypoliticas
Resultados2011 códigoypoliticas
 
Ecuador Pushes Back Against Chevron's Drive To Suspend Trade Preferences
Ecuador Pushes Back Against Chevron's Drive To Suspend Trade PreferencesEcuador Pushes Back Against Chevron's Drive To Suspend Trade Preferences
Ecuador Pushes Back Against Chevron's Drive To Suspend Trade Preferences
 
Laa121003 atpdea ecuador oct 2012
Laa121003  atpdea   ecuador  oct 2012Laa121003  atpdea   ecuador  oct 2012
Laa121003 atpdea ecuador oct 2012
 
Respuesta Nathalie Cely a Latin American Advisor sobre Asilo Assange
Respuesta Nathalie Cely a Latin American Advisor sobre Asilo AssangeRespuesta Nathalie Cely a Latin American Advisor sobre Asilo Assange
Respuesta Nathalie Cely a Latin American Advisor sobre Asilo Assange
 
Food FDI investment trend
Food FDI investment trendFood FDI investment trend
Food FDI investment trend
 
Three possiblefuturesjorgedominguez
Three possiblefuturesjorgedominguezThree possiblefuturesjorgedominguez
Three possiblefuturesjorgedominguez
 
Taxes transfersandredistributionnoralusitgfinal
Taxes transfersandredistributionnoralusitgfinalTaxes transfersandredistributionnoralusitgfinal
Taxes transfersandredistributionnoralusitgfinal
 
Energy genaroarriagadafinal 1
Energy genaroarriagadafinal 1Energy genaroarriagadafinal 1
Energy genaroarriagadafinal 1
 

Recently uploaded

Securing your Kubernetes cluster_ a step-by-step guide to success !
Securing your Kubernetes cluster_ a step-by-step guide to success !Securing your Kubernetes cluster_ a step-by-step guide to success !
Securing your Kubernetes cluster_ a step-by-step guide to success !
KatiaHIMEUR1
 
Neuro-symbolic is not enough, we need neuro-*semantic*
Neuro-symbolic is not enough, we need neuro-*semantic*Neuro-symbolic is not enough, we need neuro-*semantic*
Neuro-symbolic is not enough, we need neuro-*semantic*
Frank van Harmelen
 
PCI PIN Basics Webinar from the Controlcase Team
PCI PIN Basics Webinar from the Controlcase TeamPCI PIN Basics Webinar from the Controlcase Team
PCI PIN Basics Webinar from the Controlcase Team
ControlCase
 
Elevating Tactical DDD Patterns Through Object Calisthenics
Elevating Tactical DDD Patterns Through Object CalisthenicsElevating Tactical DDD Patterns Through Object Calisthenics
Elevating Tactical DDD Patterns Through Object Calisthenics
Dorra BARTAGUIZ
 
FIDO Alliance Osaka Seminar: FIDO Security Aspects.pdf
FIDO Alliance Osaka Seminar: FIDO Security Aspects.pdfFIDO Alliance Osaka Seminar: FIDO Security Aspects.pdf
FIDO Alliance Osaka Seminar: FIDO Security Aspects.pdf
FIDO Alliance
 
From Siloed Products to Connected Ecosystem: Building a Sustainable and Scala...
From Siloed Products to Connected Ecosystem: Building a Sustainable and Scala...From Siloed Products to Connected Ecosystem: Building a Sustainable and Scala...
From Siloed Products to Connected Ecosystem: Building a Sustainable and Scala...
Product School
 
Encryption in Microsoft 365 - ExpertsLive Netherlands 2024
Encryption in Microsoft 365 - ExpertsLive Netherlands 2024Encryption in Microsoft 365 - ExpertsLive Netherlands 2024
Encryption in Microsoft 365 - ExpertsLive Netherlands 2024
Albert Hoitingh
 
UiPath Test Automation using UiPath Test Suite series, part 3
UiPath Test Automation using UiPath Test Suite series, part 3UiPath Test Automation using UiPath Test Suite series, part 3
UiPath Test Automation using UiPath Test Suite series, part 3
DianaGray10
 
Dev Dives: Train smarter, not harder – active learning and UiPath LLMs for do...
Dev Dives: Train smarter, not harder – active learning and UiPath LLMs for do...Dev Dives: Train smarter, not harder – active learning and UiPath LLMs for do...
Dev Dives: Train smarter, not harder – active learning and UiPath LLMs for do...
UiPathCommunity
 
FIDO Alliance Osaka Seminar: Passkeys and the Road Ahead.pdf
FIDO Alliance Osaka Seminar: Passkeys and the Road Ahead.pdfFIDO Alliance Osaka Seminar: Passkeys and the Road Ahead.pdf
FIDO Alliance Osaka Seminar: Passkeys and the Road Ahead.pdf
FIDO Alliance
 
Software Delivery At the Speed of AI: Inflectra Invests In AI-Powered Quality
Software Delivery At the Speed of AI: Inflectra Invests In AI-Powered QualitySoftware Delivery At the Speed of AI: Inflectra Invests In AI-Powered Quality
Software Delivery At the Speed of AI: Inflectra Invests In AI-Powered Quality
Inflectra
 
UiPath Test Automation using UiPath Test Suite series, part 4
UiPath Test Automation using UiPath Test Suite series, part 4UiPath Test Automation using UiPath Test Suite series, part 4
UiPath Test Automation using UiPath Test Suite series, part 4
DianaGray10
 
Key Trends Shaping the Future of Infrastructure.pdf
Key Trends Shaping the Future of Infrastructure.pdfKey Trends Shaping the Future of Infrastructure.pdf
Key Trends Shaping the Future of Infrastructure.pdf
Cheryl Hung
 
State of ICS and IoT Cyber Threat Landscape Report 2024 preview
State of ICS and IoT Cyber Threat Landscape Report 2024 previewState of ICS and IoT Cyber Threat Landscape Report 2024 preview
State of ICS and IoT Cyber Threat Landscape Report 2024 preview
Prayukth K V
 
Leading Change strategies and insights for effective change management pdf 1.pdf
Leading Change strategies and insights for effective change management pdf 1.pdfLeading Change strategies and insights for effective change management pdf 1.pdf
Leading Change strategies and insights for effective change management pdf 1.pdf
OnBoard
 
Generating a custom Ruby SDK for your web service or Rails API using Smithy
Generating a custom Ruby SDK for your web service or Rails API using SmithyGenerating a custom Ruby SDK for your web service or Rails API using Smithy
Generating a custom Ruby SDK for your web service or Rails API using Smithy
g2nightmarescribd
 
Transcript: Selling digital books in 2024: Insights from industry leaders - T...
Transcript: Selling digital books in 2024: Insights from industry leaders - T...Transcript: Selling digital books in 2024: Insights from industry leaders - T...
Transcript: Selling digital books in 2024: Insights from industry leaders - T...
BookNet Canada
 
Bits & Pixels using AI for Good.........
Bits & Pixels using AI for Good.........Bits & Pixels using AI for Good.........
Bits & Pixels using AI for Good.........
Alison B. Lowndes
 
AI for Every Business: Unlocking Your Product's Universal Potential by VP of ...
AI for Every Business: Unlocking Your Product's Universal Potential by VP of ...AI for Every Business: Unlocking Your Product's Universal Potential by VP of ...
AI for Every Business: Unlocking Your Product's Universal Potential by VP of ...
Product School
 
GenAISummit 2024 May 28 Sri Ambati Keynote: AGI Belongs to The Community in O...
GenAISummit 2024 May 28 Sri Ambati Keynote: AGI Belongs to The Community in O...GenAISummit 2024 May 28 Sri Ambati Keynote: AGI Belongs to The Community in O...
GenAISummit 2024 May 28 Sri Ambati Keynote: AGI Belongs to The Community in O...
Sri Ambati
 

Recently uploaded (20)

Securing your Kubernetes cluster_ a step-by-step guide to success !
Securing your Kubernetes cluster_ a step-by-step guide to success !Securing your Kubernetes cluster_ a step-by-step guide to success !
Securing your Kubernetes cluster_ a step-by-step guide to success !
 
Neuro-symbolic is not enough, we need neuro-*semantic*
Neuro-symbolic is not enough, we need neuro-*semantic*Neuro-symbolic is not enough, we need neuro-*semantic*
Neuro-symbolic is not enough, we need neuro-*semantic*
 
PCI PIN Basics Webinar from the Controlcase Team
PCI PIN Basics Webinar from the Controlcase TeamPCI PIN Basics Webinar from the Controlcase Team
PCI PIN Basics Webinar from the Controlcase Team
 
Elevating Tactical DDD Patterns Through Object Calisthenics
Elevating Tactical DDD Patterns Through Object CalisthenicsElevating Tactical DDD Patterns Through Object Calisthenics
Elevating Tactical DDD Patterns Through Object Calisthenics
 
FIDO Alliance Osaka Seminar: FIDO Security Aspects.pdf
FIDO Alliance Osaka Seminar: FIDO Security Aspects.pdfFIDO Alliance Osaka Seminar: FIDO Security Aspects.pdf
FIDO Alliance Osaka Seminar: FIDO Security Aspects.pdf
 
From Siloed Products to Connected Ecosystem: Building a Sustainable and Scala...
From Siloed Products to Connected Ecosystem: Building a Sustainable and Scala...From Siloed Products to Connected Ecosystem: Building a Sustainable and Scala...
From Siloed Products to Connected Ecosystem: Building a Sustainable and Scala...
 
Encryption in Microsoft 365 - ExpertsLive Netherlands 2024
Encryption in Microsoft 365 - ExpertsLive Netherlands 2024Encryption in Microsoft 365 - ExpertsLive Netherlands 2024
Encryption in Microsoft 365 - ExpertsLive Netherlands 2024
 
UiPath Test Automation using UiPath Test Suite series, part 3
UiPath Test Automation using UiPath Test Suite series, part 3UiPath Test Automation using UiPath Test Suite series, part 3
UiPath Test Automation using UiPath Test Suite series, part 3
 
Dev Dives: Train smarter, not harder – active learning and UiPath LLMs for do...
Dev Dives: Train smarter, not harder – active learning and UiPath LLMs for do...Dev Dives: Train smarter, not harder – active learning and UiPath LLMs for do...
Dev Dives: Train smarter, not harder – active learning and UiPath LLMs for do...
 
FIDO Alliance Osaka Seminar: Passkeys and the Road Ahead.pdf
FIDO Alliance Osaka Seminar: Passkeys and the Road Ahead.pdfFIDO Alliance Osaka Seminar: Passkeys and the Road Ahead.pdf
FIDO Alliance Osaka Seminar: Passkeys and the Road Ahead.pdf
 
Software Delivery At the Speed of AI: Inflectra Invests In AI-Powered Quality
Software Delivery At the Speed of AI: Inflectra Invests In AI-Powered QualitySoftware Delivery At the Speed of AI: Inflectra Invests In AI-Powered Quality
Software Delivery At the Speed of AI: Inflectra Invests In AI-Powered Quality
 
UiPath Test Automation using UiPath Test Suite series, part 4
UiPath Test Automation using UiPath Test Suite series, part 4UiPath Test Automation using UiPath Test Suite series, part 4
UiPath Test Automation using UiPath Test Suite series, part 4
 
Key Trends Shaping the Future of Infrastructure.pdf
Key Trends Shaping the Future of Infrastructure.pdfKey Trends Shaping the Future of Infrastructure.pdf
Key Trends Shaping the Future of Infrastructure.pdf
 
State of ICS and IoT Cyber Threat Landscape Report 2024 preview
State of ICS and IoT Cyber Threat Landscape Report 2024 previewState of ICS and IoT Cyber Threat Landscape Report 2024 preview
State of ICS and IoT Cyber Threat Landscape Report 2024 preview
 
Leading Change strategies and insights for effective change management pdf 1.pdf
Leading Change strategies and insights for effective change management pdf 1.pdfLeading Change strategies and insights for effective change management pdf 1.pdf
Leading Change strategies and insights for effective change management pdf 1.pdf
 
Generating a custom Ruby SDK for your web service or Rails API using Smithy
Generating a custom Ruby SDK for your web service or Rails API using SmithyGenerating a custom Ruby SDK for your web service or Rails API using Smithy
Generating a custom Ruby SDK for your web service or Rails API using Smithy
 
Transcript: Selling digital books in 2024: Insights from industry leaders - T...
Transcript: Selling digital books in 2024: Insights from industry leaders - T...Transcript: Selling digital books in 2024: Insights from industry leaders - T...
Transcript: Selling digital books in 2024: Insights from industry leaders - T...
 
Bits & Pixels using AI for Good.........
Bits & Pixels using AI for Good.........Bits & Pixels using AI for Good.........
Bits & Pixels using AI for Good.........
 
AI for Every Business: Unlocking Your Product's Universal Potential by VP of ...
AI for Every Business: Unlocking Your Product's Universal Potential by VP of ...AI for Every Business: Unlocking Your Product's Universal Potential by VP of ...
AI for Every Business: Unlocking Your Product's Universal Potential by VP of ...
 
GenAISummit 2024 May 28 Sri Ambati Keynote: AGI Belongs to The Community in O...
GenAISummit 2024 May 28 Sri Ambati Keynote: AGI Belongs to The Community in O...GenAISummit 2024 May 28 Sri Ambati Keynote: AGI Belongs to The Community in O...
GenAISummit 2024 May 28 Sri Ambati Keynote: AGI Belongs to The Community in O...
 

Social trendsgeorgegrayfinal 1

  • 1. Social Trends in Latin America: Time to Move Beyond Growth? George Gray Molina1 Latin America is into its tenth year of sustained economic growth. Since 2002, poverty has dropped by about 51 million people, (31 percent of the population is poor using national poverty lines, and 28 percent is poor using the $US 4/day international poverty line).2 Inequality has also dropped in 14 of 17 countries, led by improvements in labor income and better educational returns at the bottom of the income distribution.3 Despite the good news, the region continues to face structural challenges hindering further progress. This is a good time to take stock of the growth-poverty linkages, and ask what lessons can be learned from the Latin American track record. An important question is whether further social gains can be expected from economic growth –or whether gains are slowing down. The evidence on this question is, so far, mixed. On the one hand, most poverty and inequality reduction can be explained by rapid and sizeable increases in labor income, followed by the effect of public (CCTs or non-contributive pensions) and private transfers (remittances and the like).4 The rapid rise in labor incomes tends to support the view that most achievements are growth-led. On the other hand, not enough is known about how labor markets translate firm-level growth into broad- based income generation. Rather than trickle-down via good jobs in high-productivity sectors, most recent growth is occurring in service sectors fueled by consumer demand. Can current gains be accounted for by what is happening solely in the labor markets or are the long run effects of educational and health policies 1 George Gray Molina, United Nations Development Programme (UNDP), Regional Bureau for Latin American and the Caribbean. Email: george.gray.molina@undp.org. All opinions are personal, and do not reflect the institutional position of UNDP. Many thanks to Susana Martinez for permission to use research from Martinez, Susana and George Gray Molina, 2012, “The High Hanging Fruit of Latin America Progress”, Human Development Research Brief 01/2012, New York, UNDP. 2 World Bank, 2011, On the Edge of Uncertainty: Poverty Reduction in Latin America and the Caribbean during the Great Recession and Beyond, Washington DC: The World Bank, CEPAL 2011, Panorama Social de America Latina, Santiago: CEPAL. 3 Lopez-Calva, Luis Felipe and Nora Lustig (editors), 2010, Declining Inequality in Latin America: A Decade of Progress?, Washington: Brookings Institution and UNDP. 2009, Gasparini, Leonardo and Nora Lustig, 2011, “The Rise and Fall of Income Inequality in Latin America”, La Plata: CEDLAS. 4 World Bank, 2011, op. cit. 1
  • 2. playing an enabling role?5 In addition, are policy interventions in the labor market, such as formalization or minimum wage floors, also playing a role?6 If so, inequality-reducing actions set the stage for current poverty reduction. This brief is organized in three parts. The first part describes the existing pattern of poverty reduction. Where did most of it happen? Who missed out and why? The second part describes microtrends that diverge from country averages, and may set the stage for a future wave of social progress: idle youth, female labor participation, service sector changes and growth of intermediate cities. The third part considers policy challenges. What to do? The High-hanging Fruit of Latin American Progress The recent track record is non-random –i.e. labor income gains concentrate mostly in the service sectors of LAC economies, favoring male workers more than women, and largely bypassing youth employment. Labor income was also tempered cyclically, as labor shares improved during crises, and public transfers weighed most at the peak of the economic crisis in 2009. This pattern reveals a number of interesting stylized facts that run counter to the conventional wisdom. First, rises in labor income account for an estimated 45 percent of the total poverty reduction effect, followed by social transfers (16 percent) and pensions (10 percent) and an increase in the number of working age individuals (9 percent).7 While the regional proportions vary from country to country, with Brazil and Chile showing more of an impact from transfers and pensions, and Mexico showing a larger impact from labor income, the overall figures are significant, if only because they provide an order of magnitude on what matters. Wages are rising in Latin America, like they haven’t for close to two decades. Second, the mechanisms that secured poverty reduction are also different from either the Chinese or Asian patterns of growth. In contrast to economies that are driven by strong manufacturing/export sectors that create jobs in non tradeable sectors –transportation, logistics, processing, and export-oriented services--LAC economies seem to be growing primarily on the basis of domestic consumption driven by commodity exports, but not by improvements in manufacturing or technological upgrading. Easy and available credit fueled consumer growth that made its way to construction and low-skilled services –this is the heart of new job creation and rising wages. Third, if the low-hanging fruit is exhausted –if labor markets are tightening for low-skilled service sector jobs, mostly male, mostly for 25 to 49 year olds —we will need to focus on those left-out or excluded from the dynamic labor markets the high-hanging fruit of Latin American social progress: youth employment, female labor participation, non-agricultural rural markets and manufacturing and knowledge intensive sectors. This maps out a potential policy agenda for the future. The ongoing economic 5 UNDP 2010, Human Development Report 2010: The Real Wealth of Nations: Pathways to Human Development, New York, UNDP, Gray Molina, George and Mark Purser, 2010, “Human Development Trends since 1970: A Social Convergence Story”, Working Paper 02/2010, Kenny, Charles, 2011, Getting Better: Why Global Development Is Succeeding--And How We Can Improve the World Even More, New York: Basic Books. 6 Saúl N. Keifman and Roxana Maurizio, 2012, Changes in Labour Market Conditions and Policies: Their Impact on Wage Inequality during the Last Decade, Helsinki: UNU-Wider. 7 Azevedo, Joao Pedro, Gabriela Inchauste and Vivian Sanfelice, 2012, “Decomposing the Decline in Income Inequality in Latin America”, paper presented at the Network for Inequality and Poverty (NIP) Conference, April, Columbia University, New York, NY. 2
  • 3. transformation in the region can be described as one in which employees are leaving low-skilled, low productivity and poorly paid jobs in agriculture or the manufacturing sector, moving to low-skill services such as retail trade and personal services, mostly in the informal sector (domestic service, street vendors or beauty parlor owners). According to the recent regional data, 177 million people still live under the poverty line in Latin America and the Caribbean –70 million under the indigence line.8 Can further gains in poverty reduction be achieved by a longer growth spell? Yes, because there are still gains to be made with further growth in labor income and by expanding coverage of existing fiscal and social protection programs. But, no, because much of the remaining poverty is concentrated in non-random pockets of the population , sectors and geographic areas, that have either hit declining returns upon more of the same, or are simply excluded from the dynamic sectors of the economy and/or existing social safety nets. Two general trends are salient. First, labor participation and wages have increased since 1995. Males have benefited to a greater extent from the increase in wages and labor participation. The second trend is that the share of labor participation in the service sector accounts for more than 60 percent of total employment and --with the exception of Peru-- has increased since 1995. The manufacturing sector and primary sectors have also shrunk since 1995 with the exception of Brazil in manufacturing and Peru in primary activities. Microtrends that Point to New Challenges Microtrends, group-specific trends that deviate from country averages, help describe the speed and direction of ongoing social and economic change. For example, increased access to education will, in the absence of technological upgrading, erode returns to education; urbanization, which improved access to services in large cities in the past, will tend to reach scale diseconomies; and the demographic dividend, which delivered a decline in labor dependency ratios, will eventually stretch labor markets and start to age.9 Some microtrends have gained demographic traction in the past and describe the trends of today. Others have simply disappeared or become less relevant over time. There are some advantages to describing microtrends in systematic fashion. First, there is insight to be gained from disaggregating demographic, social and labor data by age, geographic location, sex, ethnic group and so on. Disaggregation points to existing and enduring disparities, to growing or shrinking gaps. Second, by pinpointing microtrends for certain groups –women participating in the formal labor market or youth entering the labor force for the first time, for example—we are able to focus more tightly on hypotheses and mechanisms that might have a large impact over future trends (human capital, skills premium, labor productivity, wage shares, etc). Third, by describing microtrends we may foresee important future policy opportunities and challenges. If the past three decades were mostly marked by urbanization, drops in fertility rate and increased access to female education, the next decade is likely to be marked by processes 8 CEPAL, 2011, op cit. 9 The term “microtrend” comes from Mark Penn, 2007, Microtrends: The Small Forces Behind Tomorrow’s Big Changes (New York: Twelve), who constructs an insightful map and toolkit for grassroots political organizing. 3
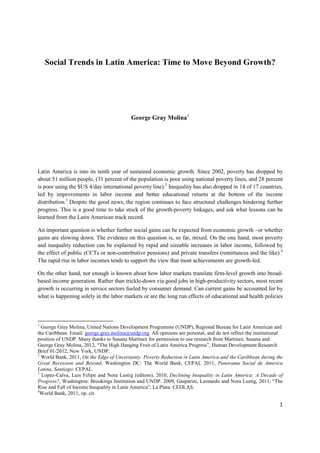
  • 4. that are, perhaps, only incipient today (increased global migration, climate change patterns, changing demographic composition of the household, adoption of new communication technologies, crime and violence). In this section I describe four microtrends that might have an impact in the future. Idle Youth, as labor markets are booming One of the paradoxes of economic growth in Latin America is that despite greater educational and labor opportunities, there is a large number of young individuals who do not study and do not work. This is a phenomenon known as “idle youth”10 or NINIs, referring to those that “ni estudian, ni trabajan.” Currently, 18.5 percent of Latin American youth between the ages of 15 and 18 (9.4 million) do not work and do not study. The interesting thing is that the highest rates observed for these age groups are in countries with very different economic and cultural trajectories: By 2009, it represented 28 percent of the age group of 15 to 18 in Honduras (237.000), 25.3 percent in Guatemala (237.000), 26.1 percent in Peru (754.000), 20.5 percent in Chile (304.000), and 20.4 percent in Colombia (865.000)11. Figure 1, reveals that except for the cases of Peru, Bolivia and the Dominican Republic, between 50 to 60 percent of idle youth is concentrated in the lowest income quintiles (Quintiles 1 and 2). Figure 1. Idle youth by Income Quintiles LAC12 (Age Group 15 to 18) Quintile 5 100% (Highest) 80% Quintile 4 60% Quintile 3 40% Quintile 2 20% Quintile 1 0% (Lowest) 10 World Bank, 2011, op. cit. 11 Cardenas, M., de Hoyos, R., Szekely, M. (2011), Idle Youth in Latin America: A Persistent Problem in a Decade of Prosperity. In Latin America Initiative at Brookings. 4
  • 5. Note: Authors elaboration based on calculations using micro data from 214 household surveys (for the years 2007 and 2008) by Cardenas et al (2011). How to explain this phenomenon, in such diverse countries and in a context of sustained economic growth in the region since 2002? Figure 2, shows a snap shot of the Brazilian case. We observe several trends: first, there is increasing secondary school enrollment, with decreasing employment for the young population. This could suggest that greater educational opportunities are driving the young population out of the labor market. Nevertheless, we also observe that unemployment has increased by 5 percent since 1995. This trend suggests that although a lower percentage of young individuals are working, many are looking for a job and not finding one. This could explain why we also observe a steady trend of idle youth since 1995. Taking into consideration demographic growth, a 2 percent reduction of idle young would still imply that the same amount of young individuals are not studying and not working. Figure 2. Jobs, Schooling and Idle Youth in Brazil from 1995 to 2009 School enrollment, 80.0 secondary (% Net), 82.0 70.0 65.8 Employment ages 60.0 58.0 15-24, total (%), 52.5 50.0 40.0 30.0 Idle Youth (15-24), 20.7 18.6 20.0 11.4 Unemployment 10.0 (%15-24), 17.8 1995 2000 2005 2009 Note: Author’s own elaboration using SEDLAC – World Bank Data and the World Development Indicators. Young individuals do not seem to be benefiting to the same extent as adults from increasing economic growth and labor opportunities. Indeed, recent studies suggest that idleness is associated with factors such as extreme poverty and youth long term unemployment. More research needs to examine the role of other determinants that include the consumption of risky 5
  • 6. behaviors (eg. drugs, alcohol, distance to school, teen pregnancy, violence, the number of siblings in the household or structure of the household).12 20 to 50 Million Women Missing from Formal Labor Markets Another interesting microtrend, that has become a macrotrend in recent years, is the growing share of women in the formal labor force. The magnitude of this change is enormous. Over thirty years, participation rates moved by 10 to 15 percentage points in most countries. However, if LAC female participation rates converged with respect to female participation rates in OECD countries, 19 million more women would be employed in formal labor markets. If participation rates between men and women converged in Latin America, 50 million more women would join. Given the current structure of income generation and poverty reduction, the massive inclusion of women in formal labor markets is a must for future gains. The literature on female labor participation points to economic, cultural and technological obstacles to further expansions (Goldin 1997; Gutierrez 2009 and Katz and Goldin 2008). Beyond averages, however, there are particular stories that merit closer scrutiny. The key question is whether and how policy interventions can change incentives for increased participation. If they can, such policies are critical to move millions more out of poverty. Figure 3. Female labor participation LAC 70.0 Argentina Bolivia 65.0 Brazil Chile 60.0 Colombia Costa Rica 55.0 Dominican Rep. 50.0 Ecuador El Salvador 45.0 Grenada Guatemala 40.0 Guyana Honduras 35.0 Jamaica Mexico 30.0 Nicaragua Panama 25.0 Paraguay Peru 20.0 Trinidad and Tobago 1980 1981 1982 1983 1984 1985 1986 1987 1988 1989 1990 1991 1992 1993 1994 1995 1996 1997 1998 1999 2000 2001 2002 2003 2004 2005 2006 2007 2008 2009 Uruguay Venezuela 12 For evidence about Brazil’s idle youth see: Susana Martinez-Restrepo, “The Economics of Adolescents’ Time Allocation: Evidence from the Young Agent Project in Brazil” (PhD diss., Columbia University, 2012). For evidence about Mexico See: Arceo-Gómez, Eva; Campos Vasquez-Raymundo (2011). ¿Quienes son los NiNis en México? 6
  • 7. Figure 4. Labor force, female (% of total labor force) 66.0 LAC 61.0 56.0 Brazil all >15 51.0 Brazil (25-64) 46.0 41.0 Brazil (15-24) 36.0 Brazil Lowest 31.0 Income Quintile 26.0 Brazil Highest 1981 1982 1983 1984 1985 1986 1987 1988 1989 1990 1991 1992 1993 1994 1995 1996 1997 1998 1999 2000 2001 2002 2003 2004 2005 2006 2007 2008 2009 Income Quintile Note: Author’s own elaboration based on the Socio-Economic Database for Latin America and the Caribbean (CEDLAS and The World Bank) Two microtrends stand side by side in Figure 4. First, the richest 20 percent of the female population in Brazil is moving in the direction of greater female labor participation and higher incomes. Secondly, the poorest 20 percent of the female population is moving in the opposite direction of declining labor participation. When we zoom in on age groups, we observe that female labor participation rates have plateaued for 15 to 24 year olds since the 1990s. What is going on behind this trend? More educational opportunities? More barriers to youth employment? Another interesting microtrend is the case of the Dominican Republic. Despite the overall educational upgrade, the labor market seems to be benefiting low-skilled males in the informal sector. Figure 5 shows a change in the education attainment of unemployed individuals. In 2005, most unemployed males+ and females were those with primary (or less) education. Today, the unemployed individuals with tertiary (higher) education have increased 3 percent and those with secondary education, around 7 percent since 2005. The gender gap closed for the unemployed with secondary education but increased for those with primary education, benefiting more females than males. Figure 5. Share of unemployment by education level and gender 7
  • 8. 47.0 With secondary 43.7 education, female, 42.4 42.0 41.1 With secondary 37.4 education, male, 42.0 37.0 36.1 With primary education, male, 35.6 32.0 With primary 27.0 education, female, 29.4 22.0 With tertiary education, female, 20.6 17.0 17.0 With tertiary education, 15.6 male, 18.0 12.0 2005 2006 2007 2008 2009 2010 Source: Authors’ elaboration based on data from the World Development Indicators. Recent evidence suggests that the fall in the skill premia affects both employment and wages.13 In a 2006 study, Levy and Murnane, argue that middle-skilled jobs are most vulnerable to an increasingly global labor market. They suggest that while low-skilled service jobs must be done on-site, (eg. janitors, security guards, restaurant helpers, nursing home, construction workers, cleaning personnel), middle-skilled jobs (call centers, office assistants) can be outsourced offshore. These studies use evidence from the United States and OECD countries, so should be taken with caution14. The observation, however, does seem to apply to certain sectors of the Dominican Republic economy. The tourist industry in the Dominican Republic produces many direct and indirect jobs, most of which are low-skilled and low-paid jobs. Recent evidence reveals a drop in male and female participation in manufacturing industries that employ middle- skilled workers. Males present minor but increasing labor participation in activities in transportation and commerce. Job informality remains very high and constant since 2000 in the Dominican Republic among both males (48 percent) and females (47 percent). The Lop-Sided Service Sectors Recent growth has led to a growing share of employment in the service sectors, and a decreasing share in manufacturing and primary activities. Numbers of workers in the commerce, construction, and educational and health services have been particularly important throughout the 13 Gasparini, et al., Educational Upgrading and Return to Skills in Latin America Evidence from a Supply-Demand Framework, 1990–2010. Policy Research Working Paper 5921, Washington, DC: The World Bank, 2012. 14 Frank Levy, and Richard J. Murnane, For now, middle-skilled jobs are the most vulnerable,CESifo Forum, Ifo Institute for Economic Research at the University of Munich, vol. 7(2), pages 38-38, 07 . http://www.cesifo- group.de/portal/pls/portal/docs/1/1191752.PDF 8
  • 9. decade. The current composition of service sectors tends to weigh heavily in favor of low- skilled, low-pay labor markets. Graph 6. Service sector as % of occupied labor force 80.0 Argentina, 76.1 75.0 Uruguay, 70.5 70.0 Dominic Rep., 68.2 65.0 Panama, 62.7 60.0 Brazil , 61.3 55.0 Paraguay, 53.6 50.0 45.0 Bolivia, 43.5 Honduras, 42.9 40.0 35.0 Peru, 34.1 30.0 1995 2000 2005 2009 Note: Author’s own elaboration based on the Socio-Economic Database for Latin America and the Caribbean (CEDLAS and The World Bank) The Peruvian case, however, suggests a different story. Although the service sector represents 56 percent of total jobs in Peru, it is the only country --among those studied in this brief-- where the share of the service sector has decreased and where the share of primary activities has increased. Figures 7 and 8 below show the share of employment from 1995 to 2009 in Peru within the primary activities and within the service sector. Most job creation since 1995 has been in agriculture related jobs and mining in primary activities. Despite a general decrease of the share of the overall service sector in the economy, industries such as commerce, transportation and communications, health and social services have also increased their share since 1995. The strong economic growth in Peru since 2003 is mainly a result of a booming tourism sector, the development of agriculture and agro-business, extractive industry sector (mining), and infrastructure development. 9
  • 10. Figure 7. Share of employment within Figure 8. Share of employment within the Primary activities service sector Domestic servants 45.0 60.0 Other services 3.2 3.1 40.0 3.5 3.2 1.4 0.9 5.8 Mining & 2.0 2.2 3.6 Health and social 50.0 3.5 7.3 0.6 0.6 1.1 quarrying 4.8 5.2 services 35.0 1.6 0.7 0.7 3.5 3.0 4.7 5.3 Teaching 30.0 40.0 3.7 3.2 3.3 0.9 0.8 1.0 0.6 Agriculture, 5.4 5.9 3.1 6.3 Public 25.0 Fishing 30.0 4.5 5.6 5.6 0.8 administration 20.0 5.2 Business services 36.2 34.5 31.0 31.6 Agriculture, 20.0 15.0 21.4 21.9 23.2 Finance hunting & 18.5 10.0 forestry 10.0 Transportation& 4.5 4.1 4.9 communications 5.0 3.3 Restaurants & 0.0 0.0 Circa Circa Circa Circa hotels Commerce Circa 1995Circa 2000Circa 2005Circa 2009 1995 2000 2005 2009 Note: Author’s own elaboration using aggregates of national household surveys calculated by SEDLAC – World Bank. Despite a greater share of the primary sector in overall employment, the service and manufacturing sectors have seen a greater increase in monthly wages since 1995. Wages in main activities in the service sector went from US$3,638 in 1995 to US$4,973 in 2009. In the manufacturing sector they went from US$ 962 to US$1402. They also increased in the primary sector but at a lower rate, from US$231 to US$ 353. This data suggests that it is workers in the service sector that are benefiting the most from Peru’s recent economic growth and increased in labor income. With increasing wages, there is a large share of service-sector and primary-sector jobs (such as agro-business, mining and commodities) that are also low-productivity and low-wage. Informal jobs accounted in 2009 for 63 percent of total workers in the labor market . Despite a small reduction of 1.5 percent in comparison to 1995, it remains the highest share among selected countries. Figure 9. Distribution of Services, Manufacturing and Primary Activity wages (USD) 10
  • 11. 5000 Services Monthly 4500 Income, 4973 4000 3638 3500 3000 2500 2000 Manufacture Monthly Income, 1402 1500 962 1000 500 Primary Activities 231 Monthly Income, 353 0 Circa 1995 Circa 2000 Circa 2005 Circa 2009 Note: Author’s own elaboration using aggregates of national household surveys calculated by SEDLAC – World Bank. Informality refers to salaried workers in a small firm, a non- professional self-employed, or a zero-income. The aggregate figures do not account for the fact that within each sector, there are different types of jobs –the mining sector, for example, employs both highly qualified and highly paid individuals (such as mining managers) and low paid and qualified individuals (such as miners). The individuals in low productivity jobs are the high hanging fruit of current economic growth. The question is then what relevant policies need to address this economic growth that is maintaining existing structural economic inequalities within internal economic transformations. Will Social Gains Slow Down? Fiscal constraints slow parts of the expansion Despite the additional fiscal space gained since the 2008/9 crisis, most Latin American economies –excluding Brazil, Uruguay and Argentina—face serious obstacles to raise tax revenue levels.15 Current revenues are about half the OECD rates and lead to a very constrained set of spending priorities. Most new spending --beyond inertial public sector allocations-- have either focused on the expansion of social transfers, or on expanding public sector employment. With close to 113 million social transfer recipients (25 percent of the population) in every country in the region, it is worth considering whether transfers will expand or target increasingly excluded groups. There are at least three aspects to the fiscal constraint question. The first concerns the sources of fiscal expansion. The region currently raises revenues from value added taxes and social security contributions, followed by specific consumption taxes. Corporate and income taxes still lag with respect to the OECD and other middle economies.16 In federal countries like Brazil, Argentina 15 IMF, 2012, World Economic Outlook (April 2012), Washington, DC: IMF. 16 OECD, ECLAC and CIAT, 2012, Revenue Statistics in Latin America, Santiago: CEPAL. 11
  • 12. and Mexico, a large share of revenue mobilization occurs at the subnational level and/or is earmarked to subnational spending or investment priorities. There are few sources for additional revenues beyond raising income taxes that already grate against middle class preferences. A new fiscal pact will need to focus on the structural demands of a growing population. Second, the pro-poor impact of fiscal transfers is still low or moderate. The evidence suggests, barring Chile, Brazil and perhaps Argentina, that most poor households in the region do not benefit from a significant change between their pre- and post-fiscal income –meaning that CCTs and other non-conditional transfers are not having much of a dent on poverty or income inequality.17 One problem is that transfers are typically too small to make up for large poverty gaps at the bottom of the distribution. An additional problem is that transfers typically show a lot of leakage from poor to non-poor households. The targeting question continues to dampen the overall impact. Finally, beyond the immediate monetary impact of transfers, most CCTs are not meant to bring households out of poverty but to provide demand incentives for human capital accumulation –to allow children to go to school and use public health services.18 The supply side is frequently missing in social services, and this deficit, which is both material and human resource-based, will take decades to fulfill. The supply-side constraint is particularly important for countries with large rural populations, and for rapidly growing urban centers that haven’t caught up with demand in the 2000s. A bridge from CCTs to a universal safety net is needed Beyond fiscal constraints, the move from targeted transfers to a universal basic income or service safety net is riddled with other challenges. The most important has to do with female labor participation and youth employment –both of which constrain the rate of broad-based progress because of their size. A welfare regime perspective is useful to gauge the magnitude of this shift.19 A large hidden cost to household decision-making is borne by women. While most OECD economies are underwritten by either market-led or state-provided safety nets, pensions or insurance from risk, most Latin American households are “familistic” in their labor and income strategies. The double burden faced by millions of women acts as a hidden subsidy on the rest of society, markets and state. It undergirds the current welfare regime in Latin America, and is among other things, blatantly unfair. The cost of transitioning millions of youth or women into the labor force –thus sustaining the rhythm of poverty reduction over the next decade --will require a new type of social compact that 17 Lustig, Nora et al, 2011, “Fiscal Policy and Income Redistribution in Latin America: Challenging the Conventional Wisdom”, New Orleans: Tulane University and Inter-American Dialogue. 18 Cecchini, Simone and Aldo Madariaga, 2011, Programas de Transferencias Condicionadas: Balance de la experiencia reciente de América Latina y el Caribe, Santiago: CEPAL. 19 Martinez, Juliana, 2008, “Welfare Regimes in Latin America: Capturing Constellations of Markets, Families and Policies” (Latin American Politics and Society, vol. 50, 2: 67-100). 12
  • 13. transcends fiscal revenue pressure. This is an issue that is likely to dominate future discussions of social policy because it intersects with economic policymaking –particularly job creation. Santiago Levy has focused on one important aspect of this question by zooming in on the behavioral impact of social protection policies over labor markets.20 An additional focus has been provided by a burgeoning literature on the economics of care.21 Both strands of research are focusing on the balance between labor markets and household decision-making. A third strand of work pulls some of these concerns together.22 How to integrate social and economic policymaking on job creation in the region? The trend, so far, has been marked by a division of labor. Economic policymaking has focused on stabilizing welfare in turbulent times and promoting economic growth in the good times; social policy tends to be compensatory and/or aimed at long-run human capital accumulation. The key in the future is to focus on the intersection which focuses on job creation with both market and state-led policy levers. This is what we turn to next. Are good jobs out of reach? In many respects, this is the best of times for labor markets. Labor participation –as measured by hours worked—is expanding, and labor income –as measured by income per hour—is also growing. At the same time, this is a unique moment to describe the job-creating pattern of current economic growth, most of it occurring in low-skill service sectors, for male workers from 25 to 49 years of age. The level of growth and poverty reduction is significant, but the reach is limited. Two forces move against “good job” creation in the region. The first is macro, linked to the pattern of economic specialization, technology content and export diversification of Latin American economies. Most growth is driven by a surge in commodity demand, and while this has not been detrimental to growth, it has structured incentives for labor market upgrading in the 2000s. The second force is micro, linked to the pattern of female labor participation and youth employment described earlier in this brief. The sectors that create new jobs are not likely to break through to non-participating females and youth, because the incentives are not there. The welfare regime that might employ more women in the labor force is largely absent in the region and shows little signs of materializing. Together, macro and micro incentives create a scissors for future poverty alleviation in the Latin America. In theory, we know from existing research that there is an important deficit in building higher productivity building blocks –service sectors, in particular, are frequently the weak link of global 20 Levy, Santiago, 2010, Good Intentions, Bad Outcomes: Social Policy, Informality, and Economic Growth in Mexico, Brookings Institution: Washington, DC. 21 Esquivel, Valeria, 2012, “La economía del cuidado en América Latina: poniendo a los cuidados en el centro de la agenda”, Area de Practica Genero, PNUD: Panama. 22 Martinez, Juliana and Diego Sanchez Ancochea, 2011, “The Productive Bottlenecks of Progressive Social Policies: Lessons from Costa Rica and Beyond”. CROP Poverty Brief, Bergen: CROP. 13
  • 14. supply chains.23 We also know from time-use surveys that the gap between male and female labor participation will not change without behavioral changes in the household and incentives from the state. What is holding the region back from moving ahead with reforms that might reach the “high-hanging fruit” of poverty reduction? Part of the answer seems to be political – linked to the time horizon of structural changes. But part of the answer is managerial: why engage in gender-equalizing, productivity-enhancing, sustainable development reforms when cutting the cost of doing business in the region is often seen as a more expedient route to enhancing competitiveness. This is a good moment to reflect on the kinds of structural obstacles that prevent future social and economic progress. Latin America is facing a crossroads. The best of times shows us how things are when we get our economic-growth wish. This might be the time to focus on our social wishes to spur future progress. 23 IDB, 2010, The Age of Productivity: Transforming LAC Economies from the Bottom-Up, Washington, DC: Inter- American Development Bank. 14