diagnosis of faults in bearings is very crucial for the reliable. This paper focuses on fault diagnosis of induction motor
bearing having localized defects using Daubechies wavelets-based feature extraction. In present study Machinery Fault
Simulator (MFS) test rig used for fault diagnosis of NSK-6203 deep groove ball bearing. Vibration signals collected from
the various bearing conditions- healthy bearing (HB), outer race defect (ORD), inner race defect (IRD), ball defect (BD)
and combined bearing defect (CBD). The extraction of statistical features carried out using various Daubechies wavelet
coefficients from raw vibration signals. Lastly, the bearing faults are classified using these statistical features as input to
Artificial Neural Network (ANN) technique used for faults classifications. The test result shows that ANN identifies the
fault categories of rolling element bearing more accurately for Db4 and has a better diagnosis performance as compared to
other Daubechies wavelets with ANN classifier.
Bearing fault detection using acoustic emission signals analyzed by empirical...eSAT Publishing House
IJRET : International Journal of Research in Engineering and Technology is an international peer reviewed, online journal published by eSAT Publishing House for the enhancement of research in various disciplines of Engineering and Technology. The aim and scope of the journal is to provide an academic medium and an important reference for the advancement and dissemination of research results that support high-level learning, teaching and research in the fields of Engineering and Technology. We bring together Scientists, Academician, Field Engineers, Scholars and Students of related fields of Engineering and Technology
Corrosion detection under pipe supports using EMAT Medium Range Guided WavesInnerspec Technologies
Corrosion detection under pipe supports is a recurrent problem in petrochemical and other process industries, with limited inspection alternatives due to the lack of immediate access to the corroded area. Long-Range UT (LRUT) has been used for years to inspect inaccessible areas but the large blind zone, limited resolution, and complex interpretation makes it difficult to field for this application.
EMAT-generated Medium-Range UT (MRUT) addresses these limitations and provides a robust and proven solution to the problem. EMAT is a non-contact technique that can generate guided waves without couplant or pressure, and permits scanning the part with a single tranducer on parts without surface preparation. Using a single Shear Horizontal and Lamb wave transducer, EMAT MRUT provides excellent near field resolution (no blind zone) and it can detect defects ten times
smaller than LRUT. EMAT MRUT is easy to field, and requires limited training.
Innerspec Technologies will present the MRUT technique with special focus on practical examples of their experience in the field.
Visit www.innerspec.com
Ultrasonic investigation of bio liquid mixtures of methanol with cinnamaldehy...eSAT Publishing House
IJRET : International Journal of Research in Engineering and Technology is an international peer reviewed, online journal published by eSAT Publishing House for the enhancement of research in various disciplines of Engineering and Technology. The aim and scope of the journal is to provide an academic medium and an important reference for the advancement and dissemination of research results that support high-level learning, teaching and research in the fields of Engineering and Technology. We bring together Scientists, Academician, Field Engineers, Scholars and Students of related fields of Engineering and Technology
Automotive silencer plays an important role in dyna mic performance of the exhaust system. As silencer is located at the tail end of the exhau st system with minimum support,it is subjected to intense vibrations. These vibrations c ause localized stresses in silencer. The vibrations and stresses are analyzed by finite elem ent method. Modal analysis is performed to evaluate dynamic characteristics of the silencer. I t is observed that natural frequencies are away from excitation frequency. Further,dynamic fr equency response analysis is performed with 3G acceleration in all directions varying with frequency. It is noticed that the stresses are concentrated at a joint between inlet pipe and flan ge and these stresses are above the material yield stress limit in X and Y directions. Hence,in order to reduce the induced stresses,the structural modification in silencer is proposed and subsequent analysis is carried out. The obtained stresses are below the yield stress limit in X as well as Y direction. The FEM results are verified by experimental results.
Fault Diagnostics of Rolling Bearing based on Improve Time and Frequency Doma...ijsrd.com
The neural network based approaches a feed forward neural network trained with Back Propagation technique was used for automatic diagnosis of defects in bearings. Vibration time domain signals were collected from a normal bearing and defective bearings under various speed conditions. The signals were processed to obtain various statistical parameters, which are good indicators of bearing condition, then best features are selected from graphical method and these inputs were used to train the neural network and the output represented the bearing states. The trained neural networks were used for the recognition of bearing states. The results showed that the trained neural networks were able to distinguish a normal bearing from defective bearings with 83.33 % reliability. Moreover, the network was able to classify the bearings into different states with success rates better than those achieved with the best among the state-of-the-art techniques.
Wavelet Analysis of Vibration Signature of a Bevel Gear Box in a Stand of St...IJMER
In manufacturing industry Gear boxes are one of the important components in power
transmission. Consequently any damage in the gearbox can lead to unprecedented downtime. In
machines the gear trains vibrate due to many reasons such as the non regular nature of load, the
manufacturing error of the gear teeth, gear back lash, misalignment of the connecting shaft and also
due to continuous usage. As a common rule machines do not stop working or fail without some form of
caution, which is indicated by an increased vibration level. The most effective instruments which are
used in reading the root cause of the trouble are the Vibration analyzers, which collects the vibration
signature at the problematic source. In the present work the vibration analysis of bevel gear box in a
vertical rolling stand of Light and Medium Merchant Mill (LMMM) at Vizag steel plant is considered
for the purpose of condition monitoring. The vibration signatures of input and output shafts of bevel
gear box in vertical, horizontal and axial directions are collected at input and output shafts of the gear
box using Vb8 instrument. The signatures so collected were further analyzed using wavelet analysis.
The analysis is carried out at no-load and loaded conditions at regular intervals of operation for
monitoring the gear box and results are discussed.
PHYSIOLOGICAL TREMOR ESTIMATION USING BANDLIMITED FOURIER LINEAR COMBINERijiert bestjournal
In robotic assisted surgery accurate cancelation of physiological tremor plays vital role. Tremor is the core cause for human imprecision during microsurgery. Physiological tremor makes some procedures remarkably difficult to perform and this involuntary motion affects the performance of robotic based hand held instruments. The presence of phase delay due to sensing or filtering procedures degrades the performance of human - machine intervention. To conquer the phase delay,multistep prediction can be emplo yed. The paper includes the estimation of tremor by using single step and multistep BMFLC method. The comparative study of the results proved that the multistep BMFLC method for tremor prediction is more efficient.
Rolling Element Bearing Condition Monitoring using Filtered Acoustic Emission IJECEIAES
The defect present in the bearing of a rolling element may affect the performance of the rotating machinery and may reduce its efficiency. For this reason the condition monitoring of a rolling element bearing is very essential. So many measuring parameters are there to diagnose the fault in a rolling element bearing. Acoustic signature monitoring is one of them. Every rolling element bearing has its own acoustic signature when it is in healthy condition and when the bearing get defected then there is a change in its original acoustic signature. This change in acoustic signature can be monitored and analyzed to detect the fault present in the bearing. But the noise present in the acquired acoustic signal may affect the analysis. So the noisy acoustic signal must be filtered before the analysis. In this work the experiment is performed in two stages. In first stage the filtration of the acquired acoustic signal is done by employing the active noise cancellation (ANC) filtering techniques. In second stage the filtered signal is used for the further analysis. For the analysis initially the static analysis is done and then the frequency and the time-frequency analysis is done to diagnose the defect in the bearing. From all the three analysis the information about the defect present in the bearing is well detected.
International Journal of Engineering Research and Development (IJERD)IJERD Editor
call for paper 2012, hard copy of journal, research paper publishing, where to publish research paper,
journal publishing, how to publish research paper, Call For research paper, international journal, publishing a paper, IJERD, journal of science and technology, how to get a research paper published, publishing a paper, publishing of journal, publishing of research paper, reserach and review articles, IJERD Journal, How to publish your research paper, publish research paper, open access engineering journal, Engineering journal, Mathemetics journal, Physics journal, Chemistry journal, Computer Engineering, Computer Science journal, how to submit your paper, peer reviw journal, indexed journal, reserach and review articles, engineering journal, www.ijerd.com, research journals,
yahoo journals, bing journals, International Journal of Engineering Research and Development, google journals, hard copy of journal
Nondestructive Testing (NDT) has evolved from being a “necessary evil” to being an essential source of competitive advantage. The right technique not only helps control the quality of the final product, but also provides valuable process control feedback to improve productivity, reduce cost, and increase the
efficiency of the welder. This is especially important in high-volume, continuous processing lines where a few minutes of bad production can result in significant losses.
In the last decade, powerful Ultrasonic EMAT technology has come of age with tremendous success, becoming the technique of choice for many applications.
Diagnosis of broken bars fault in induction machines using higher order spect...ISA Interchange
Detection and identification of induction machine faults through the stator current signal using higher order spectra analysis is presented. This technique is known as motor current signature analysis (MCSA). This paper proposes two higher order spectra techniques, namely the power spectrum and the slices of bi-spectrum used for the analysis of induction machine stator current leading to the detection of electrical failures within the rotor cage. The method has been tested by using both healthy and broken rotor bars cases for an 18.5 kW-220 V/380 V-50 Hz-2 pair of poles induction motor under different load conditions. Experimental signals have been analyzed highlighting that bi-spectrum results show their superiority in the accurate detection of rotor broken bars. Even when the induction machine is rotating at a low level of shaft load (no-load condition), the rotor fault detection is efficient. We will also demonstrate through the analysis and experimental verification, that our proposed proposed-method has better detection performance in terms of receiver operation characteristics (ROC) curves and precision-recall graph.
Conditioning Monitoring of Gearbox Using Different Methods: A ReviewIJMER
Gears are important element in a variety of industrial applications such as machine tool
and gearboxes. An unexpected failure of the gear may cause significant economic losses. For that
reason, fault diagnosis in gears has been the subject of intensive research. Vibration signal analysis
has been widely used in the fault detection of rotation machinery. Fault diagnosis plays an important
role in condition monitoring to enhance the machine time. In view of this, the present investigation
focused on the development of Fault diagnosis system of gearboxes based on the vibration signatures
and Artificial Neural Networks. In the present investigation to generate the vibration signatures an
experimental set-up has been fabricated with sensing and measuring equipment. The prominent faults,
wear, crack, broken tooth and insufficient lubrication of the gear were practically induced in the
present investigation. Vibration signatures of the gearbox were collected by transmitting the motion at
constant speed with gears having no fault, without applying any load. By inducing one fault at a time,
vibration signatures were collected with different degrees of wear on a gear tooth, a gear with a
broken tooth, tooth with crack and with insufficient lubrication. As the vibration data of maximum
amplitudes was found to be inseparable, fault diagnosis based on this data was not possible. Five
prominent statistical features were extracted based on data pertaining to maximum amplitudes of
vibration and used fault diagnosis. Due overlapping of this data, it was decided to use ANN based
fault diagnosis system for the present investigation. The set of statistical features were extracted based
on data pertaining to maximum amplitudes of vibration and used them as input parameters to the
ANN based fault diagnosis system designed.
Handheld Solution for Measurement of Residual Stresses on Railway Wheels usin...Innerspec Technologies
The braking process used on railroad cars is known to create tensile stresses in the circumferential direction due to the thermal expansion and subsequent cooling of the wheel rim. This tensile stress can significantly accelerate the growth of small cracks on the rolling surface which can cause a spall or catastrophic failure
of the wheel under load. By periodically evaluating the tensile stress, railroad companies can prevent wheel failures and derailments that can be extremely dangerous and costly. Innerspec Technologies has developed the first, portable, battery-operated handheld instrument that can be used to provide rail-side inspections and facilitate operation in any environment. The instrument is coupled with a proprietary, patent-pending, dual-channel sensor that does not need to be rotated during inspection thus simplifying the operation, increasing the reliability and accuracy of results, and reducing complexity and inspection cycle time.
Mems Based Motor Fault Detection in Windmill Using Neural NetworksIJRES Journal
Today wind turbine technology is one of the fastest growing power generation technologies operating in large numbers at harsh and difficult environment sites and it is difficult to monitor each and every windmill separately. There are times when faults occur in motors of windmills are not detected in earlier stage and we come to know about damage when motor gets fully damaged. Here we using wireless monitoring based on MEMS accelerometer sensor which senses the vibrations occurring in the motor and based on the severity of vibrations, sensor sends the data to the controlling unit to take further action. Neural network based work is included to get the accurate and precise vibratory signals to detect fault at a very early stage to avoid full damage to the motor.
Today wind turbine technology is one of the fastest growing power generation technologies operating in large numbers at harsh and difficult environment sites and it is difficult to monitor each and every windmill separately. There are times when faults occur in motors of windmills are not detected in earlier stage and we come to know about damage when motor gets fully damaged. Here we using wireless monitoring based on MEMS accelerometer sensor which senses the vibrations occurring in the motor and based on the severity of vibrations, sensor sends the data to the controlling unit to take further action. Neural network based work is included to get the accurate and precise vibratory signals to detect fault at a very early stage to avoid full damage to the motor.
Performance Analysis of OFDM system using LS, MMSE and Less Complex MMSE in t...AM Publications
In this research, Channel estimation has been accomplished for OFDM framework. In wireless communication, because of a nonappearance of channel estimation a decent execution of communication doesn't accomplish. Also, it is critical for wireless communication that transmission of information at high rate and transmission with least mistake could conceivable. Such a variety of times in remote correspondence, abundance of a sign get vacillated. This variance influences the execution of wireless communication. So to beat these issues channel estimation is essential. In channel estimation pilots get joined with transmitting information, and this consolidated data goes through channel and reaches at recipient. At accepting side estimation get perform with the assistance of those pilots. OFDM have a significance in remote correspondence as OFDM gives high rate of data, additionally it gives low multipath contortion, these properties are essential to increase great execution of remote correspondence. This is motivation to choose OFDM in this study. This concentrate essentially thinks about three distinct calculations for divert estimation in OFDM framework. Likewise this study contrasts these calculations and traditional OFDM. This study utilizes comb type pilot insertion method, and this procedure is extremely valuable to diminish the impact of fast fading in wireless communication environment.
International Journal of Computational Engineering Research (IJCER) is dedicated to protecting personal information and will make every reasonable effort to handle collected information appropriately. All information collected, as well as related requests, will be handled as carefully and efficiently as possible in accordance with IJCER standards for integrity and objectivity
Smart Sound Processing for Defect Sizing in Pipelines Using EMAT Actuator Bas...Innerspec Technologies
Pipeline inspection is a topic of particular interest to the companies. Especially important is the defect sizing, which allows them to avoid subsequent costly repairs in their equipment. A solution for this issue is using ultrasonic waves sensed through Electro-Magnetic Acoustic Transducer (EMAT)
actuators. The main advantage of this technology is the absence of the need to have direct contact with the surface of the material under investigation, which must be a conductive one. Specifically interesting is the meander-line-coil based Lamb wave generation, since the directivity of the waves allows a study based in the circumferential wrap-around received signal. However, the variety of defect sizes changes the behavior of the signal when it passes through the pipeline. Because of that, it is necessary to apply advanced techniques based on Smart Sound Processing (SSP). These methods involve extracting useful information from the signals sensed with EMAT at different frequencies to obtain nonlinear estimations of the depth of the defect, and to select the features that better estimate the profile of the pipeline. The proposed technique has been tested using both simulated and real signals in steel pipelines, obtaining good results in terms of Root Mean Square Error (RMSE).
Damage Detection in Beams Using Frequency Response Function Curvatures Near R...Subhajit Mondal
Structural damage detection from measured vibration responses has gain
popularity among the research community for a long time. Damage is identified in
structures as reduction of stiffness and is determined from its sensitivity towards the
changes in modal properties such as frequency, mode shape or damping values with
respect to the corresponding undamaged state. Damage can also be detected directly
from observed changes in frequency response function (FRF) or its derivatives and
has become popular in recent time. A damage detection algorithm based on FRF
curvature is presented here which can identify both the existence of damage as well
as the location of damage very easily. The novelty of the present method is that the
curvatures of FRF at frequencies other than natural frequencies are used for
detecting damage. This paper tries to identify the most effective zone of frequency
ranges to determine the FRF curvature for identifying damages. A numerical
example has been presented involving a beam in simply supported boundary
condition to prove the concept. The effect of random noise on the damage detection
using the present algorithm has been verified.
Due to the increasing number of private cars in today's society, there are a lot of
safety problems in car reversing. This paper proposes a research program of ultrasonic
ranging car reversing radar system with higher accuracy and better warning effect. According
to the principle of ultrasonic ranging, the AT89C51 single-chip microcomputer is selected as
the core circuit, and the anti-interference error processing is adopted in the processing of the
single-chip microcomputer to solve the multiple measurement, the transmission time interval
and the dead zone measurement problem of the ultrasonic ranging. Car reversing radar
system based on ultrasonic ranging adopt transmitting and receiving circuit, will determine
the time difference in the single chip microcomputer. the results are sent to the digital display
circuit and voice broadcast circuit. Finally, it is verified by experiments that after ultrasonic
error measurement adopts error processing, under the complicated environmental conditions,
the accuracy of ranging is higher, the number of false alarms is reduced, and the device has
high reliability and practicability.
SELECTION OF SPECTRUM SENSING METHOD TO ENHANCE QOS IN COGNITIVE RADIO NETWORKSijwmn
The massively increasing number of wireless communication devices has led to considerable growths in
radio traffic density, resulting in a predictable shortage of the available spectrum. To address this potential
shortage, the Cognitive Radio (CR) technology offers promising solutions that aim to improve the spectrum
utilization. The operation of CR relies on detecting the so-called spectrum holes, i.e., the frequency bands
when they are unoccupied by their licensed operators. The unlicensed users are then allowed to
communicate using these spectrum holes. Consequently, the performance of CR is highly dependent on the
employed spectrum sensing methods. Several sensing methods are already available or literarily proposed.
However, no individual method can accommodate all possible CR operation scenarios. Hence, it is fair to
ascertain that the performance of a CR device can be improved if it is capable of supporting several
sensing methods. Then it should be able to effectively select the most suitable method. In this paper, several
spectrum sensing methods are compared and analyzed, aiming to identify their advantages and
shortcomings in different CR operating conditions. Furthermore, it identifies the factors that need to be
considered while selecting a proper sensing method from the catalog of available methods.
Condition Monitoring of Rotating Equipment Considering the Cause and Effects ...IJMERJOURNAL
ABSTRACT: This paper attempts to summarise and review the recent research and developments in diagnostics and prognostics of mechanical systems implementing Condition Monitoring with emphasis on models, algorithms and technologies for data processing and maintenance decision-making. Realising the increasing trend of using multiple sensors in condition monitoring, the authors also discuss different techniques for multiple sensor data fusion. The paper concludes with a brief discussion on current practices, possible future trends of Condition Monitoring with a brief outline on the novelty of the current research work.
CFD Simulation of By-pass Flow in a HRSG module by R&R Consult.pptxR&R Consult
CFD analysis is incredibly effective at solving mysteries and improving the performance of complex systems!
Here's a great example: At a large natural gas-fired power plant, where they use waste heat to generate steam and energy, they were puzzled that their boiler wasn't producing as much steam as expected.
R&R and Tetra Engineering Group Inc. were asked to solve the issue with reduced steam production.
An inspection had shown that a significant amount of hot flue gas was bypassing the boiler tubes, where the heat was supposed to be transferred.
R&R Consult conducted a CFD analysis, which revealed that 6.3% of the flue gas was bypassing the boiler tubes without transferring heat. The analysis also showed that the flue gas was instead being directed along the sides of the boiler and between the modules that were supposed to capture the heat. This was the cause of the reduced performance.
Based on our results, Tetra Engineering installed covering plates to reduce the bypass flow. This improved the boiler's performance and increased electricity production.
It is always satisfying when we can help solve complex challenges like this. Do your systems also need a check-up or optimization? Give us a call!
Work done in cooperation with James Malloy and David Moelling from Tetra Engineering.
More examples of our work https://www.r-r-consult.dk/en/cases-en/
Vaccine management system project report documentation..pdfKamal Acharya
The Division of Vaccine and Immunization is facing increasing difficulty monitoring vaccines and other commodities distribution once they have been distributed from the national stores. With the introduction of new vaccines, more challenges have been anticipated with this additions posing serious threat to the already over strained vaccine supply chain system in Kenya.
Explore the innovative world of trenchless pipe repair with our comprehensive guide, "The Benefits and Techniques of Trenchless Pipe Repair." This document delves into the modern methods of repairing underground pipes without the need for extensive excavation, highlighting the numerous advantages and the latest techniques used in the industry.
Learn about the cost savings, reduced environmental impact, and minimal disruption associated with trenchless technology. Discover detailed explanations of popular techniques such as pipe bursting, cured-in-place pipe (CIPP) lining, and directional drilling. Understand how these methods can be applied to various types of infrastructure, from residential plumbing to large-scale municipal systems.
Ideal for homeowners, contractors, engineers, and anyone interested in modern plumbing solutions, this guide provides valuable insights into why trenchless pipe repair is becoming the preferred choice for pipe rehabilitation. Stay informed about the latest advancements and best practices in the field.
Overview of the fundamental roles in Hydropower generation and the components involved in wider Electrical Engineering.
This paper presents the design and construction of hydroelectric dams from the hydrologist’s survey of the valley before construction, all aspects and involved disciplines, fluid dynamics, structural engineering, generation and mains frequency regulation to the very transmission of power through the network in the United Kingdom.
Author: Robbie Edward Sayers
Collaborators and co editors: Charlie Sims and Connor Healey.
(C) 2024 Robbie E. Sayers
NO1 Uk best vashikaran specialist in delhi vashikaran baba near me online vas...Amil Baba Dawood bangali
Contact with Dawood Bhai Just call on +92322-6382012 and we'll help you. We'll solve all your problems within 12 to 24 hours and with 101% guarantee and with astrology systematic. If you want to take any personal or professional advice then also you can call us on +92322-6382012 , ONLINE LOVE PROBLEM & Other all types of Daily Life Problem's.Then CALL or WHATSAPP us on +92322-6382012 and Get all these problems solutions here by Amil Baba DAWOOD BANGALI
#vashikaranspecialist #astrologer #palmistry #amliyaat #taweez #manpasandshadi #horoscope #spiritual #lovelife #lovespell #marriagespell#aamilbabainpakistan #amilbabainkarachi #powerfullblackmagicspell #kalajadumantarspecialist #realamilbaba #AmilbabainPakistan #astrologerincanada #astrologerindubai #lovespellsmaster #kalajaduspecialist #lovespellsthatwork #aamilbabainlahore#blackmagicformarriage #aamilbaba #kalajadu #kalailam #taweez #wazifaexpert #jadumantar #vashikaranspecialist #astrologer #palmistry #amliyaat #taweez #manpasandshadi #horoscope #spiritual #lovelife #lovespell #marriagespell#aamilbabainpakistan #amilbabainkarachi #powerfullblackmagicspell #kalajadumantarspecialist #realamilbaba #AmilbabainPakistan #astrologerincanada #astrologerindubai #lovespellsmaster #kalajaduspecialist #lovespellsthatwork #aamilbabainlahore #blackmagicforlove #blackmagicformarriage #aamilbaba #kalajadu #kalailam #taweez #wazifaexpert #jadumantar #vashikaranspecialist #astrologer #palmistry #amliyaat #taweez #manpasandshadi #horoscope #spiritual #lovelife #lovespell #marriagespell#aamilbabainpakistan #amilbabainkarachi #powerfullblackmagicspell #kalajadumantarspecialist #realamilbaba #AmilbabainPakistan #astrologerincanada #astrologerindubai #lovespellsmaster #kalajaduspecialist #lovespellsthatwork #aamilbabainlahore #Amilbabainuk #amilbabainspain #amilbabaindubai #Amilbabainnorway #amilbabainkrachi #amilbabainlahore #amilbabaingujranwalan #amilbabainislamabad
Automobile Management System Project Report.pdfKamal Acharya
The proposed project is developed to manage the automobile in the automobile dealer company. The main module in this project is login, automobile management, customer management, sales, complaints and reports. The first module is the login. The automobile showroom owner should login to the project for usage. The username and password are verified and if it is correct, next form opens. If the username and password are not correct, it shows the error message.
When a customer search for a automobile, if the automobile is available, they will be taken to a page that shows the details of the automobile including automobile name, automobile ID, quantity, price etc. “Automobile Management System” is useful for maintaining automobiles, customers effectively and hence helps for establishing good relation between customer and automobile organization. It contains various customized modules for effectively maintaining automobiles and stock information accurately and safely.
When the automobile is sold to the customer, stock will be reduced automatically. When a new purchase is made, stock will be increased automatically. While selecting automobiles for sale, the proposed software will automatically check for total number of available stock of that particular item, if the total stock of that particular item is less than 5, software will notify the user to purchase the particular item.
Also when the user tries to sale items which are not in stock, the system will prompt the user that the stock is not enough. Customers of this system can search for a automobile; can purchase a automobile easily by selecting fast. On the other hand the stock of automobiles can be maintained perfectly by the automobile shop manager overcoming the drawbacks of existing system.
Quality defects in TMT Bars, Possible causes and Potential Solutions.PrashantGoswami42
Maintaining high-quality standards in the production of TMT bars is crucial for ensuring structural integrity in construction. Addressing common defects through careful monitoring, standardized processes, and advanced technology can significantly improve the quality of TMT bars. Continuous training and adherence to quality control measures will also play a pivotal role in minimizing these defects.
Water scarcity is the lack of fresh water resources to meet the standard water demand. There are two type of water scarcity. One is physical. The other is economic water scarcity.
COLLEGE BUS MANAGEMENT SYSTEM PROJECT REPORT.pdfKamal Acharya
The College Bus Management system is completely developed by Visual Basic .NET Version. The application is connect with most secured database language MS SQL Server. The application is develop by using best combination of front-end and back-end languages. The application is totally design like flat user interface. This flat user interface is more attractive user interface in 2017. The application is gives more important to the system functionality. The application is to manage the student’s details, driver’s details, bus details, bus route details, bus fees details and more. The application has only one unit for admin. The admin can manage the entire application. The admin can login into the application by using username and password of the admin. The application is develop for big and small colleges. It is more user friendly for non-computer person. Even they can easily learn how to manage the application within hours. The application is more secure by the admin. The system will give an effective output for the VB.Net and SQL Server given as input to the system. The compiled java program given as input to the system, after scanning the program will generate different reports. The application generates the report for users. The admin can view and download the report of the data. The application deliver the excel format reports. Because, excel formatted reports is very easy to understand the income and expense of the college bus. This application is mainly develop for windows operating system users. In 2017, 73% of people enterprises are using windows operating system. So the application will easily install for all the windows operating system users. The application-developed size is very low. The application consumes very low space in disk. Therefore, the user can allocate very minimum local disk space for this application.
Hybrid optimization of pumped hydro system and solar- Engr. Abdul-Azeez.pdffxintegritypublishin
Advancements in technology unveil a myriad of electrical and electronic breakthroughs geared towards efficiently harnessing limited resources to meet human energy demands. The optimization of hybrid solar PV panels and pumped hydro energy supply systems plays a pivotal role in utilizing natural resources effectively. This initiative not only benefits humanity but also fosters environmental sustainability. The study investigated the design optimization of these hybrid systems, focusing on understanding solar radiation patterns, identifying geographical influences on solar radiation, formulating a mathematical model for system optimization, and determining the optimal configuration of PV panels and pumped hydro storage. Through a comparative analysis approach and eight weeks of data collection, the study addressed key research questions related to solar radiation patterns and optimal system design. The findings highlighted regions with heightened solar radiation levels, showcasing substantial potential for power generation and emphasizing the system's efficiency. Optimizing system design significantly boosted power generation, promoted renewable energy utilization, and enhanced energy storage capacity. The study underscored the benefits of optimizing hybrid solar PV panels and pumped hydro energy supply systems for sustainable energy usage. Optimizing the design of solar PV panels and pumped hydro energy supply systems as examined across diverse climatic conditions in a developing country, not only enhances power generation but also improves the integration of renewable energy sources and boosts energy storage capacities, particularly beneficial for less economically prosperous regions. Additionally, the study provides valuable insights for advancing energy research in economically viable areas. Recommendations included conducting site-specific assessments, utilizing advanced modeling tools, implementing regular maintenance protocols, and enhancing communication among system components.
Hybrid optimization of pumped hydro system and solar- Engr. Abdul-Azeez.pdf
Sensors multi fault detection
1. Sensors 2014, 14, 20320-20346; doi:10.3390/s141120320
sensors
ISSN 1424-8220
www.mdpi.com/journal/sensors
Article
Multi-Fault Detection of Rolling Element Bearings under
Harsh Working Condition Using IMF-Based Adaptive
Envelope Order Analysis
Ming Zhao 1
, Jing Lin 2,
*, Xiaoqiang Xu 1
and Xuejun Li 3
1
School of Mechanical Engineering, Xi’an Jiaotong University, Xi’an 710049, China;
E-Mails: zhaomingxjtu@mail.xjtu.edu.cn (M.Z.); xuxiaoqiang@stu.xjtu.edu.cn (X.X.)
2
State Key Laboratory for Manufacturing Systems Engineering, Xi’an Jiaotong University,
Xi’an 710049, China
3
College of Mechanical and Electrical Engineering, Hunan University of Science and Technology,
Xiangtan 411201, China; E-Mail: hnkjdxlxj@163.com
* Author to whom correspondence should be addressed; E-Mail: jinglin@mail.xjtu.edu.cn;
Tel./Fax: +86-29-8339-5041.
External Editor: Vittorio M.N. Passaro
Received: 19 September 2014; in revised form: 19 October 2014 / Accepted: 20 October 2014 /
Published: 28 October 2014
Abstract: When operating under harsh condition (e.g., time-varying speed and load, large
shocks), the vibration signals of rolling element bearings are always manifested as low
signal noise ratio, non-stationary statistical parameters, which cause difficulties for
current diagnostic methods. As such, an IMF-based adaptive envelope order analysis
(IMF-AEOA) is proposed for bearing fault detection under such conditions. This approach
is established through combining the ensemble empirical mode decomposition (EEMD),
envelope order tracking and fault sensitive analysis. In this scheme, EEMD provides an
effective way to adaptively decompose the raw vibration signal into IMFs with different
frequency bands. The envelope order tracking is further employed to transform the
envelope of each IMF to angular domain to eliminate the spectral smearing induced by
speed variation, which makes the bearing characteristic frequencies more clear and
discernible in the envelope order spectrum. Finally, a fault sensitive matrix is established to
select the optimal IMF containing the richest diagnostic information for final decision
making. The effectiveness of IMF-AEOA is validated by simulated signal and
experimental data from locomotive bearings. The result shows that IMF-AEOA could
OPEN ACCESS
2. Sensors 2014, 14 20321
accurately identify both single and multiple faults of bearing even under time-varying
rotating speed and large extraneous shocks.
Keywords: rolling element bearing; multi-fault diagnosis; time-varying rotating speed;
fault sensitive matrix
1. Introduction
Rolling element bearings are common and vital mechanical components that are widely used in
rotating machinery, and their malfunction may lead to uncomfortable vibration and noise, or even
breakdown of the entire production line. As a result, it is crucial to detect bearing faults before a
catastrophic failure occurs. A variety of monitoring and diagnostic techniques for rolling element
bearings have been developed in recent years. Among those, vibration analysis has been proven to be
the most fundamental and versatile one that plays an important role in bearing faults diagnosis.
When the rolling element passes through a faulty surface, a force impact is generated and this in
turn excites the resonance frequency of the bearing system [1,2]. As the bearing rotates, these impulses
will occur periodically with a frequency uniquely determined by the location of the defect. For this
reason, the detection of faults in bearings is commonly achieved by identifying the bearing
characteristic frequencies (BCFs), i.e., ball pass frequency of inner-race (BPFI), ball pass frequency of
outer-race (BPFO), or ball spin frequency (BSF). However, those impulses are very weak at the early
stage of faults and are usually overwhelmed by measurement noise and other vibration sources (such as
gear mesh and rotor unbalance), which causes difficulties for the early fault detection of bearings. For the
purpose of signal denoising and weak signature enhancement, a variety of signal processing techniques
have been proposed in recent years. They mainly include high frequency resonance technique (HFR) [3],
spectral kurtosis [4–6], wavelet analysis [7,8], empirical mode decomposition [9,10], cyclostationary
approach [11–15], minimum entropy deconvolution [16,17] and stochastic resonance [18–21] etc. Among
those, the HFR is the most widely used since it could extract the fault-related amplitude-modulation that
resides in a narrow band around the resonance and may minimize the effects of interfering signals in
lower frequency range. Nevertheless, the major challenge in the application of HFR lies in how to
choose the optimal frequency band for demodulation [22]. In early days, the demodulation frequency
band was selected either by trial and error, or by shock testing using a hammer, both of which are
rather inconvenient for practical applications. To address this issue, the spectral kurtosis (SK) method
was intensively investigated by Antoni and Randall [4,5]. It is shown that SK is an effective statistical
tool which can indicate not only transient components in the signal but also their locations in the
frequency domain, thus providing a guideline for the optimal demodulation bandwidth selection in the
envelope analysis. However, the original SK is time-consuming and not suitable for on-line fault
detection. To overcome this issue, a 1/3-binary tree fast kurtogram estimator was further proposed
Antoni, which made on-line condition monitoring a reality [6]. Since then, improvements of both SK
and the kurtogram have attracted increasingly attention of researchers [23]. By introducing Wavelet
Package Transform (WPT), Lei et al. [24] presented an improved kurtogram method which employs
WPT as the filter-bank to overcome the shortcomings of the original kurtogram. A novel tool called
3. Sensors 2014, 14 20322
Protrugram [25] is proposed by Barszcz and Jabłoński in 2011 for the optimal band selection, which is
proven to be more effective than kurtogram in detecting the transient under heavy noise. In the same
year, Wang et al. [22] proposed an adaptive spectral kurtosis for the multiple bearing faults detection.
Considering the low time-frequency resolution of traditional kurtogram, Li et al. [26] developed a
continuous-scale mathematical morphology (CSMM) scheme to locate the optimal scale band that best
reflects the impulsive feature for more reliable fault signature extraction. Inspired by wavelet packet
transform, an enhanced kurtogram was recently presented by Wang et al. [27]. In that method, the
kurtosis values are calculated based on the envelope signals extracted from wavelet packet nodes at
different depths, instead of band-pass filtered waveforms.
Although the aforementioned methods have shown different levels of success in bearing fault
diagnosis, it is noted that most of those methods assume that the frequency band with largest kurtosis
value is the resonance excited by the fault, and regard it as the best choice for demodulation. However,
this assumption is not valid in many practical applications, especially when the bearing runs under
harsh operation conditions. For instance, the measured signals of on-line locomotive bearing
monitoring system are always corrupted by the impacts when the wheel goes through the joints
between two successive railway tracks; the bearing signal of high-speed spindle usually suffered from
transient vibration due to the non-continuous milling process. In addition, some incidental spikes
caused by electromagnetic interference are frequently encountered in industrial applications. All the
interferences mentioned above are impulse-like, which are very similar to the signature caused
by bearing fault. Moreover, those interferences are always characterized by high amplitude and
short-duration, thus have even larger kurtosis values than those of fault signatures. For this reason,
when the maximum-kurtosis based approaches are applied to those signals, the strong interference will
probably be extracted, however leaving the real fault signature undetected.
Besides, the traditional diagnostic methods are also premised on the assumption that the bearing is
operating at a constant speed [28]. However, there are a variety of applications where the bearings
experience different extents of speed variations due to non-stationary working condition. For instance,
the rotating speed (RS) of automobile bearings are varying with its driving speed, the RS of mining
excavator bearings are affected by the external load [29], and the RS of a wind turbine main bearing
fluctuates with the wind power and speed [30]. In those cases, the repetition frequencies of impacts are
also time-varying, hence the impulse signal and its envelope are non-stationary in nature. The direct
application of frequency-based methods to those signals will result in spectral smearing and false
diagnosis, even though the fault-induced impulses are extracted effectively [31,32].
This paper aims to provide a reliable and effective bearing diagnostic method capable of extracting
fault signatures from the strong impulse interferences. In addition, it is also expected that this method
applies not only to bearings under constant speed, but also those under variable speeds. For this
purpose, an enhanced bearing signal analysis technique called IMF-AEOA is proposed by integrating
the individual merits of ensemble empirical mode decomposition (EEMD), envelope order tracking
and fault sensitive analysis. Compared with WT and HFR, the decomposition process of EEMD is
data-driven and self-adaptive according to the natural oscillatory mode embedded in the signal, thus
providing a fine separation of fault-related signal from the background noise and other interference.
In addition, since the envelope of each IMF is resampled from time domain to angular domain,
the spectral smearing problem encountered in varying speed cases is addressed successfully. By
4. Sensors 2014, 14 20323
performing envelope order analysis (EOA), the BCFs of real faults are enhanced in the order domain
due to angular cyclostationary characteristics, while the interferences are weakened since they are
randomly distributed in the vibration signal. On this basis, a fault sensitive matrix (FSM) is further
established to quantitatively assess how much diagnostic information each IMF has, with which the
optimal component containing the richest diagnostic information may be identified for final decision
making. By combining those advantages of EEMD, EOA and FSM, both single and multi-fault of
bearing can be detected effectively even under varying speed operations and strong interferences.
The rest of this article is organized as follows: After a briefly review of EMD and EEMD in
Section 2, the principle and implementation of proposed bearing diagnostic technique, IMF-AEOA, is
elaborated in Section 3. The advantages of IMF-AEOA in interference resistance, multi-fault
identification as well as variable speed application are demonstrated by simulation analysis in
Section 4. The effectiveness of this approach is validated by application to locomotive bearing
diagnosis in Section 5. Finally, some conclusions are drawn in Section 6.
2. A Briefly Review of EMD and EEMD
Before the introduction of EEMD, we will first give a briefly review of the classical Empirical
Mode Decomposition (EMD) technique. EMD is a novel and effective signal processing technique,
originally proposed by Huang et al. [33] in 1998. It can decompose a complicated signal into a set of
complete and almost orthogonal components called intrinsic mode functions (IMFs), and each IMF
represents one simple oscillatory signal mode [10]. It has been proven to be quite versatile for
extracting signals from data generated in noisy nonlinear and non-stationary processes. In comparison
with the WT, the decomposition process of EMD is data-driven and self-adaptive, according to the
natural oscillatory mode embedded in the signal, rather than the pre-determined mother function.
Those properties make the EMD a powerful tool in a wide variety of applications, such as voice
recognition, system identification, medicine and biology, system control, etc. Studies on EMD applied
to fault diagnosis of rotating machinery have also grown at a very rapid rate in the past few years,
covering the diagnostic problems of rotors, gears and bearings.
However, the original EMD algorithm is not perfect. One of the major drawbacks of EMD is the mode
mixing problem [34], which not only leads to serious aliasing in time-frequency distributions, but also
makes the physical meanings of individual IMFs unclear. To alleviate this problem, a noise-assisted
data analysis method, called ensemble empirical mode decomposition, was proposed by Wu and
Huang [35] in 2009. The EEMD method first adds white noise with finite amplitude to the analyzed
signals. Since the white noise is uniformly distributed throughout the frequency domain, no missing
scales are present and hence the components in different scales of the signal are automatically
projected onto proper scales of reference established by the white noise in the background [35]. As a
result, the mode mixing due to the existence of intermittency is overcome effectively. Finally, the
added white noise can be decreased or even completely canceled out in the ensemble mean of
sufficient trails. In contrast to EMD, EEMD has better scale separation ability and more robust to
mode mixing problem, which make it an appropriate candidate for analyzing the bearing vibration
signals that inevitably contain intensive noises and other interference.
Based on the above discussion, the algorithm of EEMD can be summarized as follows:
5. Sensors 2014, 14 20324
(1) Initialize the number of trials in the ensemble, J, and the amplitude of added white noise.
Set trial number j = 1;
(2) Generate a white noise series with the preset amplitude and add it to the analyzed signal, i.e.:
( ) ( ) ( )
j j
x t x t n t
= + (1)
where nj(t) is the j-th added noise signal, xj(t) denotes the noise-added signal of the j-th trial.
(3) Decompose the white noise-added signal into M IMFs by EMD, and we can obtain:
, ,
1
( ) ( ) ( )
M
j j m j M
m
x t c t r t
=
= +
(2)
where cj,m(t) and rj,M(t) demote the mth IMF and the residue of the j-th trial, respectively; M is the
number of IMF of the j-th trial.
(4) If the trial number is smaller than the termination number, i.e., j < J, then go to step (2) with
j = j + 1. Repeat steps (2) and (3) again, but with independent random white noise signals each time.
(5) Calculate the ensemble mean of corresponding IMFs in each trail as the final result:
,
1
1
( ) ( ), 1,2, .
J
m j m
j
c t c t m M
J =
= =
(3)
Generally, the noise amplitude is selected about 0.2–0.3 times the standard deviation of the original
signal. However, since we primarily concern the high-frequency resonances where the bearing fault
signatures residing in, the noise amplitude may be selected much smaller so as to separate those
high-frequency components better as suggested in [35,36]. For this reason, the noise amplitude is set as
0.1 times the standard deviation of the original signal in our practice. Under this amplitude, an ensemble
number of 100 is sufficient to suppress the added noise. Using such a signal processing technique, a
complicated non-stationary bearing signal, x(t), could finally decomposed into a finite number of IMFs
representing the natural oscillatory mode of x(t). For more details about EEMD readers may refer to [35].
3. The Proposed IMF-AEOA Method for Bearing Fault Diagnosis
To effectively detect the faults of rolling element bearings under harsh working condition, an
IMF-based adaptive envelope order analysis (IMF-AEOA) technique is proposed in this section. The
flow chart of the IMF-AEOA is shown in Figure 1, and its principle and implementation are elaborated
as follows:
Step 1. Decompose the Raw Vibration Signal into IMFs Using EEMD
As discussed previously, the vibration signal of bearings in industrial applications is rather
complicated, and always contains impulses caused by bearing faults, the rotating harmonics due to
unbalance and misalignment, the strong meshing vibration coming from gears, and the high-amplitude
impulses resulting from other interference, etc. Therefore, it is advisable to separate those components
before more advanced signal processing techniques are applied. To achieve this, EEMD is utilized to
decompose the raw vibration into different subbands in terms of IMFs. Each IMF contains signal
components within certain oscillation frequency range. Since the signal decomposition scheme is
6. Sensors 2014, 14 20325
data-driven and self-adaptive, the EEMD can provide a nature separation of signal components
according to their oscillation characteristics.
Figure 1. Flowchart of proposed IMF-AEOA.
Step 2. Perform Envelope Order Analysis on Each IMF
After applying the EEMD to the bearing signal, the impulses related to bearing faults may be
decomposed into certain IMFs. Nevertheless, for incipient bearing faults, the signatures may be so
weak that we can hardly identify them in the waveform of each IMF. Although the envelope spectrum
is an effective tool for bearing fault diagnosis, however, the envelope of impulses is non-stationary
under speed-varying working conditions, which in turn leads to the smearing effect in the envelope
spectrum. Therefore, the envelope spectrum cannot be used directly for those signals. To overcome
this limitation, the envelope order analysis (EOA) is performed on each IMF. In this step, the envelope
of each IMF, ˆ ( )
i
c t , is first obtained by calculating the modulus of its analytic signal, which is given by:
[ ]
ˆ ( ) ( ) H ( )
i i i
c t c t j c t
= + (4)
where H denotes the Hilbert transform.
Then the envelopes are resampled with equal angular increments according to the instantaneous
speed v(t) of bearing shaft. In practice, v(t) can be calculated either from a tachometer signal or the
vibration signal itself [37]. Through the above procedure, the non-stationary envelope signal in
time-domain can be transformed into a cyclostationary one in the angular domain. By performing
Fourier transform on the resampled signals, we can get the envelope order spectrums of each IMF. The
BCFs of real faults are enhanced in the envelope order spectrum due to their inherent angular
7. Sensors 2014, 14 20326
cyclostationary characteristics, in the meantime the strong interferences are eliminated since they are
randomly distributed in the vibration signal.
Step 3. Find out the Optimal IMFs Using Fault Sensitive Matrix
For the signal acquired from a complex mechanical system, the number of decomposed IMFs can
reach up to a dozen or more. It is a boring and time-consuming work to diagnose the fault by checking
each IMF via visual inspection. In order for this method to be applicable in an on-line monitoring
system, the health status or the fault types of bearing should be identified in an automatic manner.
Moreover, since the fault-induced impact may simultaneously excite several resonance zones of the
bearing system, the diagnostic information may distribute in multiple frequency bands. Therefore,
several interesting and crucial problems arise in bearing fault diagnosis: How to find the most sensitive
IMF to certain faults? Does the diagnostic information of different faults reside in the same IMF? In
previous research works, the most sensitive IMF is usually selected according to its kurtosis value [10].
As pointed out previously, the IMF with largest kurtosis value is probably caused by interference,
rather than fault signatures.
To address this issue, an automatic optimal IMF selection scheme based on fault sensitive matrix
(FSM) is established. In this scheme, a significance indicator (SI) for fault signature, Sm,type is first
proposed to measure the sensitivity of m-th IMF to a certain type of fault. Taking inner-race fault for
example, the SI is defined as the energy ratio between the spectral component at BPFI and the local
noise level around it, which is given as follows:
[ ]
[ ]
,
( )
, 0.5 ,1.5
( )
m BPFI
m Inner BPFI BPFI
m f u
A f
S u f f
RMS A f ∈
= = (5)
where Am(fBPFI) denotes the amplitude of BPFI in the envelope order spectrum of m-th IMF, while the
denominator in Equation (5) is the root mean square (RMS) value of the local background noise in the
range of 0.5fBPFI ~1.5fBPFI.
If there is no inner-race fault, the SI will remain a low value since no BPFI component is provoked
in the envelope order spectrum. However, if an inner-race fault occurs, those indicators will increase to
different degrees for different IMFs. Therefore, the sensitivity of each IMF to inner-race fault could be
evaluated according to its SI, and the optimal one may be determined. From the definition in
Equation (5), we can see that the SI can also be extend to outer-race and rolling element faults directly.
By taking all the possible faults into consideration, a fault sensitive matrix of dimension 3 × M can be
constructed as follows:
1, 2, ,
1, 2, ,
1, 2, ,
Inner Inner M Inner
Outer Outer M Outer
Ball Ball M Ball
S S S
S S S
S S S
(6)
Each row of the matrix reveals the sensitivities of different IMFs to a certain fault, while each
column gives the sensitivities of a certain IMF to different faults. Figure 2a illustrates the
corresponding bar plot of FSM. For better interpretation, the SIs in each row are sorted in a descend
8. Sensors 2014, 14 20327
order as shown in Figure 2b. By using such a representation, one can comprehensively discover the
relevance between IMFs and bearing fault signature, from high to low.
Figure 2. The bar plot of FSM: (a) before sorting; (b) after sorting.
(a) (b)
Step 4. Identify the Fault Type of Bearing
From the above property of FSM, it is rational to conclude that the existence and the severity of
bearing faults could also be determined if an appropriate threshold alarm is imposed on each FSM row.
In practice, how to select the threshold value is an important issue. A small threshold may lead to false
alarms, while a big threshold may lead to missing alarms. In this paper, the threshold value used is 4. It
was determined based on the consideration that, for a non-fault bearing signal, the vibration waveform
is generally dominated by Gaussian distributed white noise whose spectrum is almost flat in the
frequency domain, hence the risk that a spectrum line exceeding four times the mean energy of its
neighborhood is rather small. However, when a fault occurs the amplitude of BCF increases
dramatically and can easily reach this threshold according to our experimental and in-suit bearing
signal analysis. By impose the above threshold to each row of FSM, the health condition of bearing
can be identified. The merit of this diagnostic scheme is that it not only applies to single fault, but also
suitable for multi-fault cases.
4. Simulation Analysis
Generally, the vibration signal of a faulty rolling element bearing is mainly composed of three parts
as given in Equation (7) [28]. The first part represents a series of impulses excited by defect, where Ai
is the amplitude of the ith impulse, Ti is the time of its occurrence. The second part denotes the
vibration harmonics caused by bearing imbalance or gear meshing. In this term, Bn and βn are the
amplitude and initial phase of the nth harmonic, f(t) is the instantaneous rotating frequency of bearing
shaft. The third part n(t) stands for the white noise in the measurement:
( )
( ) ( ) cos 2 ( ) ( )
i i n n
i n
x t As t T B nf t n t
π β
= − + + +
(7)
1 2 3 4 5 6
0
4
8
Inner
1 2 3 4 5 6
0
4
8
Outer
1 2 3 4 5 6
0
4
8
Ball
IMF number
1 5 4 3 2 6
0
4
8
Inner
2 3 5 1 4 6
0
4
8
Outer
1 3 5 2 4 6
0
4
8
Ball
IMF number
9. Sensors 2014, 14 20328
In this simulation, a bearing with fixed outer-race and rotating inner-race is investigated. It’s
assumed that a local defect occurs on outer-race, whose characteristic frequency (i.e., BPFO) is 6 times
the rotating frequency of shaft. The fault excited bearing vibration is simulated by an exponentially
decaying sinusoid with the following form:
( ) sin(2 )
t
r
s t e f t
α
π
−
= (8)
where fr is the resonance frequency of the bearing system, which takes a values of 2000 Hz here, α is
the damping ratio of the impulse, which takes 500 Hz here. The gear vibration is simulated as the 16th
rotating harmonic of shaft, and its amplitude and phase are B16 = 0.4, β16 = π/6, respectively. The
sampling frequency and time length are specified as 20,000 Hz and 1 s.
4.1. Application to Bearing Diagnosis with Varying Speed and Random Impulsive Noise
Bearings served in the industrial field usually suffer harsh working conditions. In order to establish
a more realistic model, two frequently encountered scenarios are taken into account in this simulation,
i.e., time-varying rotating speed and random impulsive noise. To investigate the influence of speed
variation on the performance of proposed method, a non-linear run up process is simulated by
Equation (9), the speed curve of which is given in Figure 3:
( ) [200 200 sin(2 0.2 )]/ 60
f t t
π
= + ⋅ ⋅ ⋅ (9)
Figure 3. The speed curve of a bearing.
Figure 4. The simulated bearing vibration signal: (a) fault impulses p(t); (b) gear vibration
g(t); (c) extraneous interferences e(t); (d) noisy compound signal x(t).
(a)
0 0.2 0.4 0.6 0.8 1
200
250
300
350
400
Time [s]
Speed
[rpm]
0 0.1 0.2 0.3 0.4 0.5 0.6 0.7 0.8 0.9 1
-1
0
1
Amplitude
10. Sensors 2014, 14 20329
Figure 4. Cont.
(b)
(c)
(d)
Figure 4a,b show the simulated fault impulses p(t) and gear mesh vibration g(t), respectively. It is
noted that the impulses are not equally spaced in the time domain due to speed variation, and the gear
mesh period becomes shorter as the rotation speed increases. To simulate the extraneous interferences
encountered in real-case applications, several random amplitude and short duration bursts, e(t), with
center frequency of 6000 Hz are generated and plotted in Figure 4c. By adding Gaussian distributed
white noise, a noisy compound signal x(t) with SNR of −3 dB is finally obtained as illustrated in Figure 4d.
From this figure, the impulses generated by fault can hardly be observed due to the heavy noise.
In order to extract the fault feature, a SK analysis method based on fast-kurtogram [6] is applied to
the simulation signal. This signal is decomposed into six frequency levels, with a 1/3-binary tree
structure. The corresponding kurtogram is presented in Figure 5, from which a kurtosis dominant
frequency-band with centre frequency of 6041.7 Hz and bandwidth of 416.7 Hz is clearly identified.
With this information, an optimal band-pass filter is further designed to extract the impulses from the
raw signal. Figure 6 illustrates the filtered signal. However, it is surprising to observe that the extracted
signals actually come from the interference as illustrated in Figure 4c, rather than the fault-induced
impulses as we expected. The reason for this failure diagnosis lies in the fact that the conventional SK
0 0.1 0.2 0.3 0.4 0.5 0.6 0.7 0.8 0.9 1
-0.5
0
0.5
Amplitude
0 0.1 0.2 0.3 0.4 0.5 0.6 0.7 0.8 0.9 1
-4
-2
0
2
4
Amplitude
0 0.1 0.2 0.3 0.4 0.5 0.6 0.7 0.8 0.9 1
-4
-2
0
2
4
Amplitude
Time [s]
11. Sensors 2014, 14 20330
assumes that the frequency band with the largest kurtosis value is the frequency region where the fault
impulses lie. Obviously, this assumption does not hold in the situations where strong non-Gaussian
interferences exist. In fact, kurtosis is only a measure of the peakiness of a signal, but without any
source identification. The more sparse distribution and sharper peaks a signal contains, the larger
kurtosis value it has. Taking this simulation for instance, due to sporadic distribution and short
duration, the kurtosis value of interference e(t) can reach up to 251, while the kurtosis value of the
fault signal p(t) is only 25. It explains why the fault impulses are ignored when SK is applied to the
simulated signal.
Figure 5. Kurtogram of simulated out-race fault signal.
Figure 6. The band-pass filtered signal.
On the other hand, to demonstrate the effectiveness of proposed method, the IMF-AEOA is applied
to the same signal by the following procedures. Firstly, the raw signal is decomposed into IMFs by
EEMD. For conciseness, only several representative IMFs out of 11 IMFs are presented in Figure 7. It
can be seen from this figure that the EEMD provides a natural and adaptive decomposition of the raw
signal. The signal components with different oscillation characteristics are decomposed into different
IMFs. For instance, the strong interferences become visible in IMF1, the fault-induced impulses, to
some extent, can be observed in IMF2, while the rotating harmonics of bearing are mainly located in
Frequency [Hz]
Level
k
0 2000 4000 6000 8000 10000
0
1
1.6
2
2.6
3
3.6
4
4.6
5
5.6
6
0
5
10
15
20
25
0 0.1 0.2 0.3 0.4 0.5 0.6 0.7 0.8 0.9 1
-2
-1
0
1
2
Time [s]
Amplitude
12. Sensors 2014, 14 20331
higher order IMFs with relatively low oscillation frequency, e.g., the IMF7. However, due to the heavy
noise and time-varying signal structure, it is still impossible to determine the fault type by measuring
the time-interval between two successive impulses in time domain, which is frequently employed in
literatures. For this reason, more effective post-processing techniques are required.
Figure 7. Several representative IMFs obtained by EEMD.
As we know, envelope spectral analysis is only applicable to the diagnosis of bearings working
under stationary conditions. When ESA is applied to the bearing vibration signal or its IMFs under
varying speed, a smearing phenomenon will occur as shown in Figure 8a, from which the BPFO
cannot be identified in any IMF due to this smearing. To overcome this issue, envelope order analysis
is utilized to process the IMFs in the proposed method. Since the envelope signal is resampled with
equal increments in the angular domain, the frequency modulation effect caused by speed variation is
removed effectively. For comparison, the envelope order spectrum (EOS) of each IMF is shown in
Figure 8b. From the EOS of the IMF2, it is observed that the BPFO and harmonics of real fault are
enhanced in the order domain due to its angular cyclostationary characteristics. At the same time, since
strong interferences are randomly distributed in the vibration signal, their influence on the bearing
diagnosis is eliminated completely in the EOS.
Although the fault type of bearings can be identified by visual inspection of BCFs in each EOS,
such a diagnostic manner is inconvenient and time consuming. Moreover, for a data-driven signal
decomposition approach, it is also desirable to establish a quantitative assessment of how much
diagnostic information one IMF has. For the above purposes, the SI of each IMF to different type of
fault is calculated according to Section 3. Figure 9 shows the FSM of the simulated signal. It is noted
0 0.1 0.2 0.3 0.4 0.5 0.6 0.7 0.8 0.9 1
-4
0
4
IMF
1
0 0.1 0.2 0.3 0.4 0.5 0.6 0.7 0.8 0.9 1
-2
0
2
IMF
2
0 0.1 0.2 0.3 0.4 0.5 0.6 0.7 0.8 0.9 1
-1
0
1
IMF
3
0 0.1 0.2 0.3 0.4 0.5 0.6 0.7 0.8 0.9 1
-0.5
0
0.5
IMF
7
Time [s]
13. Sensors 2014, 14 20332
that the IMF2 is most sensitive to outer-race faults, and the corresponding SI is far above the threshold
line. This signature clear indicates that an outer-race fault has occurs. On the other hand, since the SIs
corresponding to inner-race and ball faults are all below the threshold line, so one can conclude that
the inner-race and rolling elements are in a healthy state.
Figure 8. Comparison between (a) envelope spectrum and (b) envelope order spectrum
for IMFs.
(a) (b)
Figure 9. FSM of the simulated signal.
0 50 100 150 200
0
0.02
0.04
IMF
1
0 50 100 150 200
0
0.02
0.04
IMF
2
0 50 100 150 200
0
0.01
0.02
IMF
3
0 50 100 150 200
0
0.01
0.02
IMF
4
Frequency [Hz]
BPFO
0 6 12 18 24
0
0.04
0.08
IMF
1
0 6 12 18 24
0
0.04
0.08
IMF
2
0 6 12 18 24
0
0.04
0.08
IMF
3
0 6 12 18 24
0
0.04
0.08
IMF
4
Frequency [Order]
BPFO
Noise level
2 3 6 4 1 7 5 8 9 10 11
0
4
8
Outer
g
7 4 1 5 8 3 2 11 10 6 9
0
4
8
Inner
6 7 1 2 3 9 8 5 4 11 10
0
4
8
Ball
IMF number
14. Sensors 2014, 14 20333
4.2. Case 2: Application in Multi-Fault Detection of Bearings
Once a bearing defect occurs, the local stress increases significantly as the rolling element passed by.
As a consequence, a single bearing fault will develop into a multi-fault in a very short time due to high
stress. Another advantage of the proposed method is its ability for multi-fault detection. To
demonstrate this, an inner-race fault signal is generated as shown in Figure 10a. Different from an
outer-race fault, the energy of measured vibration signal of an inner-race fault is influenced by the load
zone and time-varying transmission path. In this work, those effects are simulated by imposing an
amplitude modulation function a(t) to the impulse train, which is given by:
(10)
where θ(t) denotes the instantaneous angular position of the inner-race fault on the bearing. Since
different faults may excite different frequency bands of the system, the resonance frequency of an
inner-race fault is specified as 6000 Hz in this simulation. Figure 10b illustrates the final compound
signal, which is generated by adding the inner-race fault to the previous signal x(t) as given in Figure 4d.
By applying SK to the simulated signal, a frequency band with a center frequency of 5937.5 Hz and
bandwidth of 625 Hz is identified in the kurtogram as presented in Figure 11. Figure 12a shows the
band-pass filtered signal, from which the impulses induced by the inner-race fault can be identified.
Figure 12b shows the envelope order spectrum of the filtered signal, from which one can only identify
the BPFI, while leaving the outer-race fault undetected. This drawback is due to the fact that the
conventional SK only focuses on the sole frequency-band with the largest kurtosis value. Therefore, in
the case of multi-faults, the bearing defects with relative smaller kurtosis value may be ignored.
Figure 10. (a) Simulated inner-race fault signal; (b) compound signal.
(a)
(b)
( )
( ) 1 cos ( ) / 2
a t t
θ
= −
0 0.1 0.2 0.3 0.4 0.5 0.6 0.7 0.8 0.9 1
-4
-2
0
2
4
Amplitude
0 0.1 0.2 0.3 0.4 0.5 0.6 0.7 0.8 0.9 1
-4
-2
0
2
4
Amplitude
Time [s]
15. Sensors 2014, 14 20334
Figure 11. Kurtogram of simulated multi-fault signal.
Figure12. (a) Waveform and (b) envelope order spectrum of band-pass filtered signal.
(a)
(b)
In contrast, since all the decomposed frequency bands are equally treated before envelope order
analysis, the limitation mentioned above can be overcome effectively in the proposed method.
Figure 13 presents the FSM of the simulated signal, from which the inner-race fault and outer-race
faults can be identified clearly. Moreover, it is interesting to find in FSM that the IMF2 is most
sensitive one to the outer-race fault, while IMF1 is the most sensitive one to the inner-race fault. To
further validate the effectiveness of FSM, the waveforms and EOS of the first four IMFs are plotted in
Figure 14a,b, respectively. It is obvious that the BPFI and its modulation sidebands are clearly
revealed in the EOS of IMF1. Similarly, the diagnostic information of outer race fault mainly resides
in the IMF2.
Frequency [Hz]
Level
k
0 2000 4000 6000 8000 10000
0
1
1.6
2
2.6
3
3.6
4
4.6
5
5.6
6
1
2
3
4
5
6
7
8
9
0 0.1 0.2 0.3 0.4 0.5 0.6 0.7 0.8 0.9 1
-4
-2
0
2
4
Time [s]
Amplitude
0 4 8 12 16 20
0
0.1
0.2
0.3
0.4
BPFI
BPFO
16. Sensors 2014, 14 20335
Figure13. FSM of simulated multi-fault signal.
Figure 14. (a) Waveforms and (b) envelope order spectrums of the first 4 IMF components.
(a) (b)
5. Application to Fault Diagnosis of Locomotive Bearings
To validate its effectiveness, the proposed method is applied to the fault detection of locomotive
bearings in this section. The locomotive bearing test bench and its schematic are presented in
Figure 15a,b, respectively. The outer-race of the bearing is driven by a nylon driving wheel connected
to a hydraulic motor, while the inner-race is fixed during the test. Although the nominal rotation speed
of the driving motor is 400 rpm. Its actual speed can hardly be kept constant due to oil pressure
fluctuation. According to the geometric parameters of the bearing listed in Table 1, the nominal BCFs
are calculated and given in Table 2. It is important to note that the BCFs are time-varying in the test
2 3 5 4 9 6 8 7 1 11 10
0
4
8
Outer
g
1 2 6 5 4 8 7 3 11 9 10
0
4
8
Inner
1 4 6 3 7 2 5 9 8 10 11
0
4
8
Ball
IMF number
0 0.2 0.4 0.6 0.8 1
-3
0
3
IMF
1
0 0.2 0.4 0.6 0.8 1
-2
0
2
IMF
2
0 0.2 0.4 0.6 0.8 1
-1
0
1
IMF
3
0 0.2 0.4 0.6 0.8 1
-0.5
0
0.5
IMF
4
Time [s]
0 5 10 15 20
0
0.1
0.2
IMF
1
0 5 10 15 20
0
0.03
0.06
IMF
2
0 5 10 15 20
0
0.02
0.04
IMF
3
0 5 10 15 20
0
0.01
0.02
IMF
4
Frequency [Order]
BPFI
BPFO
17. Sensors 2014, 14 20336
since the bearings are not operating at a constant speed. To overcome this, those BCFs are normalized
by the rotating frequency of outer race (in terms of order) and listed in Table 2.
Figure 15. (a) The locomotive bearing test bench; (b) its schematic view.
Driving wheel
Hydraulic
motor
Bearing
Loading
wheel
(a)
(b)
Table 1. Geometric parameters of the roller bearing.
Pitch Diameter
(mm)
Roller Diameter
(mm)
Contact Angle
(degree)
Number of
Rollers
180 23.775 9 20
Table 2. BCFs of the bearing.
Items BCFs in Hz BCFs in Order
BPFO 57.97 8.695
BPFI 75.37 11.305
BSF 24.81 3.721
A tri-axial accelerometer is mounted on the shaft end to collect the bearing vibration signals. The
vibration signals are acquired for 2 s at a sampling rate of 76,800 Hz. Since the vibration in the vertical
direction is constrained by the loading wheel, its amplitude is not as large as that in the horizontal.
Therefore, the vibration signals in the horizontal direction are more informative and selected for
further processing. In this experiment, the locomotive bearings are tested blindly and we don’t know
their fault types in advance. Figure 16a shows the waveform of a bearing vibration signal, from which
18. Sensors 2014, 14 20337
no distinct impulses can be detected. To identify the bearing’s health state, the SK-based method and
IMF-AEOA are applied to the vibration signal, respectively.
Figure 16. (a) Waveform and (b) kurtogram of the bearing signal.
(a) (b)
Figure 16b illustrates the kurtogram of the raw signal, from which the ‘optimal’ demodulation
frequency-band can be obtained as 32,400~33,000 Hz. Based on this information, the raw signal is
band-pass filtered and the resultant waveform is presented in Figure 17a. It is noted that several high
amplitude impulses with random time distribution are extracted from the filtered signal. However,
those components come from the rubbing between the drive system and the chassis, rather than real
faults. Therefore, when envelope analysis is applied to the filtered signal, no BCF can be detected in
the envelope spectrum as given in Figure 17b. Therefore, the diagnostic result of SK-based approach is
that the bearing is in a healthy state.
Figure 17. (a) Waveforms and (b) envelope spectrum of the band-pass filtered signal.
(a) (b)
For comparison, the IMF-AEOA is performed on the same signal, and the FSM of the bearing
vibration is illustrated in Figure 18. From this figure, it can be concluded that a defect may occur in the
outer-race of the bearing. In addition, the FSM also reveals that the IMF2 is most sensitive to the
0 0.5 1 1.5 2
-2
-1.5
-1
-0.5
0
0.5
1
1.5
2
Time [s]
Amplitude
[g]
Frequency [Hz]
Level
k 0 1 2 3
x 10
4
0
1
1.6
2
2.6
3
3.6
4
4.6
5
5.6
6
5
10
15
20
25
30
35
40
0 0.5 1 1.5 2
-0.01
-0.005
0
0.005
0.01
Time [s]
Amplitude
[g]
0 50 100 150 200
0
0.2
0.4
0.6
0.8
1
x 10
-4
Frequency [Hz]
Amplitude
[g]
BPFO
19. Sensors 2014, 14 20338
outer-race fault. According to this, the waveforms of IMF2 are selected and presented in Figure 19a. It
is found that the some sharp impulses caused by an outer-race fault become visible in the figure. By
EOS, a dominant line locating at BPFO is recovered as shown in Figure 19b, which provides a clear
evident for the outer-race fault.
Figure 18. FSM of locomotive bearing signal.
Figure 19. (a) Waveform and (b) envelope order spectrum of IMF2.
(a) (b)
Figure 20. Outer-race of the dismantled bearing.
2 1 3 5 8 6 7 4 12 9 10 11 13
0
4
8
Outer
6 5 2 1 4 3 9 8 10 13 11 7 12
0
4
8
Inner
5 4 6 1 7 8 3 2 11 10 9 12 13
0
4
8
Ball
IMF number
0 0.5 1 1.5 2
-1
-0.5
0
0.5
1
Time [s]
Amplitude
[g]
0 5 10 15 20 25 30
0
0.008
0.016
0.024
0.032
Frequency [Order]
Amplitude
[g]
Noise level
BPFO
20. Sensors 2014, 14 20339
To validate the effectiveness of IMF-AEOA, the locomotive bearing is dismantled, and a picture of
its outer-race is shown in Figure 20. From this figure, the spall fault in the outer-race can be
seen obviously.
Besides external interference, the speed variation is also an obstacle that affects the diagnostic
accuracy of locomotive bearings. For demonstration, Figures 21 and 22 illustrate the diagnosis of
another locomotive bearing with an unknown fault based on the SK approach. As mentioned above,
since the rotation speed of driving wheel (as well as the outer-race) cannot keep constant in the test, the
smearing problem occurs in the envelope spectrum as shown in Figure 22b. From this figure none of
the fault features can be identified.
Figure 21. (a) Waveform and (b) kurtogram of the bearing signal.
(a) (b)
Figure 22. (a) Waveforms and (b) envelope spectrum of the band-pass filtered signal.
(a) (b)
In the proposed method, the envelope of each IMF is resampled from the time domain to the angular
domain, hence the influence of speed variation can be effectively removed. Figures 23 and 24 give the
FSM and the most sensitive IMF component. By inspecting Figure 24b, one can conclude that the
smearing problem is addressed in the EOS of IMF1, and the inner-race fault is extracted and identified
0 0.5 1 1.5 2
-1
-0.5
0
0.5
1
Time [s]
Amplitude
[g]
Frequency [Hz]
Level
k
0 1 2 3
x 10
4
0
1
1.6
2
2.6
3
3.6
4
4.6
5
5.6
6
0
20
40
60
80
100
0 0.5 1 1.5 2
-0.1
-0.05
0
0.05
0.1
Time [s]
Amplitude
[g]
0 50 100 150 200
0
2
4
6
8
x 10
-4
Frequency [Hz]
Amplitude
[g]
BPFI
21. Sensors 2014, 14 20340
even under non-stationary working conditions. Figure 25 shows the defect in the inner-race
of the bearing.
Figure 23. FSM of locomotive bearing signal.
Figure 24. (a) Waveform and (b) envelope order spectrum of IMF1.
(a) (b)
Figure 25. Inner-race of the dismantled bearing.
Some experimental investigations are also carried out to highlight the advantage of the proposed
method in multi-fault detection. For instance, Figures 26 and 27 present the diagnostic procedure of a
locomotive bearing using the SK approach. From the envelope spectrum shown in Figure 27b, one can
5 1 6 3 8 7 4 2 9 13 10 12 14 11
0
4
8
Outer
1 2 3 5 7 6 8 9 4 12 10 13 14 11
0
4
8
12
Inner
6 1 4 5 8 3 9 7 2 13 10 14 12 11
0
4
8
Ball
IMF number
0 0.5 1 1.5 2
-0.6
-0.3
0
0.3
0.6
Amplitude
[g]
Time [s]
0 5 10 15 20 25 30
0
0.004
0.008
0.012
BPFI
Noise level
22. Sensors 2014, 14 20341
observe the BPFI and its harmonics, and no other BCFs can be identified, so this signature indicates
that a defect may occur in the inner-race.
Figure 26. (a) Waveform and (b) kurtogram of the bearing signal.
(a) (b)
Figure 27. (a) Waveforms and (b) envelope spectrum of the band-pass filtered signal.
(a) (b)
Figure 28. FSM of locomotive bearing signal.
0 0.5 1 1.5 2
-4
-3
-2
-1
0
1
2
3
Time [s]
Amplitude
[g]
Frequency [Hz]
Level
k
0 1 2 3
x 10
4
0
1
1.6
2
2.6
3
3.6
4
4.6
5
5.6
6
10
20
30
40
50
60
70
0 0.5 1 1.5 2
-0.04
-0.02
0
0.02
0.04
Time [s]
Amplitude
[g]
0 50 100 150 200
0
1
2
3
4
5
6
x 10
-4
Frequency [Hz]
Amplitude
[g]
BPFI
2*BPFI
5 8 4 3 6 9 1 11 12 10 2 7
0
4
8
Outer
1 2 3 5 8 4 7 9 11 12 10 6
0
10
20
Inner
6 4 7 1 8 9 5 2 3 10 12 11
0
4
8
Ball
IMF number
23. Sensors 2014, 14 20342
Figure 29. (a) Waveform and (b) envelope order spectrum of IMF1.
(a) (b)
Figure 30. (a) Waveform and (b) envelope order spectrum of IMF6.
(a) (b)
Figure 31. Inner-race and roller of the dismantled bearing.
(a) (b)
For comparison, the same vibration signal is processed by the proposed method, which is illustrated
in Figures 28–30. However, the FSM gives a different diagnostic conclusion, i.e., both inner-race and
ball faults occur in the bearing. It also reveals that the fault signatures of the inner-race and ball fault
are contained in IMF1 and IMF6, respectively. To further validate its effectiveness, the locomotive bearing
is disassembled. As expected, both inner-race and roller faults were found, as shown in Figure 31.
0 0.5 1 1.5 2
-0.4
-0.2
0
0.2
0.4
Time [s]
Amplitude
[g]
0 5 10 15 20 25 30
0
0.01
0.02
0.03
Frequency [Order]
Amplitude
[g]
BPFI
2*BPFI
0 0.5 1 1.5 2
-0.4
-0.2
0
0.2
0.4
0.6
Time [s]
Amplitude
[g]
0 5 10 15 20 25 30
0
0.01
0.02
0.03
0.04
0.05
Frequency [Order]
Amplitude
[g]
BSF
24. Sensors 2014, 14 20343
6. Conclusions
The vibration signals of rolling element bearings used in the industrial field usually suffer from
multiple vibration sources, low signal to noise ratios and time-varying statistical parameters, which
cause difficulties in current diagnostic approaches. To establish a more reliable diagnostic method for
bearings under such harsh working conditions, an IMF-based adaptive envelope order analysis
technique is proposed in this paper. Some conclusions can be drawn as follows:
EEMD is an effective signal processing tool which could adaptively decompose the raw bearing
signal into IMFs with different frequency bands. By using EEMD, the fault signature will be enhanced
in certain IMF components. However, it is noted that the fault impulses can hardly be detected in IMF
components in the presence of heavy noise and random impulsive interferences. Moreover, due to
speed variation, those impulses are not equally spaced in time domain, which in turn leads to smearing
problems in the spectrum. To remove the spectral smearing effect caused by speed variation, the
envelope order analysis is further employed to transform the envelope of each IMF from the time
domain to the angular domain. In this procedure, the BCFs of real faults are enhanced in the envelope
order spectrum due to its angular cyclo-stationary characteristics, while strong interferences are
eliminated since they are randomly distributed in the vibration signal. To select the optimal IMF
containing the richest diagnostic information for decision making, a fault sensitive matrix is finally
established in this work, which overcomes the limitation of maximum kurtosis based methods. By
combining the advantages of EEMD, envelope order tracking and IMF sensitive analysis, both single
and multi-faults of bearing can be identified successfully even under varying speed operations and
strong interferences.
Acknowledgments
The work is supported by the National Natural Science Foundation of China (Grant No. 51405373,
51125022), and the Fundamental Research Funds for the Central Universities of China (Grant
No. CXTD2014001), which are highly appreciated by the authors.
Author Contributions
The key algorithm was established by Ming Zhao and Jing Lin. The data was analyzed by Ming Zhao
and Xiaoqiang Xu. The experiment was designed by Ming Zhao, Xiaoqiang Xu, Jing Lin and Xuejun Li.
The experiment was performed by Xiaoqiang Xu and Ming Zhao.
Conflicts of Interest
The authors declare no conflict of interest.
References
1. McFadden, P.D.; Smith, J.D. Model for the vibration produced by a single point defect in a rolling
element bearing. J. Sound Vib. 1984, 96, 69–82.
25. Sensors 2014, 14 20344
2. Qiu, H.; Lee, J.; Lin, J.; Yu, G. Robust performance degradation assessment methods for
enhanced rolling element bearing prognostics. Adv. Eng. Inf. 2003, 17, 127–140.
3. Darlow, M.S.; Badgley, R.H.; Hogg, G. Application of High Frequency Resonance Techniques for
Bearing Diagnostics in Helicopter Gearboxes; Technical Report; US Army Air Mobility
Research and Development Laboratory: Adelphi, MD, USA, 1974; pp. 74–77.
4. Antoni, J. The spectral kurtosis: A useful tool for characterising non-stationary signals. Mech.
Syst. Signal Process. 2006, 20, 282–307.
5. Antoni, J.; Randall, R.B. The spectral kurtosis: Application to the vibratory surveillance and
diagnostics of rotating machines. Mech. Syst. Signal Process. 2006, 20, 308–331.
6. Antoni, J. Fast computation of the kurtogram for the detection of transient faults. Mech. Syst.
Signal Process. 2007, 21, 108–124.
7. Lin, J.; Qu, L. Feature extraction based on Morlet wavelet and its application for mechanical
diagnosis. J. Sound Vib. 2000, 234, 135–148.
8. Qiu, H.; Lee, J.; Lin, J.; Yu, G. Wavelet filter-based weak signature detection method and its
application on rolling element bearing prognostics. J. Sound Vib. 2006, 289, 1066–1090.
9. Yu, D.; Cheng, J.; Yang, Y. Application of EMD method and Hilbert spectrum to the fault
diagnosis of roller bearings. Mech. Syst. Signal Process. 2005, 19, 259–270.
10. Lei, Y.; He, Z.; Zi, Y. EEMD method and WNN for fault diagnosis of locomotive roller bearings.
Expert Syst. Appl. 2011, 38, 7334–7341.
11. Antoni, J.; Bonnardot, F.; Raad, A.; El Badaoui, M. Cyclostationary modelling of rotating
machine vibration signals. Mech. Syst. Signal Process. 2004, 18, 1285–1314.
12. Borghesani, P.; Pennacchi, P.; Ricci, R.; Chatterton, S. Testing second order cyclostationarity in
the squared envelope spectrum of non-white vibration signals. Mech. Syst. Signal Process. 2013,
40, 38–55.
13. Girondin, V.; Pekpe, K.M.; Morel, H.; Cassar, J.-P. Bearings fault detection in helicopters using
frequency readjustment and cyclostationary analysis. Mech. Syst. Signal Process. 2013, 38,
499–514.
14. Leclère, Q.; Hamzaoui, N. Using the moving synchronous average to analyze fuzzy
cyclostationary signals. Mech. Syst. Signal Process. 2013, 44, 149–159.
15. Urbanek, J.; Barszcz, T.; Antoni, J. Time–frequency approach to extraction of selected
second-order cyclostationary vibration components for varying operational conditions. Measurement
2013, 46, 1454–1463.
16. Sawalhi, N.; Randall, R.B.; Endo, H. The enhancement of fault detection and diagnosis in rolling
element bearings using minimum entropy deconvolution combined with spectral kurtosis.
Mech. Syst. Signal Process. 2007, 21, 2616–2633.
17. Jiang, R.; Chen, J.; Dong, G.; Liu, T.; Xiao, W. The weak fault diagnosis and condition
monitoring of rolling element bearing using minimum entropy deconvolution and envelop
spectrum. Proc. Inst. Mech. Eng. Part C J. Mech. Eng. 2013, 227, 1116–1129.
18. Tan, J.; Chen, X.; Wang, J.; Chen, H.; Cao, H.; Zi, Y.; He, Z. Study of frequency-shifted and
re-scaling stochastic resonance and its application to fault diagnosis. Mech. Syst. Signal Process.
2009, 23, 811–822.
26. Sensors 2014, 14 20345
19. He, Q.; Wang, J.; Liu, Y.; Dai, D.; Kong, F. Multiscale noise tuning of stochastic resonance for
enhanced fault diagnosis in rotating machines. Mech. Syst. Signal Process. 2012, 28, 443–457.
20. He, Q.; Wang, J. Effects of multiscale noise tuning on stochastic resonance for weak signal
detection. Digit. Signal Process. 2012, 22, 614–621.
21. Lei, Y.; Han, D.; Lin, J.; He, Z. Planetary gearbox fault diagnosis using an adaptive stochastic
resonance method. Mech. Syst. Signal. Process. 2013, 38, 113–124.
22. Wang, Y.; Liang, M. An adaptive SK technique and its application for fault detection of rolling
element bearings. Mech. Syst. Signal Process. 2011, 25, 1750–1764.
23. Chen, B.; Zhang, Z.; Zi, Y.; He, Z.; Sun, C. Detecting of transient vibration signatures using an
improved fast spatial–spectral ensemble kurtosis kurtogram and its applications to mechanical
signature analysis of short duration data from rotating machinery. Mech. Syst. Signal Process.
2013, 40, 1–37.
24. Lei, Y.; Lin, J.; He, Z.; Zi, Y. Application of an improved kurtogram method for fault diagnosis of
rolling element bearings. Mech. Syst. Signal Process. 2011, 25, 1738–1749.
25. Barszcz, T.; JabŁoński, A. A novel method for the optimal band selection for vibration signal
demodulation and comparison with the Kurtogram. Mech. Syst. Signal Process. 2011, 25,
431–451.
26. Li, C.; Liang, M. Continuous-scale mathematical morphology-based optimal scale band
demodulation of impulsive feature for bearing defect diagnosis. J. Sound Vib. 2012, 331,
5864–5879.
27. Wang, D.; Tse, P.W.; Tsui, K.L. An enhanced Kurtogram method for fault diagnosis of rolling
element bearings. Mech. Syst. Signal Process. 2013, 35, 176–199.
28. Zhao, M.; Lin, J.; Xu, X.; Lei, Y. Tacholess envelope order analysis and its application to fault
detection of rolling element bearings with varying speeds. Sensors 2013, 13, 10856–10875.
29. Zimroz, R.; Bartelmus, W.; Barszcz, T.; Urbanek, J. Diagnostics of bearings in presence of strong
operating conditions non-stationarity—A procedure of load-dependent features processing with
application to wind turbine bearings. Mech. Syst. Signal Process. 2014, 46, 16–27.
30. Urbanek, J.; Barszcz, T.; Sawalhi, N.; Randall, R. Comparison of Amplitude-Based and
Phase-Based Methods for Speed Tracking in Application to Wind Turbines. Metrol. Meas. Syst.
2011, XIII, 295–304.
31. Randall, R.B.; Antoni, J. Rolling element bearing diagnostics—A tutorial. Mech. Syst. Signal
Process. 2011, 25, 485–520.
32. Borghesani, P.; Ricci, R.; Chatterton, S.; Pennacchi, P. A new procedure for using envelope
analysis for rolling element bearing diagnostics in variable operating conditions. Mech. Syst.
Signal Process. 2013, 38, 23–35.
33. Huang, N.E.; Shen, Z.; Long, S.R.; Wu, M.C.; Shih, H.H.; Zheng, Q.; Yen, N.-C.; Tung, C.C.;
Liu, H.H. The empirical mode decomposition and the Hilbert spectrum for nonlinear and
non-stationary time series analysis. Proc. R. Soc. Lond. Ser. A: Math. Phys. Eng. Sci. 1998, 454,
903–995.
34. Lei, Y.; Lin, J.; He, Z.; Zuo, M.J. A review on empirical mode decomposition in fault diagnosis of
rotating machinery. Mech. Syst. Signal Process. 2013, 35, 108–126.
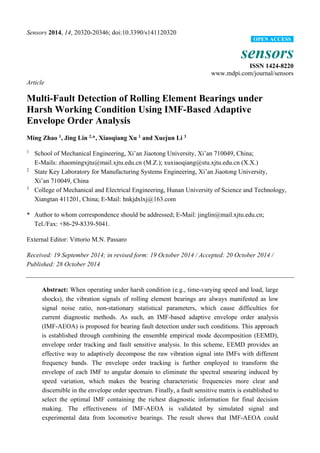
![Sensors 2014, 14 20321
accurately identify both single and multiple faults of bearing even under time-varying
rotating speed and large extraneous shocks.
Keywords: rolling element bearing; multi-fault diagnosis; time-varying rotating speed;
fault sensitive matrix
1. Introduction
Rolling element bearings are common and vital mechanical components that are widely used in
rotating machinery, and their malfunction may lead to uncomfortable vibration and noise, or even
breakdown of the entire production line. As a result, it is crucial to detect bearing faults before a
catastrophic failure occurs. A variety of monitoring and diagnostic techniques for rolling element
bearings have been developed in recent years. Among those, vibration analysis has been proven to be
the most fundamental and versatile one that plays an important role in bearing faults diagnosis.
When the rolling element passes through a faulty surface, a force impact is generated and this in
turn excites the resonance frequency of the bearing system [1,2]. As the bearing rotates, these impulses
will occur periodically with a frequency uniquely determined by the location of the defect. For this
reason, the detection of faults in bearings is commonly achieved by identifying the bearing
characteristic frequencies (BCFs), i.e., ball pass frequency of inner-race (BPFI), ball pass frequency of
outer-race (BPFO), or ball spin frequency (BSF). However, those impulses are very weak at the early
stage of faults and are usually overwhelmed by measurement noise and other vibration sources (such as
gear mesh and rotor unbalance), which causes difficulties for the early fault detection of bearings. For the
purpose of signal denoising and weak signature enhancement, a variety of signal processing techniques
have been proposed in recent years. They mainly include high frequency resonance technique (HFR) [3],
spectral kurtosis [4–6], wavelet analysis [7,8], empirical mode decomposition [9,10], cyclostationary
approach [11–15], minimum entropy deconvolution [16,17] and stochastic resonance [18–21] etc. Among
those, the HFR is the most widely used since it could extract the fault-related amplitude-modulation that
resides in a narrow band around the resonance and may minimize the effects of interfering signals in
lower frequency range. Nevertheless, the major challenge in the application of HFR lies in how to
choose the optimal frequency band for demodulation [22]. In early days, the demodulation frequency
band was selected either by trial and error, or by shock testing using a hammer, both of which are
rather inconvenient for practical applications. To address this issue, the spectral kurtosis (SK) method
was intensively investigated by Antoni and Randall [4,5]. It is shown that SK is an effective statistical
tool which can indicate not only transient components in the signal but also their locations in the
frequency domain, thus providing a guideline for the optimal demodulation bandwidth selection in the
envelope analysis. However, the original SK is time-consuming and not suitable for on-line fault
detection. To overcome this issue, a 1/3-binary tree fast kurtogram estimator was further proposed
Antoni, which made on-line condition monitoring a reality [6]. Since then, improvements of both SK
and the kurtogram have attracted increasingly attention of researchers [23]. By introducing Wavelet
Package Transform (WPT), Lei et al. [24] presented an improved kurtogram method which employs
WPT as the filter-bank to overcome the shortcomings of the original kurtogram. A novel tool called](data:image/gif;base64,R0lGODlhAQABAIAAAAAAAP///yH5BAEAAAAALAAAAAABAAEAAAIBRAA7)