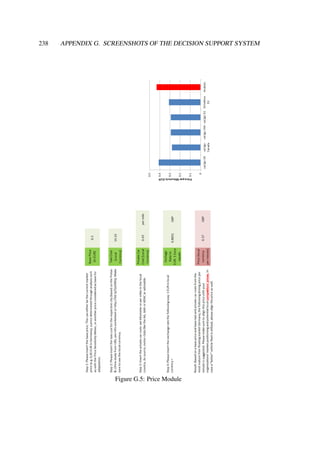
This dissertation develops a model-based framework and decision support system to help decision makers design free-floating carsharing systems for different cities. It identifies the key aspects that need local adaptation as the operating area, fleet size, charging concept, fleet mix, and price. Models are developed for each of these aspects based on factors like population density, housing costs, distance to city center, and availability of charging infrastructure. The models can be applied through the decision support system to plan free-floating carsharing systems tailored to individual cities. The framework was demonstrated in a case study planning a system for Chicago.


![6 CHAPTER 2. STATE OF THE ART
2.2 Context
The current mobility paradigm is challenged by major global developments and indus-
try has to react with innovations, particularly for individual transportation. Authors
define innovation as ”an idea, material, or artifact perceived to be new by the relevant
unit of adoption” [263] or ”not what innovators do but what customers adopt”. [200]
There are four major categories of innovations: incremental innovations, radical inno-
vations, new technological systems (systemic innovations), and new techno-economic
paradigms. [92, 175] New techno-economic paradigms represent changes in techno-
logical systems that are so far-reaching in their effects that they have a major influence
on the behavior of the entire economy. A variety of ecological, social, regulatory,
and technological drivers, [86, 90] and their effects potentially lead to a new mobility
paradigm.
First, ecological drivers are discussed briefly. Nowadays individual mobility is
greatly based on fossil fuels. Not only are gases emitted that are harmful to health
(nitrogen and sulfur oxide for example) but also CO2. The accumulation of carbon
dioxide together with other greenhouse gases like methane is strongly suspected to
be the main reason for the increase of the average global temperature within the last
50 years which has massive effects on the worlds’ ecosystem. [117] Therefore, the
United Nations demand from all parties involved to re-engineer the current techno-
economic paradigm and implement all necessary measures to reduce emissions as early
as possible. [125] Additionally, oil demand will increase and exceed production within
the next decades even though the exact year is hotly debated. Since the delivery rate of
crude oil cannot be increased significantly anymore and the gap between demand and
supply can only be closed by expensive and environmentally harmful non-conventional
oils and gases, most likely oil prices will increase in future. Together with the growing
dependency on oil suppliers and oil exporting countries, negative effects on economic
growth are expected [118] and mobility needs will be affected. [84]
Closely interlinked to these ecological drivers, social drivers play an important
role. One major trend in societal developments is the increasing urbanization. [84]
In 2009, for the first time more than 50% of the world’s population was living in
conurbations and this number might increase to 70% until 2050. [242] Increased traf-
fic density, local air pollution and the lack of parking facilities are growing problems
within this development. This goes along with changed customer requirements regard-
ing mobility, challenging the privately owned car more and more. A phenomenon that
exemplifies this is that young people show a decreasing interest in the automobile [82]](https://image.slidesharecdn.com/6e07fbad-1fc9-4865-930b-b3b2597817b7-150708184002-lva1-app6891/85/Seign_Dissertation-22-320.jpg)
![2.2. CONTEXT 7
and was first observed in the beginning of the 1990’s in Japan, being named Kuruma
Banare (”Demotorization”). Also in Germany the proportion of customers buying new
vehicles at the age between 18 and 29 years was reduced by 50% in 2009 compared
to 1999. [60] Next to ecological arguments, this can also be explained by an increas-
ing lack of interest due to changing values of this generation in developed countries.
Fast growing and affordable Internet-services replace the need to possess products like
cars. [184] Smartphones, for instance, are more important status symbols than cars for
many people. [13] Also, a general trend to ”collaborative consumption” [78] is ob-
served in many markets, including not only the sharing of cars but power tools, flats,
books, etc. [149] This is also referred to as ”shareconomy” and becomes increasingly
important to society and according to Weitzman, who established the term in 1984,
it increases wealth over all societal classes the more the market players share. [256]
Moreover, the purchasing power of young consumers will continue to decline in Eu-
rope, the U.S. and Japan over the next twenty years, leading this generation to buy even
fewer cars [253, 83] whilst mobility needs stay the same or even increase. Hence, mul-
timodality, which is the intelligent combination of different transport modes, is seen as
key trend [83] and future mobility needs will have to be addressed through innovative
solutions. [7, 88]
Next, regulatory drivers are discussed since governments react to the mentioned
issues in many respects on local (e.g. congestion charge in London), national (e.g.
bonus-malus system in France) and international level (e.g. EU CO2-reduction). [87]
Especially the reduction of CO2 is heavily enforced. Staying with the example of
the EU, it is sought to reduce greenhouse gas emissions until 2020 by at least 20%
compared to 1990. This also affects the limitation of passenger car emissions, which
account for 26% of the CO2 emitted within the EU. [36] As a result, a binding gradual
reduction of CO2 emissions until 2020 to in average 95g CO2/km for the fleets of
automobile manufacturers is decided whilst speculations reach to a restriction between
10g and 35g CO2/km by 2040. [8] In parallel, incentives are created for low-emission
technologies, accelerating the change of the mobility paradigm.
Last but not least also technological changes drive and enable a new mobility
paradigm. Advances in battery technology, fuel cell technology, infrastructure de-
velopments such as smart grid solutions to flexibly control electrical energy networks,
wireless internet, or IT solutions such as car-to-car or car-to-infrastructure communi-
cation enable new forms of mobility. This new mobility can be powered by different](https://image.slidesharecdn.com/6e07fbad-1fc9-4865-930b-b3b2597817b7-150708184002-lva1-app6891/85/Seign_Dissertation-23-320.jpg)
![8 CHAPTER 2. STATE OF THE ART
energy sources and it can have different, more intelligent, forms enabled by new tech-
nology, setting also new standards for the customer and the industry.
Taking all these drivers into account, a new mobility paradigm is expected to be
the result. It will be based on eco-friendly and efficient innovations in the field of in-
dividual mobility related with new, intelligent, not ownership-oriented but need-driven
solutions, known as mobility services. [191] Public transport is a part of this solution,
but even an excellent public transportation network cannot solve all mobility needs.
Bringing travelers not only approximately, but exactly to their desired destination, is a
problem that can hardly be solved economically. There are parameters which limit the
effectiveness of public transport, for instance service to remote areas, long distances,
the transport of handicapped persons, unpleasant weather, and the transport of heavy
or bulky objects. [153] Nevertheless, in the automotive industry it is expected that few
market players will be able to stay profitable with purely product-related revenues, or
in other words, by selling vehicles only. [7, 25]
2.3 Understanding Carsharing Systems
The emergence of a new mobility paradigm will require innovations for future individ-
ual mobility and alternatives have to be created, how automobiles will be constructed
and how mobility will be shaped in the future. Currently, electromobility and carshar-
ing are seen as likely future scenarios. [220, 89, 88]
Electric vehicles, or more specifically Battery Electric Vehicles (BEVs), enable
local emission-free mobility. Once renewable energy is used, also an overall energy
efficient and emission free mobility is possible on a well-to-wheel basis [87]. The
supply of renewable, emission-free, energy is dependent on regulatory factors that in-
fluence emissions trading. [167] If there are appropriate framework conditions, the
wide use of electric vehicles could provide enormous ecological and economic advan-
tages in the long term due to their energy-efficiency. Accordingly, governments cur-
rently promote electromobility by monetary and regulatory incentives, but their market
share is still fractional in most countries. This is because electric vehicles do not yet
have competitive Total-Cost-of-Ownership despite lower operating costs. [170] Next
to uncertainties in batteries’ lifetime, possibly influencing residual values negatively,
most vehicles only offer a range of about 100-300km with charging times of up to
8h, depending on the battery capacity and charging power. This becomes even more
disadvantageous as there is only very limited public charging infrastructure. Opposed](https://image.slidesharecdn.com/6e07fbad-1fc9-4865-930b-b3b2597817b7-150708184002-lva1-app6891/85/Seign_Dissertation-24-320.jpg)
![2.3. UNDERSTANDING CARSHARING SYSTEMS 9
to these realities, customers expect ranges of at least 400km, no comfort losses, and
are not willing to pay a price premium [128] and therefore sustainability and exciting
driving performance so far do not level out disadvantages for most customers.
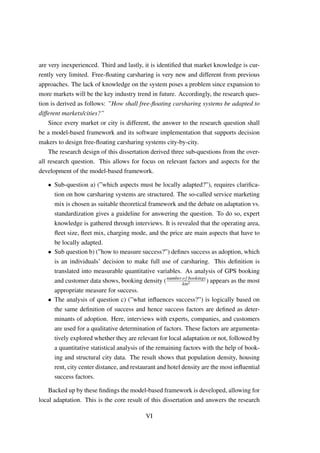
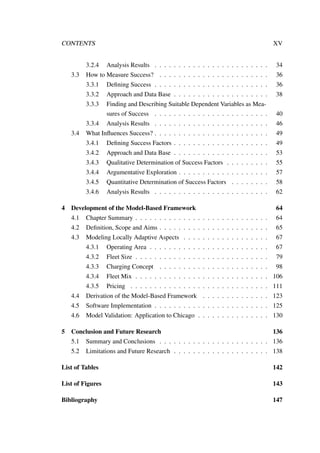
Another possible solution within a new mobility paradigm is carsharing. ”Carshar-
ing” means that a car is shared by customers in series (one user after another) rather
than in parallel which is known as car-pooling. [23] Figure 2.1 gives an overview on
forms and terms in non-ownership car usage forms. This work focuses on modern or-
ganized carsharing which is professionally organized by mobility providers, offering
different vehicles at different places to their customers. The first documented ”or-
ganized” carsharing started in Zurich, Switzerland, in 1948 and operated until 1998
and was known as Sefage (Selbstfahrergemeinschaft). The concept was furthermore
often tested but later discontinued in Europe and North America during the 1970’s,
80’s, and 90’s. [212, 151] The breakthrough however happened again in Switzerland
in 1987, followed by the first German carsharing operator one year later, Stattauto
Berlin. [168, 151] Today, the concept has expanded to approximately 1,100 cities, in 26
nations on five continents. [213] For example, there are approximately 228,000 (tradi-
tional) carsharing members in Germany and 100,000 in Switzerland. The concept also
manifested itself successfully in other countries like the UK (210,000 members) [94]
and the USA (711,290 members). [95] In its functionality, the carsharing concept is
intended to fill the mobility gap between public transport, taxis, bicycles, car rental
and private cars. [151] It offers the advantage and flexibility of a privately owned car,
but without the associated fixed costs and obligations. The permanent ownership is
replaced by occasional car usage in order to satisfy mobility needs, e.g. leisure time,
shopping, transports, etc. whilst the great majority of ways like going to and coming
from work will be traveled by public transport, bicycle, or by foot. [37, 66] This also
makes the model attractive to new customer groups.
Whilst the concrete figures of quantitative impacts vary significantly, the qualita-
tive advantages of the mobility concept for the public are agreed upon as follows and
approved through a vast amount of studies, e.g.: [160, 103, 142, 213, 151, 50]
• Less parking spaces or occupied areas are needed
• Parking search is simplified (mainly station-based carsharing) and traffic is min-
imized
• Younger automotive fleets with fewer emissions
• Vehicles are suited to the trip purpose (depending on vehicle availability)
• Reduction in private vehicle ownership](https://image.slidesharecdn.com/6e07fbad-1fc9-4865-930b-b3b2597817b7-150708184002-lva1-app6891/85/Seign_Dissertation-25-320.jpg)
![10 CHAPTER 2. STATE OF THE ART
informal formal
Serial
Sharing
Parallel
Sharing
GermanEnglish
GermanEnglish
GermanEnglish
GermanEnglish
Autoteilen im Haushalt, Autoausleihe
im Bekanntenkreis, vertragliches
Autoteilen (Nachbarschaftsauto,
peer-to-peer Carsharing, privates
Carsharing)
Organisiertes Carsharing,
Autovermietung, Taxi,
Coprporate Carsharing
Sharing a car in a household,
borrowing a car from friends,
Contractual car sharing
(Neighborhood Carsharing, peer-to-
peer Carsharing, private Carsharing)
Organized Carsharing (UK: Car
Clubs)
Car Rental, Taxi, Corporate
Carsharing
Mitfahrzentralen,
Mitfahrgelegenheiten,
Fahrgemeinschaften
Autostopp, Trampen
Car Pooling, Ride Sharing, Lift-
Sharing
Hitchhiking, Thumbing, Hitching
Figure 2.1: Forms and Terms of Car Usage without Ownership. Adapted from [23]
• Less passenger car use because of cost transparency and changed mobility be-
havior
• Improved connections to public transport by Park and Ride promotions as well
as intermodal mobility concepts (e.g. RegioMobilCard in Freiburg, Germany)
• Easier integration of initial expenses of alternative drives by spreading fixed
costs
• Possibility of decreased (CO2) emissions
Additionally, the customer can always have access to modern vehicles, has smaller
or no parking costs and might actually see time savings if there is a high penetration
of the service. [17] The stress level of the drivers is then reduced, which is particularly
high in large cities. [116] The result, reduced volume of traffic and costs, without nec-
essarily giving up automobile use makes private mobility simpler and mostly cheaper,
since it requires no capital investment by the user. As a consequence, it increases so-
cial equality because it offers access to a car to people who cannot afford to own one
and from a societal perspective, the spread of fixed costs frees up capital that could
be spent differently. Finally, carsharing models satisfy the social need for intensified
consideration of environmental aspects.
Carsharing with or without electromobility, can be realized in three different ways.
The first, traditional approach, works with stations (e.g. public or private parking lots),
at which the vehicles must be picked up and returned (A-to-A trips only). Sometimes,](https://image.slidesharecdn.com/6e07fbad-1fc9-4865-930b-b3b2597817b7-150708184002-lva1-app6891/85/Seign_Dissertation-26-320.jpg)
![2.3. UNDERSTANDING CARSHARING SYSTEMS 11
these stations are not single parking lots but little areas comprising a few streets and
examples for such systems are Zipcar and Flinkster.
Secondly, this approach can be extended as for example DriveNow in San Fran-
cisco or Autolib in Paris do. Here, stations are provided where vehicles can be picked
up and returned at a different station, enabling A-to-B trips. This theoretically promis-
ing concept requires high investment and a high critical mass of customers and vehi-
cles. In Paris, it is configured with 3,000 electric vehicles and 6,600 parking/charging
lots at 1,100 stations. [75] In the beginning, the provider did not estimate to be prof-
itable within seven years [9] and the first year even stayed below all expectations and
many problems came up. [10] A similar concept, Honda Diracc Car Sharing in Singa-
pore, also faced massive operational issues that lead to unsatisfied customers. In the
end, it was discontinued after six years of operation. [45]
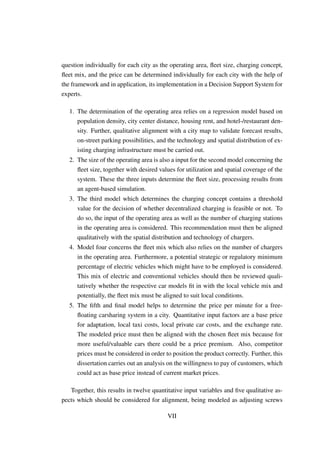
A third approach, which was selected by BMW’s DriveNow and Daimler’s car2go
for example, differs from earlier approaches in that the vehicles must be picked up and
returned, not at stations but in a defined business or operating area. One way trips are
possible since the vehicle can be parked at any legal parking space in this defined op-
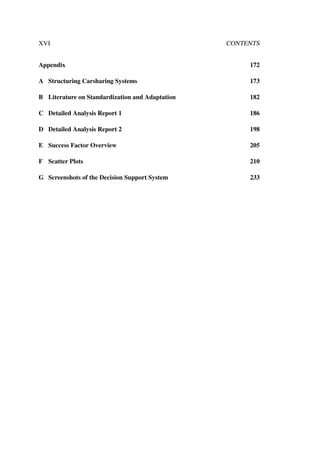
erating area; hence, this type of carsharing is called free-floating or flexible carsharing.
Figure 2.2 shows the operational principle of such a free-floating carsharing model.
Open & start
the car with
customer card
Park in
defined area
Register with
provider
Find & reserve
car
Gas, cleaning,
service, etc.
included
Drive & pay
per minute
Figure 2.2: Operational Principle of Modern Free-Floating Carsharing
This principle does not emphasize the sharing but the flexible use aspect – a con-
stantly available car fleet fulfilling mobility needs on demand. It intends to be function-
ally and emotionally equivalent or superior to car ownership and combines the greatest
possible customer benefits and flexibility with the smallest investment. Therefore, car
ownership can be transformed to car usage without sacrifice. On the downside, the
provider must overcome great challenges in making the process work and availability
cannot be guaranteed as easy as with reservations because its bookings are spatially
and temporally open-ended. [254, 20, 130]](https://image.slidesharecdn.com/6e07fbad-1fc9-4865-930b-b3b2597817b7-150708184002-lva1-app6891/85/Seign_Dissertation-27-320.jpg)
![12 CHAPTER 2. STATE OF THE ART
Furthermore, advantages of carsharing (like reduced car usage) are mostly only
proven for station-based systems and it is widely discussed whether and to which de-
gree the advantages apply to free-floating carsharing or not. [226, 20, 105] New studies
show however, that the advantages of station-based carsharing can be applied to free-
floating carsharing concepts as well [79, 80] whilst the quantitative extent is questioned
by some experts.
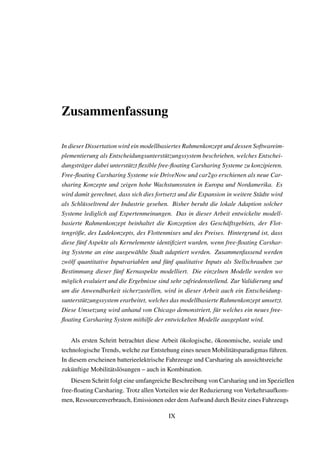
Nevertheless, at this time limited offers and little knowledge about the concept
prevent the innovation to be a mass phenomenon but growing rates are promising for
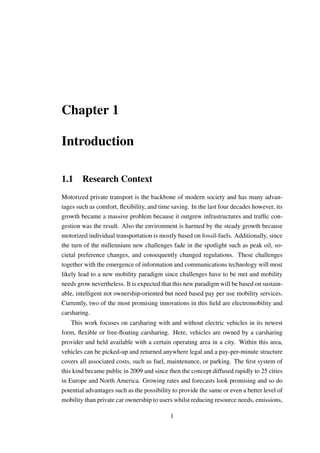
the early stage of the diffusion process of carsharing. For example, DriveNow, which
started in 2011, attracted in 1.5 years as many customers as all traditional station-based
carsharing operators together in 12 years after start of operation (see figure 2.3) whilst
car2go, which started as first free-floating offer in 2008, already outgrew traditional
carsharing.
0
100,000
200,000
300,000
400,000
500,000
600,000
700,000
800,000
1 2 3 4 5 6 7 8 9 10 11 12 13 14 15 16 17 18
Members
Years after Start of Operation
Station-based Car Sharing Germany
car2g (Europe and North America)
DriveNow
Flinkster
Figure 2.3: Members over Time - Comparing Free-Floating Offers (DriveNow and
car2go) with Station-Based Offers [27]
Consequently, free-floating carsharing represents the main focus and data base for
this research. To give an overview, figure 2.4 shows a map of cities in which free-
floating carsharing is currently offered (as of January 2014). Other variants such as
peer-to-peer carsharing or personal vehicle sharing, which provides a model to over-
come some of the financial constraints and geographic limitations of fleet ownership
and distribution in traditional carsharing, [214] are not considered for this research.
In a next step, combining carsharing with electric vehicles is examined briefly as](https://image.slidesharecdn.com/6e07fbad-1fc9-4865-930b-b3b2597817b7-150708184002-lva1-app6891/85/Seign_Dissertation-28-320.jpg)
![2.3. UNDERSTANDING CARSHARING SYSTEMS 13
Austin
Vancouver
San Diego
Washington
Portland
Seattle Toronto
Miami
Calgary
Denver
Minneapolis
Columbus
Montreal
Los Angeles
Birmingham
Ulm
Amsterdam
Vienna
Düsseldorf
Cologne
Berlin
Munich
Stuttgart
London
Milan
Florence
Rome
Copenhagen
Frankfurt
Hamburg
Figure 2.4: Map of Cities where Free-Floating Carsharing is Offered
they are both promising solutions for future mobility. In general, two or more innova-
tions are often packaged together to facilitate their diffusion because they have func-
tional or perceived interrelatedness. This is called a technology-cluster or innovation-
package [186] and mobility providers around the world prepare for this innovation-
package of technology- and service-innovation as they are mutually beneficial:
• BEVs suit carsharing purposes since the range is sufficient here.
• In a mixed carsharing fleet with conventional vehicles all use-cases can be cov-
ered, eliminating the need for a second car and thus limiting resource needs. [38]
• Currently high vehicle prices are spread among many users.
• Carsharing lowers barriers to try out BEVs [183] and might offer an alternative
to conventional selling or leasing of electric vehicles. [179]
• Carsharing increases the public awareness and acceptance of BEVs [135], acting
as catalyst for market diffusion.
• Massive investments in CO2 reduction [169] could be minimized through elec-
tric carsharing fleets.
• Carsharing might affect mobility culture and consequently contribute to a bigger
market potential for BEVs [194] as people become more aware when choosing
the mode of transportation.
• Since cities pursue the strategy to promote intelligent and intermodal mobility
services rather than just promoting a change of the drivetrain of cars [91]; in
future, governments might restrict carsharing to electric vehicles only.
• BEVs boost the sustainable image of carsharing systems. [38]](https://image.slidesharecdn.com/6e07fbad-1fc9-4865-930b-b3b2597817b7-150708184002-lva1-app6891/85/Seign_Dissertation-29-320.jpg)
![14 CHAPTER 2. STATE OF THE ART
• Being sustainable in all dimensions (3P - People, Planet and Profit) [71] trans-
lates to economic success [218, 230] and is considered to be a way for the auto-
motive industry to survive in the long run. [57, 181]
• Vehicle-to-Grid (V2G), where electric vehicles are employed as virtual power
storage station [124] could allow carsharing providers to generate revenue even
when the cars are not booked. [85, 122, 123]
• In future, operating costs might be lowered due to the lower price of electricity
compared to gas once a) vehicle costs are comparable and b) there is a sufficient
charging infrastructure since the parking spaces are an incentive for customers
to charge on their own, eliminating currently high handling costs.
Nevertheless and despite all the multifarious advantages of free-floating carsharing
with and without electric vehicles, there are still challenges that have to be addressed.
These are discussed in the following section.
2.4 Challenges for Free-Floating Carsharing Systems
2.4.1 Limited Profit Potentials
The first challenge carsharing faces is the currently limited profit potential. The world’s
biggest carsharing provider Zipcar for example was founded in the year 2000 but only
reached profitability in 2012 [265] which however can also be contributed to the vast
expansion strategy. The same appears true for the two existing free-floating providers.
According to the head of Daimler Mobility Services, car2go only operates profitably in
three of nineteen cities as of 2013. [110] The CEO of DriveNow made a similar state-
ment, indicating that only one of five cities is profitable. [158] As a consequence, as of
now the concept itself is jeopardized as it is not economically feasible or sustainable
for providers to offer an unprofitable product in the long-term.
The integration of electric vehicles into carsharing fleets potentially worsens the
situation and costs are seen as the key challenge for carsharing with electric vehi-
cles. [38] Vehicles must exhibit an acceptable level of Total-Cost-of-Ownership so that
providers can afford to infleet BEVs because customers are not willing to pay a price
premium for electromobility. [128] Studies show that current costs and structures limit
a profitable operation of electric carsharing vehicles. [68] Apart from vehicle costs,
charging electric cars is currently expensive since there is no sufficient charging in-
frastructure in most cities yet. Therefore, charging poses inconvenience and flexibility](https://image.slidesharecdn.com/6e07fbad-1fc9-4865-930b-b3b2597817b7-150708184002-lva1-app6891/85/Seign_Dissertation-30-320.jpg)
![2.4. CHALLENGES 15
losses for the customer and must be expensively incentivized or, alternatively, leads
to high operational costs for providers if the provider charges the vehicle itself. Ad-
ditionally, compared to conventional cars, charging needs to be performed more often
than refueling (2-3 times a week vs. 2 times per month), requires a new infrastructure,
and is time consuming (0.5-8h per charge). To encounter range anxiety, cars should be
relatively fully charged for every customer. This increases the charging frequency and
times which in turn limit availability and flexibility. As a consequence, bigger fleets
become necessary to ensure availability. This increases costs and so do the potential
need for a charging infrastructure if none exists.
2.4.2 Limited Diffusion of the Concept
Next to profitability as a prerequisite for the provision of offers, the subsequent diffu-
sion and acceptance of these innovative offers is crucial. According to Joseph Schum-
peter, the innovation process consists of three steps: (1) the invention or idea, (2)
the development of the invention into a marketable product, the innovation, and (3)
the diffusion process where products get spread through an economy, adopted, and
imitated. [201] People can be grouped in different adopter categories, which refers
to whether an adopter is relatively early or late in adopting innovations compared to
other system members. Similar adopters have a great deal in common when it comes
to socioeconomic status, media usage, and communication channels. These adopter
categories as well as a typical diffusion process are depicted in figure 2.5. Depending
on the innovation, the curve can be steep or more gradual. [186]
Whilst in the beginning of the 1990s, similarly to today, an enormous market po-
tential for carsharing was estimated, reality showed only a moderate diffusion of the
concept: growing rates were 12 to 30 times lower than expected. [151] Also today, to
many the idea of carsharing is still unknown and others are not convinced and skeptical.
A study in Germany showed that though 73% of respondents were aware of carshar-
ing offerings, 80% have never used it and only 6% would definitely be prepared to
use it. The majority remained undecided, waiting for a better price-performance ratio
and better service availability. [188] Similarly, another study showed that 76% of the
respondents were aware of carsharing but only 8% of this group dealt with it more
deeply and only 2% actually used it. Of those who used it, 84% stated that they could
imagine that this form of mobility could replace private vehicles whilst 61% of the to-
tal of respondents stated that carsharing is not attractive to them. [6, 12] This disparity
clearly shows that the diffusion of the concept is still in its infancy and opinions are](https://image.slidesharecdn.com/6e07fbad-1fc9-4865-930b-b3b2597817b7-150708184002-lva1-app6891/85/Seign_Dissertation-31-320.jpg)
![16 CHAPTER 2. STATE OF THE ART
Figure 2.5: The Diffusion of Innovations. The Number of Adopters Depicted in a
Frequency Histogram Follows a Bell-Shaped Gaussian-Curve (Dark-Blue). When
Cumulating this, the Number of Adopters over Time (the Rate of Adoption) Follows
an S-Curve (Brown). [186, 260]
blinded by prejudice rather than actual experiences.
Moreover, since free-floating carsharing only started in 2008 and achieved signif-
icant customer numbers and media coverage only by 2011/2012, most opinions are
still based on traditional station-based carsharing. Here it was found that diffusion is
hindered by missing flexibility and little compatibility to conventional vehicle usage
patterns. [151, 203, 224] A flexible system, such as the free-floating concept, should
thus not be hindered by these facts in its diffusion, which was also confirmed by a
study of Bongardt and Wilke, who concluded in 2008 that a more flexible and modern
approach ”seems to be a condition for diffusion in further milieus”. [32] Studies from
2012 assume 9 million carsharing members in North America and 15 million in Eu-
rope by 2020 with free-floating concepts as main drivers. [95, 94] Regardless of these
promising growing rates, carsharing is still a niche offering compared to around 240
million registered vehicles in Europe in 2010. [76]
Additionally, not only the service innovation carsharing but also the technology
innovation BEV is little known. This translates into a fear of novelty and reluctance
against the concept. For customers, next to a competitive price, one prerequisite is that
electric vehicles develop technological maturity and high reliability since customers do
not want to sacrifice convenience. [258] This is unarguably a crucial challenge since](https://image.slidesharecdn.com/6e07fbad-1fc9-4865-930b-b3b2597817b7-150708184002-lva1-app6891/85/Seign_Dissertation-32-320.jpg)
![2.4. CHALLENGES 17
several studies demonstrated that one’s perception of an innovation determines the rate
and likelihood of its adoption [174] or in other words ”not the technical change is rel-
evant, but the change of awareness”. [108] Nevertheless, studies show that a majority
would consider buying an electric vehicle once (subjective) expectations are met. [240]
Since the diffusion of free-floating carsharing is in the beginning stage, it is a niche
product in transportation. Forecasts are promising, but the diffusion process has to be
supported through market adequate offers to reach further market penetration so that
further adoption can become self-sustaining and the concept’s various advantages can
have a measurable impact in society. Moving from the early stage in the diffusion
process – with its own rules and specific customer groups – to the mass market is
also economically crucial for providers. This is the gap or ”chasm” that innovations
must cross to reach the lucrative mainstream market. Innovations that cannot cross this
chasm will die or remain niche. [157, 156]
2.4.3 Limited Market Knowledge
The previous sections revealed that in order to unlock the potential of the concept,
there must be sufficient offers that diffuse in the market because they meet customers’
demands. Thus, these offers will concentrate in areas where high demand is ex-
pected. [30] Generally speaking, the market potential depends on user characteristics,
framework conditions and the service quality of carsharing and the overall multimodal
portfolio in a market. Since free-floating carsharing is very young, operators currently
know little about the market and are exploring why their offerings work better in some
cities than in other ones but the experience base is limited. Moreover, expansion de-
cisions are often mainly based on the local political situation nowadays. Some cities
welcome carsharing providers with the possibility to park vehicles on-street, which is
key for a free-floating carsharing operation, whereas others do not allow that possi-
bility. Positive examples include Munich, which allows each free-floating carsharing
provider to purchase up to 500 city-wide parking licenses for 1,830 Euro per vehicle
every year. [120] Stuttgart and Austin are cities that even offer free parking, [166, 130]
and Amsterdam provides a charging infrastructure for E-carsharing. [109] The regula-
tory framework is therefore a key challenge that must be met with political dialogues in
the respective cities (for more detail, see [143]), bringing the advantages of carsharing
for society in attention of local decision makers.
Apart from the important regulatory factor, there are widespread opinions regard-
ing success factors for carsharing. Studies often focus on describing socioeconomic](https://image.slidesharecdn.com/6e07fbad-1fc9-4865-930b-b3b2597817b7-150708184002-lva1-app6891/85/Seign_Dissertation-33-320.jpg)
![18 CHAPTER 2. STATE OF THE ART
characteristics of customers to determine market potential. [225, 30, 161] The aver-
age age of mid 30s to mid 40s, incomes in the upper middle class, high education, a
predominantly male gender, a below average household size, and below average auto
ownership, are typical characteristics of carsharing members. Furthermore, potential
carsharing members live in urban areas, are concerned about environmental issues, and
are considered to be innovators to which status matters little. [151, 39] Here, forecast
customer numbers vary greatly and even a correct estimation of potential customers
does not necessarily lead to practical results as the decision to use carsharing depends
on many more factors that are not accounted for in sociodemographic analyses. [136]
Next to determining demographic markets, also geographic markets are studied.
Here studies vary greatly in results and the number of single households, a high qual-
ity of public transportation, little car ownership, and a high population density are often
found to be geographic success factors. Obviously, these factors are interrelated with
demographic characteristics of users that will be correlated with certain features of the
wider neighborhood. [151] With these results, also first attempts were made to assess
market potential for certain neighborhoods with the help of a geographic information
system (GIS). [49] This assessment however relies merely on location data for stations
and does not include booking behavior. This is crucial since offered cars might not
be used. An alternative carsharing demand model, based on usage data, revealed that
neither population density nor demographic factors play an overt role in the success
of carsharing stations. According to the data, rather the age of a carsharing station,
commuters that drive alone, street width, households with one vehicle and various
public transit variables played an important role. [227] Another approach to combine
findings from previous studies was chosen by the BeMobility project in Berlin, seeing
population density, car density, public transportation, charging infrastructure, parking
pressure, competition, living quality, and the mix of use in an area, as influences for de-
mand. [24] Unfortunately, it is not known how these factors were quantified, weighted,
and analyzed to determine areas of high carsharing demand.
Other efforts have been made in the direction to quantify the market potential
through activity-based microsimulation to predict carsharing usage while accounting
for individuals’ travel behavior, carsharing usage, and other forms of travel, [54]1
through a Monte Carlo simulation of the decision to own or share a vehicle, [202]
1This work was later extended to free-floating carsharing, simulating different demand scenarios
for Berlin. [55] However, the focus of this work lies on the simulation methodology and the potential
environmental effects of free-floating carsharing rather than on market assessment. Also, no empirical
data was incorporated.](https://image.slidesharecdn.com/6e07fbad-1fc9-4865-930b-b3b2597817b7-150708184002-lva1-app6891/85/Seign_Dissertation-34-320.jpg)
![2.4. CHALLENGES 19
or through stated preference surveys. [1, 264]
However, all the above approaches are based on station-based carsharing systems.
Transfer of knowledge to free-floating carsharing might not be possible since the scale
and operating mode is very different. [20] Furthermore, a comparison of booking data
of both concepts concluded that temporal and spatial booking behavior is very different
- most likely due to different trip purposes. [199] Especially for member prediction
approaches it must be noted, that free-floating carsharing is only in the beginning of its
diffusion and consequently, current customers are innovators and early adopters, which
characteristics are very different from later adopter groups that account for the vast
majority of the market. [186] This makes it very hard to estimate the ultimate market
size for this innovation. Moreover, if framework conditions are ideal (exclusive access
to cities, free-parking, etc.) and the quality of carsharing systems is superb (guaranteed
availability, low prices, attractive fleets, etc.), the theoretical market potential could
amount to 100%.
Besides this consideration, recent studies concerning the free-floating carsharing
market include a gaming simulation exercise and the interpolation of results to esti-
mate the overall potential of the concept for London. [136] Another study provided
three separate options for predicting membership in a carsharing program given city
demographics: (1) a binary logit model to identify whether a census block will have
members or not, followed by a linear regression model to estimate the percentage of
population that might become a member in blocks expected to contain members or
alternatively, (2) a logit model to estimate the membership percentage. Finally, (3) a
Heckman sample selection model was developed to jointly estimate blocks with mem-
bers and membership percentages in blocks with members, being the recommendation
of the author. [130] This approach was later modified by the author by replacing the
prediction of membership by a prediction of mode split and trip frequency. [129] How-
ever, coefficients of determination were relatively small and as the author points out,
predictions might not be transferable to other cities than Austin.
Apart from this latest developments in free-floating carsharing market demand
modeling, which have not been evaluated to the author’s knowledge, predominant
theoretical assumptions are disproved by reality. For example, Calgary (Canada), a
city with a population of about one million people, experienced a much more rapid
diffusion of car sharing than bigger cities where a bigger customer base and a big-
ger demand is suspected. [11] This limited knowledge poses a problem to providers](https://image.slidesharecdn.com/6e07fbad-1fc9-4865-930b-b3b2597817b7-150708184002-lva1-app6891/85/Seign_Dissertation-35-320.jpg)
![20 CHAPTER 2. STATE OF THE ART
when approaching new cities. Expansion, market development, and internationaliza-
tion are key trends in the carsharing industry. [213] The market choice is essential for
the chances of success as carsharing systems are embedded parts of local transportation
infrastructures and the place of offering is the place of consumption.
This general market knowledge gap also poses a problem when designing market
specific offers for determined new or even existing markets since local customer needs
must be fulfilled to suit the environment of the offer. Conditions vary from city to
city but it is not only the local authorities and given structural traits of a city that
foster carsharing. When implementing a free-floating carsharing system in a city, there
are many unknown variables a provider has to adjust in order to provide an appropriate
transportation system for the respective city. So far, decisions are based on assumptions
and expert knowledge, not on research-based models.
Lastly, providers have limited market knowledge and experience when it comes
to electric vehicles in free-floating carsharing systems and the question of how these
concepts must be offered to fulfill the local needs of a market must be answered.
2.5 Research Gap
This chapter so far revealed that free-floating carsharing appears as promising solution
within a new mobility paradigm; potentially offering many advantages to our society
once the concept achieves considerable market penetration. However, there is still a
number of challenges providers face in the form of limited profit potentials, limited
diffusion of the concept, and limited market knowledge. These challenges are highly
connected: For the diffusion of the concept a prerequisite it the availability of sufficient
offers, while companies only provide offers when there will be enough customers to
enable scale effects and hence profitability. The little market knowledge leads to bad
market development, negatively influencing profitability and leaving the customer un-
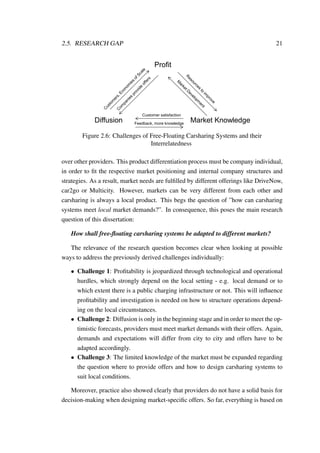
satisfied since companies do not know how and where to provide offers. In short, fig-
ure 2.6 provides an overview on the challenges and their interrelatedness, representing
a classic chicken and egg problem.
To solve this problem it can be argued whether to focus on all sides of the equation
simultaneously or to focus on one single side at a time. Since the three challenges
are interconnected, they also evolve around a central question: How can carsharing
systems meet market demands? Companies will work out their interpretations of free-
floating carsharing systems in order to optimize them and gain competitive advantages](https://image.slidesharecdn.com/6e07fbad-1fc9-4865-930b-b3b2597817b7-150708184002-lva1-app6891/85/Seign_Dissertation-36-320.jpg)
![22 CHAPTER 2. STATE OF THE ART
assumptions and expert knowledge only. Having a model-based decision support that
helps to design locally adapted carsharing systems can be of great benefit to all parties
involved.
To answer the research question, it must be clarified which aspects of carsharing
systems must be adapted to different markets and which can be standardized. To guide
local adaptation, there must be an ultimate goal or success definition and measurement
to which adaptation efforts are oriented to. Finally, it must be identified which factors
influence success. That is a key question for adapting systems locally to the market. It
deals with factors that influence whether success becomes reality or not. Hence, these
factors are success factors. Only with this knowledge of the market (see challenge 3
above), providers can react accordingly and adapt carsharing systems to these factors
in order to benefit profitability (challenge 1) and the diffusion of the concept (challenge
2). In summary, three sub-questions must be answered:
a) Which aspects must be locally adapted?
b) How to define and measure success?
c) What influences success?
To make this research impactful in reality, it is a prerequisite to derive results that
are applicable. Only then, the innovation and society can directly profit from this re-
search. Consequently, this dissertation aims to build a model-based framework that
helps decision makers to design their free-floating carsharing systems according to lo-
cal needs. Since all markets are different and there are numerous ”soft” factors which
must be considered when determining the local shape of an offer, as for example lo-
cal politics, it is not aimed by the model-based framework to automatically compute
definitive answers but rather to give decision makers a guideline or ”recipe” to follow:
”An executive is a mixer of ingredients, who sometimes follows a recipe as he goes
along, sometimes adapts a recipe to the ingredients immediately available, and some-
times experiments with or invents ingredients no one else has tried.” (James Culliton,
1948 in [113])
2.6 Research Design and Methodology
This section aims to outline the research design of this dissertation. According to Rob-
son, ”[research] design is concerned with turning research questions into projects”.
Primarily, a framework that links purpose, theory, research questions, methods, and](https://image.slidesharecdn.com/6e07fbad-1fc9-4865-930b-b3b2597817b7-150708184002-lva1-app6891/85/Seign_Dissertation-38-320.jpg)
![2.6. RESEARCH DESIGN AND METHODOLOGY 23
sampling strategy needs to be developed. [185] Translated to this dissertation, the
research design determines the way from the research question to the model-based
framework, which purpose it is to answer the research question. To give an overview,
figure 2.7 depicts the research design of this work.
Research
Question
RESEARCH DESIGN V7.
Sub-
Questions
How shall free-floating carsharing systems be adapted to different markets?
Which aspects must be locally adapted?
Chapter 3:
Theoretical and Em-
pirical Background
How to define and measure success? What influences success?
→ What is success? → What is a success factor?→ What is a suitable structure to
describe, analyze, and adapt “aspects“
of carsharing systems?
Diffusion of InnovationsBusiness Model, Blueprinting,
Service Marketing Mix
→ What shall be adapted?
Operating Area
Aspect n
→ Determination of Aspects
that have to be locally adapted
→ Determination of Measures for
Success
Booking
Density
etc…
Measure n
→ Determination of Success
Factors
Chapter 4:
Developmentof a
Model-Based
Framework
Operating Area
Booking
Density
Aspect nAspect 2
Population
Density …
Model-Based Framework
Population
Density
Success Factor n
Adaptation vs. Standardization
• Expert, customer,
company interviews
• Structural Data
• Booking Data
• Expert interviews • Booking Data
etc…etc…
Figure 2.7: Research Design
The initial point of the research design is the research question of ”how shall free-
floating carsharing systems be adapted to different markets?”. As outlined in 2.5,
the research question leads to three sub-questions, namely a) ”which aspects must be
locally adapted?”, b) ”how to define and measure success?”, and c) ”what influences
success?”.
These sub-questions concern different angles of the main research question and
further theoretical background and guidance are needed to answer them. Regarding
the question of ”which aspects must be locally adapted?”, Business Model, Service
Blueprinting, and Marketing Mix theories are examined in order to find a suitable
structure to describe, analyze, and finally adapt ”aspects” of free-floating carsharing
systems. Next to this, it is necessary to review literature on the question whether to
adapt or standardize certain aspects of free-floating carsharing systems. The second](https://image.slidesharecdn.com/6e07fbad-1fc9-4865-930b-b3b2597817b7-150708184002-lva1-app6891/85/Seign_Dissertation-39-320.jpg)
![24 CHAPTER 2. STATE OF THE ART
sub-question, ”what is success?”, as well as the third sub-question ”what influences
success?”, are logically connected and both questions must rely on the same theoretical
basis. To determine success and success factors, this research relies on diffusion of
innovations theory as it suits best the posed challenges carsharing faces.
Having laid the necessary theoretical background, the gained structure and knowl-
edge is combined in an analysis with empirical data. The ultimate goal of this step is
to identify all the relevant input for the development of the model-based framework.
According to Denscombe, each research strategy has advantages and disadvantages
and some suit better than others for tackling specific issues. [65] For this reason, each
sub-question has its individual research methodology as well as different data sources
are used, including interviews and statistical analyses of booking and structural data.
Because of this complexity and variety of methodologies and data sources, the indi-
vidual analysis approaches are explained in the respective sections of this dissertation
(see 3.2.3, 3.3.2, and 3.4.2) rather than in a central methodology chapter. As a result
of this empirical analysis, it is clearly determined which aspects have to be locally
adapted, what are the possible measures for success, and what are the success factors.
This conglomeration is a prerequisite for the next step.
This next step combines all previous findings in the development of the model-
based framework that supports the local adaptation of free-floating carsharing systems
and hence answers the research question. To do so, every previously in sub-question
a) determined adaptive aspect is modeled individually first, for example the operating
area. To model aspects, it is necessary to know the goal of modeling or in other words,
what the model should achieve. For this, the analyzed success measures resulting from
sub-question b) are used and for example, booking density can be a suitable dependent
variable when modeling the operating area. To complete modeling, external success
factors or independent variables stemming from sub-question c) must be considered
which act as model inputs from the external environment. To follow the example of
modeling the operating area, population density could be a potential success factor.
However, not all aspects can rely on empirical findings since free-floating carsharing
is a very young innovation and data availability is limited accordingly. Therefore, the
findings in this report are only partially based on a posteriori knowledge. Other aspects,
where no empirical evidence existed or was available for this research, is based on a
priori knowledge or justification.
Once all aspects are modeled individually, it is necessary to combine them since
many aspects influence each other, e.g. the size of the operating area directly influences](https://image.slidesharecdn.com/6e07fbad-1fc9-4865-930b-b3b2597817b7-150708184002-lva1-app6891/85/Seign_Dissertation-40-320.jpg)

![3.2. WHICH ASPECTS MUST BE LOCALLY ADAPTED? 27
3.2 Which Aspects Must be Locally Adapted?
3.2.1 Structuring Carsharing Systems
In order to describe, understand, and analyze carsharing systems to adapt them locally
they have to be put in a structure or model. One possible theoretical framework is the
business model. There are broad and multifaceted views on the term ”Business Model”
and scholars do not agree on what a business model is. [266]
Osterwalder, Pigneur et al. aggregated a wide set of definitions into one broad
definition: ”A business model is a conceptual tool containing a set of objects, concepts
and their relationships with the objective to express the business logic of a specific
firm. Therefore, we must consider which concepts and relationships allow a simplified
description and representation of what value is provided to customers, how this is done
and with which financial consequences”. [172] Overall, business models provide a
structure to define which activities must work in which way to execute the company’s
strategy. Therefore, it is an intermediate structure between the firm’s theory of how
to compete and its activities. [182] In other words, ”a business model is the direct
result of strategy but it is not strategy itself” [46] and promotes innovation and market
success. [234, 119]
To bring free-floating carsharing systems into a structure and to illustrate the design
or shape of business models, Chesbrough suggested a mapping approach. [52] To al-
low for mapping and to consider all relevant components, business model frameworks
must be discussed but again there is a variety of opinions when it comes to compo-
nents of a business model and its configuration. [126] Chesbrough and Rosenbloom
argue that a business model has six main functions [51] whereas St¨ahler argues that a
business model consists of four main components. [223] Osterwalder aggregated find-
ings from 14 studies and developed a comprehensive framework composed out of nine
components, the Business Model Ontology or Canvas. [171] Applied to carsharing, the
business model canvas can look like figure A.1 in Appendix A.
Another possibility of structuring carsharing systems is through service blueprints.
Carsharing is a Product-Service-System (PSS) [191] and as every PSS, it ”consists
of tangible products and intangible services, designed and combined so that they are
jointly capable of fulfilling specific customer needs”. [34] Carsharing focuses on the
benefit of mobility rather than the car that enables it, because value is provided through
the service component, specifically flexibility. Therefore, service elements overweight.](https://image.slidesharecdn.com/6e07fbad-1fc9-4865-930b-b3b2597817b7-150708184002-lva1-app6891/85/Seign_Dissertation-43-320.jpg)
![28 CHAPTER 3. THEORETICAL AND EMPIRICAL BACKGROUND
Services are being characterized as being intangible, non-transportable, consumed im-
mediately, hard to standardize and very individual, and quality assessment is carried
out retrospective. [147, 33]
To consider the service component, service blueprinting is a methodology and tech-
nique to help address the difficulties of delivering the intangible, facilitating the com-
mon understanding of what a firm offers the market. With this technique the service
process, points for customer contact, as well as the evidence of service gets sketched
simultaneously from the customer’s point of view. This benefits the understanding for
the customer’s role in the carsharing service process, what carsharing users see, and
which employee or technology is in contact. It identifies potential points for failure and
opportunities and thereafter supports service development, costs, revenue, and capital
requirements. It constitutes a rational basis for all marketing efforts and standardizing
processes across units. [35, 221] Figure A.2 in Appendix A illustrates an exemplary
application to carsharing.
A third theoretical framework for structuring carsharing systems is the service mar-
keting mix, also known as 7Ps. The initial marketing mix as proposed by McCarthy
in 1960 consists of 4Ps, namely product, place, price, and promotion and for services
another 3Ps have been added: people, processes, and physical evidence. This allows
organizations to manage and differentiate brands and other intangible assets, which are
utterly important parts of a service firm’s value creation. [148]
Rather than being driven by the internal environment like capabilities and com-
petences, staff, or resources, a providers’ strategy whether to adapt or to standardize
aspects of carsharing systems should be responsive to the external environment. Whilst
Business Models and Service Blueprints have a strong focus on the internal environ-
ment, the concept of the service marketing mix focuses on aspects that are relevant for
the customer and hence for the diffusion or success (as defined in this dissertation) of
the concept. It incorporates aspects from Business Model theory (the right side of the
canvas) and Service Blueprinting (the visible components) and can therefore be chosen
as comprehensive and most suitable theoretical background for this research.
Also, practice and previous research show that the service marketing mix addresses
the topic of local adaptation best since it focuses on aspects that are relevant for local
adaptation and neglects aspects that are not. McDonald’s, being a PSS like carshar-
ing, is the most prominent example, where the 7Ps are adapted instead of the business
model. The firm uses an identical look, setting, and operating model in all its restau-
rants around the globe. Still, its menu is adapted to local tastes. The same is true for](https://image.slidesharecdn.com/6e07fbad-1fc9-4865-930b-b3b2597817b7-150708184002-lva1-app6891/85/Seign_Dissertation-44-320.jpg)
![3.2. WHICH ASPECTS MUST BE LOCALLY ADAPTED? 29
carsharing and according to Hillbrecht (in [203]), most operational settings of carshar-
ing models are independent of the local setting for which reason standardized booking
software solutions can be marketed worldwide with only minor adaptations according
to national bookkeeping and tax standards.
The 7Ps are main elements which consist of a variety of sub-elements. For exam-
ple, ”price” is not only a single number but also includes pricing methods, sales terms,
discounts, etc. In Appendix A every marketing mix element is broken down into its
substructure and applied to carsharing. This itemization was guided by a wide set of
literature which shall not be concealed: [56, 251, 249, 250, 215, 198, 134, 114, 228]
3.2.2 The Debate on Standardization versus Adaptation
Recalling the research question, the goal of this dissertation is to provide an answer
to the question of how free-floating carsharing systems shall be adapted to different
markets. Therefore, it is important to understand the debate of standardization versus
adaptation which helps to avoid costly mistakes through efficiency loss from lack of
standardization, inappropriate products for the intended market, mistakes in improper
pricing, or promotional blunders. [100]
This debate started in the early sixties with regard to international advertising,
shortly after Buzzel took the debate further by saying it could include not just ad-
vertising, but the entire marketing mix. He argued that differences among coun-
tries have lead companies to view their marketing approaches strictly as a local prob-
lem. Conversely, the situation started to change over time and out of experience a
number of firms suggested considering marketing mix standardization for potential
gains. [40, 251]
One school of thought generally supports using the same marketing mix world-
wide. Global marketers argue that technology is bringing the world together to a
”global village” resulting also in similar needs. One supporter of standardization is
Levitt, who believed in low priced, reliable, functional, and advanced products if they
are offered on the basis of global standardization. It helps companies to sell at low
relative costs and concentrate on what everybody wants rather than losing focus with
what people might like. [140] Also, global brands and standardized global marketing
are up and coming and could result in higher brand power, consistency, cost savings in
production and marketing from economies of scale. [131, 56] Today, it seems appar-
ent that international marketers standardize many of their marketing approaches like
packaging and branding across international markets as for example Coca-Cola. [56]](https://image.slidesharecdn.com/6e07fbad-1fc9-4865-930b-b3b2597817b7-150708184002-lva1-app6891/85/Seign_Dissertation-45-320.jpg)
![30 CHAPTER 3. THEORETICAL AND EMPIRICAL BACKGROUND
A contrary view is held by followers of an adapted global marketing mix. Here,
the producer or provider adjusts the marketing mix to the individual target market, ac-
cepting more costs in hope of more market share and return. According to Kotler and
Armstrong this idea holds that marketing programs will be more effective if person-
alized to the unique needs of every target group. [131] Furthermore, this idea applies
across international markets, where various cultural backgrounds are the source of dif-
ferent needs and wants, product preferences, shopping patterns, and spending power.
These differences are hard to change, which makes the adjustments of marketing mix
elements attractive in order to fit the desires in each nation.
The argument that the world is becoming a smaller place and more homogenized
might only be true for a limited number of products or service offers, which have
minimal product knowledge requirements for use and universal brand recognition.
Czinkota and Ronkainen explain that industrial products, i.e. chemicals, steel, agri-
cultural equipment are less culturally grounded and hold fewer adjustments than con-
sumer goods. [56] Nonetheless, it occurs that industrial products experience minor
alterations imposed by specific national standards like local regulations (e.g. electric
voltage) or different use patterns. [243] Marketers of medical equipment and other
technology-intense products find worldwide acceptance with a homogeneous product
offering. Also consumer and luxury goods as well as personal care products have a
relatively high degree of standardization, whereas food products do not. In general,
non-durable goods, e.g. groceries or clothes are very sensitive to cultural differences,
tastes, and habits, and are therefore issue to adaptation in foreign markets. [56, 178]
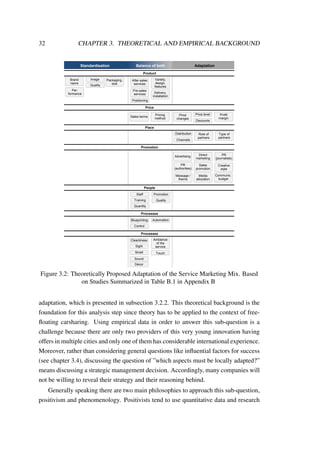
Figure 3.1 illustrates and tries to fit in carsharing in these findings.
Industrial/Technology Intensive Consumer/Nondurable
DegreeofCulturalGrounding
Nature of Product
Carsharing
Consumer
goods, luxury
goods, personal
care
Steel, chemicals,
agriculture
Medical equipment,
scientific instruments
Food
products
Figure 3.1: Strategic Adaptation of Different Products to Foreign Markets. Adapted
from [56].](https://image.slidesharecdn.com/6e07fbad-1fc9-4865-930b-b3b2597817b7-150708184002-lva1-app6891/85/Seign_Dissertation-46-320.jpg)
![3.2. WHICH ASPECTS MUST BE LOCALLY ADAPTED? 31
Cars belong to a group of certain durable consumer goods that can be standard-
ized more easily. However, even if these are less subject to modifications due to the
cultural environment, they can require adaptation for other reasons connected to legis-
lation (import), climate (air conditioning), or local technical standards (type of head-
lights). [243] The carsharing service concept is also assumed to be rather standardiz-
able since cars and consumer electronics (smartphones) are its basis. Nevertheless, the
idea of sharing status-loaded cars might be perceived differently in culturally differ-
ent areas. Moreover, carsharing is an integrated part of local transportation systems
which differ drastically from location to location. Therefore, a healthy balance of stan-
dardization and adaption must be found and not just on a national but on a local level
as every city represents a different environment for transportation. Adaptation as the
only solution increases costs tremendously and also leads to consumer confusion. For
example an organization offering two completely different concepts of carsharing in
Munich and Berlin would lead to misunderstandings, loss in brand recognition and re-
call, as well as a diluted image. This contingency approach applies for many products
and an extreme use of either approach is acknowledged to be not practical. [251, 192]
In order to understand to which degree carsharing can be standardized and must
be locally adapted, it is important to review literature on previous attempts to this
topic. Specifically for carsharing, whether traditional or free-floating, no literature
was found. Similarly, the debate of standardization vs. adaptation is usually seen
in an international context [131] rather than looking at a smaller scale such as inter-
city adaptation. Nevertheless, numerous studies were conducted with other products
and industries and this could provide important insights that might be transferred to
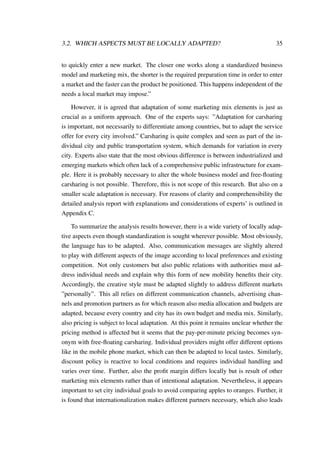
carsharing. Table B.1 in Appendix B gives an overview on the reviewed studies and
figure 3.2 tries to summarize the results of this literature review. These results can be
seen as proposed framework for the adaptation of the 7Ps and will guide analysis in
the following subsection, where these theoretical propositions are applied to carsharing
with the help of expert interviews.
3.2.3 Approach and Data Base
In order to answer the sub-question of which aspects of carsharing systems must be
locally adapted, theory gives a guideline. As discussed in subsection 3.2.1, the service
marketing mix appears as useful theoretical basis to structure and analyze aspects of
carsharing systems in the context of this dissertation. Which of these aspects must
then be locally adapted is guided by findings from the debate of standardization versus](https://image.slidesharecdn.com/6e07fbad-1fc9-4865-930b-b3b2597817b7-150708184002-lva1-app6891/85/Seign_Dissertation-47-320.jpg)
![3.2. WHICH ASPECTS MUST BE LOCALLY ADAPTED? 33
is replicated repeatedly to reduce errors. This view is generally taken on less com-
plex areas, where repetition is possible. The phenomenological view is more holistic
and the resulting conclusion is not necessarily generalizable. Due to the diverse na-
ture of the subject, it tends to rely on qualitative data and studies fewer objects more
deeply. In other words, it focuses on the how and why rather than on what and how
many. [180] Due to the outlined circumstances and the nature of the object studied,
this research follows a phenomenologist view, relying on qualitative data and focusing
on carsharing. Outcomes may be similar to other innovations, but the exact conditions
and variables are unlikely to be replicated. To generate all in-depth information re-
quired for the research’s aims and objectives, interviews with experts are believed to
be the most appropriate method. Following Glaeser and Laudel, experts hold specific
knowledge on the topic and are witnesses of the processes of interest. [102] Advan-
tages lie in the possibility to gain insights into the behavior of organizations and allow
for comprehensive comparison of the experts’ responses on the topic. [262]
For this analysis, structured interviews are conducted to incorporate findings from
theory. A written interview guide, which design is led by the theoretical background
given previously, structures the interviews and helps to focus on the main questions of
the research. It suggests theoretical findings (see figure 3.2) to the experts who then
explain whether they agree or disagree for the case of carsharing. Moreover, it ensures
that all data needed is gathered in a similar way. [102] A good guide leads experts
not to speak about negligibilities, but to communicate open and to the heart of the
topic. [15]
All in all, twelve individual interviews are arranged which is, according to theory,
a sufficient number in qualitative interviews to be representative. [152] In these inter-
views experts from slightly different areas are interviewed, including mobility services
strategists, carsharing business developers, the CEO of a carsharing venture and trans-
portation engineering researchers. Nevertheless, the use of multiple sources is limited
and certain bias is given, because ten of the experts interviewed work for the same com-
pany. This is due to the fact that the topic is quite sensitive. As discussed previously,
the question of ”which aspects must be locally adapted?” means discussing a strategic
management decision and many companies do not want to reveal their strategy and
their reasoning behind.
Following the interviews, data is recorded, stored, analyzed, and matched to theory
and the aim of the research. Figure 3.3 depicts the procedure leading to the report,
which can be found in detail in Appendix C. The process leading up to the report](https://image.slidesharecdn.com/6e07fbad-1fc9-4865-930b-b3b2597817b7-150708184002-lva1-app6891/85/Seign_Dissertation-49-320.jpg)
![34 CHAPTER 3. THEORETICAL AND EMPIRICAL BACKGROUND
includes comparing data gained from qualitative research with theory and verifica-
tions. Here, changes and extensions to the proposed classifications of marketing mix
elements are analyzed. In other words, the data analysis is confirmative as well as ex-
ploratory. The gathered data is compared to definitions and empirically based findings
from theory to confirm or confute the relevance for this case. Data that does not fit
in prescribed definitions is explored to potentially expand given theoretical prescrip-
tions. [146]
Once it is known which aspects should be locally adapted, it must also be decided
which of these aspects should be modeled in order to answer the overall research ques-
tion. This discussion can be found in subsection 3.2.4 and represents the result of this
analysis step.
Interviews
•In-person /
via telephone
•Guided by
questionnaire
•Non-leading
open
questions
•Notes
•Audio-
Recording (if
ok)
•Double-
Checking
Interview
Coding Sheet
•Matching of
the
conversation
with key
questions
•Content
filtering
based on
study aim
Study
Database
•Collection,
organisation,
and
transcription
of raw data
Analysis
•Pattern
Matching
•Logic linking
of data to
theoretical
propositions
Report
•Linking of
analysis
results to
study aim
•Deployment
of
hypothesizes
Figure 3.3: Data Gathering and Analysis Procedure
3.2.4 Analysis Results
In general it can be said that organizations cannot know all the little details of every
country or city. Experts agree that they must cope with this and standardize as much
as possible to limit complexity for the customer and to reduce costs. It is said that
standardization is desired to the highest possible degree, especially in fundamental de-
cisions. It is suggested to build on standardized fundamentals and customize further
business decisions to local requirements. This becomes key to carsharing, because it
is always a city specific product due to given local infrastructures and its individually
perceived usability. Also, profitability comes with the application of the learned, so
”teething problems” can be bypassed. In the ideal world, there is one business model
and its corresponding marketing mix that is rolled out to every nation and city ap-
proached. One of the specialists says: ”Every standardization opens up the possibility](https://image.slidesharecdn.com/6e07fbad-1fc9-4865-930b-b3b2597817b7-150708184002-lva1-app6891/85/Seign_Dissertation-50-320.jpg)
![3.3. HOW TO MEASURE SUCCESS? 37
about drivers of success is an important knowledge base for managers to base their
decisions on and to measure the impact of decisions made. Key to the concept is the
conviction that the multidimensional and multicausal success of a venture, in this case
carsharing, is credited by a few central factors - success factors. [197] The concept
was first introduced by Daniel in 1961 [61] and since then a vast amount of empirical
works was concerned with the investigation of determinants for success. Thus, success
factor research can be regarded as an independent and empirically oriented research
approach that can be focused on a variety of analysis objects, success definitions and
measured variables, research methodologies, and analysis methodologies. [197]
Before determining success factors, the dependent variable that represents success
must be specified. To do so, the notion of success must be defined as it could com-
prise in quality measures, reduced congestion, financial performance, user satisfaction,
operational efficiency, and so on. This work understands success as a scenario where
carsharing (potentially with electric vehicles) is diffused to our societies so that its
advantages can be unfolded, satisfying all stakeholders - providers are profitable, of-
fers meet markets’ demand, cities’ traffic problems are reduced – and a new mobility
paradigm has arrived. This however is not a very clear definition of success and sec-
tion 2.4 revealed that a variety of challenges that have to be overcome before this could
become reality:
a) Profitability is jeopardized
b) The diffusion of free-floating carsharing is still in the beginning stage and must
be supported
c) Companies know little about the market
It was also derived that the local adaptation of carsharing systems addresses these
challenges and in order to know how to adapt, a key is to know which factors influence
the decision to use carsharing. According to Rogers, an individuals’ ”decision to make
full use of an innovation as the best course of action available” is defined as adop-
tion. [186] From this it follows that adoption is a good notion for success because it
targets the three main challenges of carsharing:
a) Profitability. Knowing how to stimulate diffusion (see b)) and satisfy markets
(see c)) translates into more revenue which could lead to scale effects and prof-
itability. Moreover, Mansfield showed that the speed of diffusion is positively
related to the profitability of adoption. [144]](https://image.slidesharecdn.com/6e07fbad-1fc9-4865-930b-b3b2597817b7-150708184002-lva1-app6891/85/Seign_Dissertation-53-320.jpg)
![38 CHAPTER 3. THEORETICAL AND EMPIRICAL BACKGROUND
b) The limited diffusion. Referring back to Schumpeter [201] adoption follows a
process in an economy, the diffusion, which is consequently a process of in-
dividual adoptions. Following this, knowing what influences adoption means
knowing what influences diffusion.
c) Companies’ limited market knowledge. Knowing about local influences on cus-
tomers’ decisions to use the concept means knowing the market.
Once carsharing is adopted by more people, it reaches a critical mass and enough
individuals have adopted so that further adoption is self-sustaining. [186] This leads
to positive feedback effects (e.g. better financial results and better environmental ef-
fects) and consequently to holistic success – close to the previously described success
scenario.
3.3.2 Approach and Data Base
Since success was defined as adoption or an individual’s decision to use carsharing,
the desired outcome can be translated to how many people decide to use carsharing
(=number of customers), how often individuals decide to use carsharing (=number of
bookings), and also how intensely they decide to use carsharing (=duration of book-
ings). This logically translates in the key revenue streams of carsharing providers
since adoption and profitability are strongly related. This approach is summed up in
figure 3.4.
Success
Adoption,
manifested
through:
Number of
Customers
Number of
Bookings
Duration of
Bookings
Impacted by
Adoption
Determinants =
Success Factors
Figure 3.4: Measures of Adoption as Possible Manifestations of Success
These variables are ”dependent” on ”independent” adoption determinants (success
factors) as previously described. Also, in order to enable local adaptation, potential
dependent variables must be suitable for being geographically assigned to certain parts
of the city to highlight more successful locations. Each of the three adoption measures
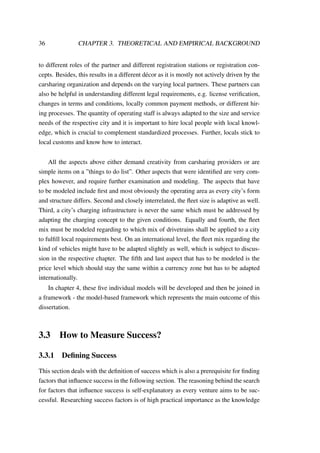
can be geographically represented as density, e.g. customer density in an area. In order](https://image.slidesharecdn.com/6e07fbad-1fc9-4865-930b-b3b2597817b7-150708184002-lva1-app6891/85/Seign_Dissertation-54-320.jpg)
![3.3. HOW TO MEASURE SUCCESS? 39
to find the most important of these three potential variables and to be able to interpret
them as well as upcoming analysis results, the next section will quantitatively describe
them with the use of descriptive statistics.
Unlike most transit agencies, which are the subject of the vast majority of trans-
portation research, carsharing is a competitive industry. This competitive nature has
important implications for this research, because much of the detailed information
on member characteristics and operational performance is considered proprietary by
carsharing operators. [151] For this dissertation however, a data base was provided
by DriveNow, a premium free-floating carsharing provider which launched operations
first in Munich (June 2011), followed by Berlin (September 2011), D¨usseldorf (January
2012), San Francisco (August 2012 but as an A-to-B station-based system), Cologne
(October 2012), and Hamburg (November 2013). The premise for choosing the data
base is to rely on a sufficiently long analysis period while possible run-up and seasonal
effects should be cut out. Hence, a 12 month period starting a while after the launch of
a city appears best. Given the potential dataset for this research, only Berlin and Mu-
nich offered suitable data while D¨usseldorf appeared as an attractive data source for
evaluation because the data set comprises a similar time span. As a result and after data
cleansing (removal of service bookings and corrupt entries) n= 652.407 bookings that
occurred in Munich and Berlin from November 2011 to October 2012 are analyzed.
For each of the bookings there is reliable data on the vehicle ID, start and end time and
date, start and end GPS-coordinates, trip type (private, business, service), customer ID,
and reservation type (website, mobile, spontaneous).
Structural data for cities stems from infas GEOdaten. [98] This provider was cho-
sen for having the most comprehensive data base in Germany even though not ev-
ery potentially interesting factor is available. The data is supplied on ”Wohnquartier”
(KGS22) level. These areas/tracts/segments are based on electoral districts and com-
prise roughly 500 households. For Berlin, this equates to 3886 tracts, for Munich to
1685 tracts, and for D¨usseldorf to 593 tracts. This fine scale is needed to show the
variance of data within a city as well as to ensure a sufficiently big sample size.
For the determination of dependent and independent variables only tracts with more
than 50 bookings (equals to one booking per week) are considered to eliminate out-
liers, effects of the predefined business areas, parks, lakes, etc. in the data. Through
this measure, 2568 tracts for Berlin and 877 for Munich are eliminated in which only
15.305 or 2.36% of all bookings occurred. For further analysis, such as in the modeling
of the business area in subsection 4.3.1, the whole dataset is used.](https://image.slidesharecdn.com/6e07fbad-1fc9-4865-930b-b3b2597817b7-150708184002-lva1-app6891/85/Seign_Dissertation-55-320.jpg)
![40 CHAPTER 3. THEORETICAL AND EMPIRICAL BACKGROUND
3.3.3 Finding and Describing Suitable Dependent Variables as Mea-
sures of Success
Number of Customers
Overall, the number of active customers (a customer who drove at least once within
the examined 12 months) in both cities (see figure 3.5) is constantly growing in the
examined period while Berlin shows a higher growth rate.
0
2,000
4,000
6,000
8,000
10,000
12,000
14,000
16,000
18,000
20,000
Nov
11
Dec
11
Jan
12
Feb
12
Mar
12
Apr
12
May
12
Jun
12
Jul
12
Aug
12
Sep
12
Oct
12
Munich & Berlin
Munich
Berlin
Figure 3.5: Number of Active Customers over Time per City in the Data Collection
Period
However, the absolute number of customers does not reveal customer behavior.
Figure 3.6 shows that there is an uneven distribution of the number of customers com-
pared to the number of bookings: only 10% of the most active users account for 53%
of all bookings. This is equally true for both cities as well as for the duration of book-
ings (see figure 3.7). Considering this, the ten most active percent of active customers
even account for 56% of the accumulated booking time.
In order to specify customer segments more clearly, a cluster analysis was per-
formed. The chosen cluster method was a two-step cluster analysis, which, according
to Schendera [195] and Denk [64] suited best compared to hierarchical methods due
to the large amount of data. Cluster variables are regularity (in how many of the 12
studied months did the customer book), booking duration, and number of bookings.
The number of clusters is determined by the Bayesian information criterion (BIC), re-
turning three clusters which are described in table 3.1 as well as they are marked in
figure 3.6 and figure 3.7.](https://image.slidesharecdn.com/6e07fbad-1fc9-4865-930b-b3b2597817b7-150708184002-lva1-app6891/85/Seign_Dissertation-56-320.jpg)
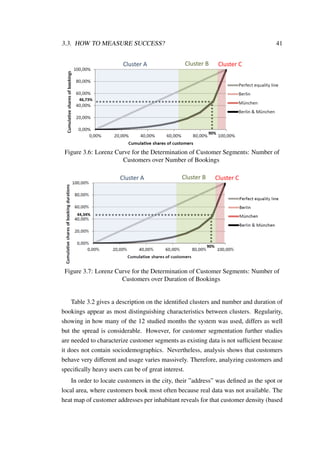
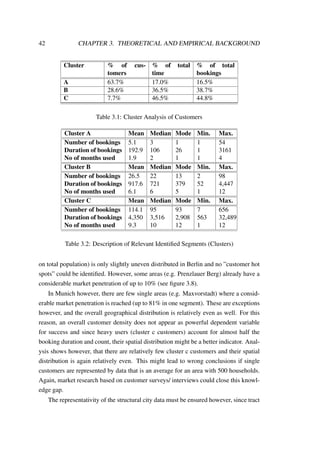
![3.3. HOW TO MEASURE SUCCESS? 43
0 – 0.005 Customers per inhabitant
0.005 – 0.009 Customers per inhabitant
0.009 – 0.11 Customers per inhabitant
0.011 – 0.02 Customers per inhabitant
0.02 – 0.1 Customers per inhabitant
Legend
5 quintiles
Figure 3.8: Customer Addresses: Customers per Inhabitant - Berlin
data is connected to the local inhabitants. To ensure this, it is analyzed if there is a
relationship between booking and living. Under the assumption that customers are
willing to walk up to 5min or 500m [154, 235] to a car and also from a car to their
home (due to parking), data shows that 61.1% of all bookings either start or end close
(<0.5km) to a customers’ home address. This shows that the home address is very rel-
evant, even if it only accounts for 61% of bookings. Interestingly, heavy users (cluster
C) show an even higher home involvement, indicating that these users see carsharing
as a replacement for car ownership (see figure 3.9).
Number of Bookings
The total number of bookings over time shows a steady increase (see figure 3.10) as the
business is fairly new and expanding for which reason a month by month comparison
could lead to wrong conclusions. Again, Berlin shows a higher growth rate which can
be explained by a bigger size of Berlin, faster customer growing rates, and a better
booking per member ratio. It must be noted that the decrease in bookings in Berlin in
10/2012 is due to missing data in the analyzed data-set and not because of a decrease
in bookings in reality.](https://image.slidesharecdn.com/6e07fbad-1fc9-4865-930b-b3b2597817b7-150708184002-lva1-app6891/85/Seign_Dissertation-59-320.jpg)
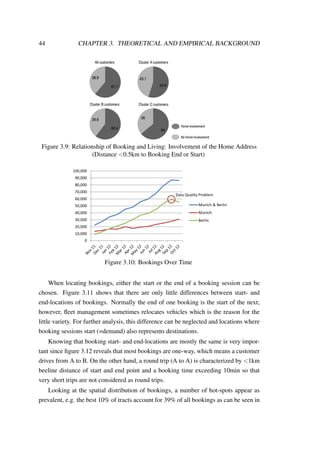
![3.3. HOW TO MEASURE SUCCESS? 45
Booking Count End (Destination) [per tract]
6.0004.0002.0000
BookingCountStart[pertract]
6.000
4.000
2.000
0
München
Berlin, Stadt
R2 Linear = 0,991
Seite 1
Figure 3.11: Difference of Counts of Booking Start and End Points
90% 86% 88%
10%
14%
12%
0%
10%
20%
30%
40%
50%
60%
70%
80%
90%
100%
Berlin Munich Berlin & Munich
one way
round trip
Figure 3.12: Driving Profiles (One Way and Round Trips)
figure 3.13. The uneven distribution of tracts and number of bookings is equal in both
cities and suggests that there are more successful areas and less successful areas in both
cities. The unevenly distributed booking density of both cities can also be depicted by
heat-maps, see figure 3.14 and 3.15, showing the distribution of bookings per km2.
Duration of Bookings
The duration of bookings can be geographically located by assigning each start point
the duration of the booking. Normalized, this leads to a booking duration density
which is the sum of booking minutes initiated in a segment divided by its area. There
are some areas that cause an over-proportionally long booking duration, but overall](https://image.slidesharecdn.com/6e07fbad-1fc9-4865-930b-b3b2597817b7-150708184002-lva1-app6891/85/Seign_Dissertation-61-320.jpg)
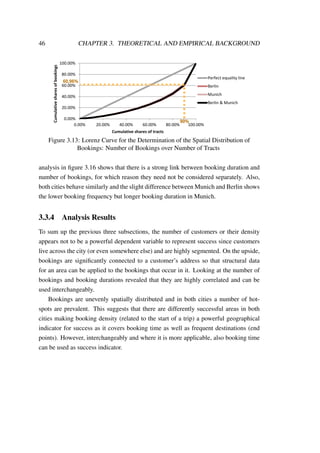
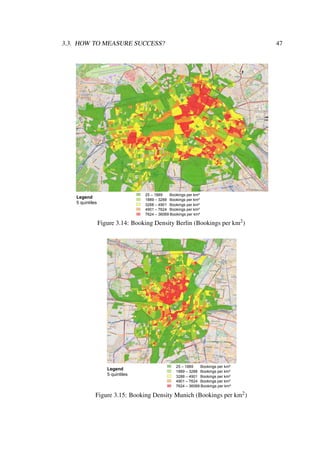
![48 CHAPTER 3. THEORETICAL AND EMPIRICAL BACKGROUND
Booking Duration Density [km², sum per tract]
1.250.0001.000.000750.000500.000250.0000
BookingDesnity[km²]
40.000
20.000
0
München
Berlin, Stadt
R2 Linear = 0,911
Figure 3.16: Scatterplot to Determine Relationship of Booking Duration and Number
of Bookings within a Tract](https://image.slidesharecdn.com/6e07fbad-1fc9-4865-930b-b3b2597817b7-150708184002-lva1-app6891/85/Seign_Dissertation-64-320.jpg)
![3.4. WHAT INFLUENCES SUCCESS? 49
3.4 What Influences Success?
3.4.1 Defining Success Factors
Following the definition of success in section 3.3.1, a success factor in this research is
a factor that influences or determines adoption. According to Rogers [186], five factors
influence adoption and its rate:
• Attributes of an innovation, as perceived by potential adopters
• The number of people involved in making an adoption decision
• Communication channels, because if awareness is only spread through interper-
sonal channels it slows down diffusion
• The nature of the social system, which determines communication and percep-
tions
• The extent of promotion efforts, which raises awareness effectively during the
early stages of adoption
Taking Rogers work into consideration, Wejnert and Faiers extend the approach
[257, 77] and and make it less communication focused and therefore more compre-
hensive. Here, variables influencing the decision to adopt an innovation are grouped
into three major components: environmental context, characteristics of adopters, and
attributes of the innovation. Figure 3.17 gives an overview on the three determinants
discussed in this section, their interrelatedness and their underlying variables.
Environmental Context
Innovations are not independent from their environmental context. Their successful
transfer depends on their fit with the new environments which they enter during diffu-
sion. Five environmental context variables are proposed:
(1) Geographical settings affect adoption by influencing the applicability of the
innovation to the existing infrastructures as innovations can be adopted only when they
are suitable to the environment of the adopter. Additionally, effects of geographical
proximity play a role since innovations spread automatically between individual actors
who are in close geographical contiguity.
(2) Variables of societal culture such as belief systems (values, norms, language,
religion, and ideologies), cultural traditionalism, cultural homogeneity, and socializa-
tion of individual actors influence adoption of innovations.](https://image.slidesharecdn.com/6e07fbad-1fc9-4865-930b-b3b2597817b7-150708184002-lva1-app6891/85/Seign_Dissertation-65-320.jpg)
![50 CHAPTER 3. THEORETICAL AND EMPIRICAL BACKGROUND
(3) The impact of political conditions on adoption primarily concern political sys-
tems, along with the regulations and norms inherent in the legal systems that control
actors’ behaviors.
(4) Variables related to global uniformity include: First, institutionalization, the
spread of rule-like behavioral models providing an implicit structure of incentives for
the adoption of approved forms of practices; second, global technology, facilitated by
the growth of multinational corporations; and third, world connectedness via modern
communication systems or media effects. [257]
(5) Existing competition for an innovation influences adoption [97, 16] as it gives
alternatives and fuels expectations. This variable is not an original part of many frame-
works as it is similar to the ”relative advantage” an innovation must have to be adopted
(see innovation attribute dimension below). However, since carsharing is a local prod-
uct, mostly the existence and condition of local competition matters and is conse-
quently treated as fifth variable within the environmental context.
Characteristics of Adopters
Rogers’ [186] categorization of adopters shows that individual characteristics play an
important role in adoption. Also marketing research covers this topic extensively as
differences between consumers are of fundamental interest to marketers and many
types of differences are listed. [67] Here, six sets of variables modulate the adoption
of innovations:
(1) The societal entity of adopters is important because adoption processes are
different for individual actors compared to collective actors such as organizations. In
this work this can be factored out since the focus is on individual adoption only.
(2) The familiarity with the innovation is influential because people are naturally
cautious in approaching novelty and therefore the rate of adoption of an innovation
increases as its novelty decreases. Information obtained from close peers reduces nov-
elty and increases familiarity with innovations. Information from media or experts has
the same effect but to a lesser extent.
(3) Status characteristics of adopters refer to the prominence of an actor’s relative
position within a network. High-status members identify innovations and then spread
them to lower-status members. This can be the opposite when innovations are contro-
versial in nature because lower-status members are less fearful of losing popularity by
nonconformist behavior.](https://image.slidesharecdn.com/6e07fbad-1fc9-4865-930b-b3b2597817b7-150708184002-lva1-app6891/85/Seign_Dissertation-66-320.jpg)
![3.4. WHAT INFLUENCES SUCCESS? 51
(4) Socioeconomic characteristics of the adopter influence adoption. Here, eco-
nomic variables often account for more variance in adoption than sociodemographic
variables or an actor’s social position.
(5) The relative position in social networks determines adoption since timing of
adoption typically depends on the interaction of social units in a process of communi-
cation. Interpersonal networks significantly impact adoption: Adoption by some actors
has a cumulative effect on the adoption decisions of other actors in the social network.
(6) Personal characteristics of individual actors modulate adoption of innovations.
Self-confidence, risk-taking propensity, and independence are suggested because they
modulate the extent to which an individual adopts an innovation without waiting for
the security of observing others. Personal characteristics, however, are modulated by
societal culture. [257]
Attributes of the Innovation
Transforming the objective, measurable innovation attributes into innovation attributes
as perceived by adopters is the subject of this category [93] and Rogers proposes five
innovation attributes (first in [187]) that influence an individual’s perception:
(1) Relative Advantage ”is the degree to which an innovation is perceived as being
better than the idea it supersedes”. This might include economic factors (initial cost,
cost of use, saving of time/effort), status aspects (social prestige, trend), and comfort
(decrease in discomfort, immediacy of reward, low risk). [186]
(2) Compatibility ”is the degree to which an innovation is perceived as consis-
tent with the existing values, past experiences, and needs of potential adopters.” An
innovation can be compatible/incompatible with sociocultural values and beliefs (cul-
tural values, local habits, naming of an innovation), previous adoptions and ideas (past
experience and behavior, existing technology), and client needs for the innovation (ful-
fillment of felt and conscious needs). [186]
(3) Complexity is defined as ”the degree to which an innovation is perceived as
relatively difficult to understand and use.” Subdimensions could be the simplicity of
understanding and using the innovation as well as availability of support. [186]
(4) Trialability is defined as ”the degree to which an innovation may be experi-
mented with on a limited basis” [186] Trialability should refer to the physical dimen-
sion, the interface dimension, and the informational dimension. [3]
(5) Observability is defined as ”the degree to which the results of an innovation are](https://image.slidesharecdn.com/6e07fbad-1fc9-4865-930b-b3b2597817b7-150708184002-lva1-app6891/85/Seign_Dissertation-67-320.jpg)
![52 CHAPTER 3. THEORETICAL AND EMPIRICAL BACKGROUND
visible to others”. This relates to the tangible aspect as well as the informational aspect
of an innovation. [186]
In general, the high value of innovation attributes is accounted for by many disci-
plines. For example, this comprises marketing, [157] organizational theory, [263] and
psychology. [81, 4] Especially the domain of information technology researches this
area under the label of information systems implementation research [133] and more
recently, technology acceptance modeling (TAM). [63, 246] TAMs were constantly
modified in the last two decades [53] but are only proven in an IT-context and adoption
determinants are similar to attributes which are proposed by Rogers. [3]
Consequently, Rogers’ five attributes have been widely discussed, adapted and
modified by many scholars over the last decades (see [155, 62, 112, 239, 229, 248,
233, 3, 252] but overall, after more than 40 years his proposed attributes still appear
very relevant - also for this dissertation.
To sum up, three determinants of adoption or success factor ”categories” were dis-
cussed: environmental context, characteristics of adopters and attributes of the innova-
tion. This theory acts as a good foundation for the determination of success factors for
carsharing with and without electric vehicles.
Environmental
Context
Characteristics
of Adopters
Innovation
Attributes
•Geographic Settings
•Societal Culture
•Political Conditions
•Global Uniformity
•Existing Competition
•Familiarity with the Innovation
•Status Characteristics
•Socioeconomic Characteristics
•Relative Position in Social
Networks
•Personal Characteristics
•Relative Advantage
•Compatibility
•Complexity
•Trialability
•Observability
Adoption
Figure 3.17: Determinants of Adoption and their Underlying Variables as Success
Factors](https://image.slidesharecdn.com/6e07fbad-1fc9-4865-930b-b3b2597817b7-150708184002-lva1-app6891/85/Seign_Dissertation-68-320.jpg)
![3.4. WHAT INFLUENCES SUCCESS? 53
3.4.2 Approach and Data Base
In this dissertation, success factors are determined independently from other research
efforts since previous research (see chapter 2.4) was concerned with station-based car-
sharing. Naturally, there will be overlaps to already determined factors, but chances
are that there might be new aspects for this new concept that have not been consid-
ered before, justifying the need for this analysis. The overall analysis approach for the
determination of success factors (independent variables) consists of three main steps
which are depicted in figure 3.18.
What Influences Success?
ArgumentativeExploration:What is relevant for local adaptation?
Qualitative Determination of Success Factors:What possibly determines adoption?
Quantitative Determination of Success Factors:Which factors determine adoption in which
combination andto which extent (on a local level)?
1
2
3
Figure 3.18: Overall Analysis Approach for the Determination of Success Factors
In a first step, it has to be determined what the specific determinants for the adop-
tion of carsharing are. When choosing the sources of evidence the research strategy
does not necessarily determine sources and moreover, the usefulness for the research,
not the absolute strength of a source is crucial. [65] For this part of the work, in-
terviews seem especially useful due to the innovative character of free-floating car-
sharing. Semi-structured interviews, with predominant questions that can be modified
during the interview, [185] might be the most important way to conduct a research in-
terview because of its flexibility balanced by structure, and the quality of the data ob-
tained. [101] Additionally, applying open-ended questions allows the respondent com-
plete freedom to reply and to take up a direction in the response. [121] Furthermore,
benefits from data can be maximized by using multiple sources of evidence [262] and
data triangulation is achieved by interviewing stakeholders with different perspectives:
customers, experts, and companies. This triangulation of stakeholders implicates the
fact of viewing something from different perspectives, just like in trigonometry where
an exact location of a point can be found if it is viewed from two other known posi-
tions. [65] Because this innovation is only currently emerging, stakeholders of conven-
tional carsharing and/or electromobility are also interviewed as they are likely to be
future stakeholders of (E-)carsharing.](https://image.slidesharecdn.com/6e07fbad-1fc9-4865-930b-b3b2597817b7-150708184002-lva1-app6891/85/Seign_Dissertation-69-320.jpg)
![54 CHAPTER 3. THEORETICAL AND EMPIRICAL BACKGROUND
As a result, the study relies on 34 interviews in total, conducted in Germany,
Netherlands, UK, France, Switzerland, Austria, and USA in person and over the phone:
• 10 interviews with carsharing-providers of which six have experience with BEVs
• 3 interviews with manufacturers of BEVs
• 9 interviews with customers of electromobility and carsharing
• 12 interviews with other stakeholders from governments, suppliers, infrastruc-
ture providers, universities or industry-experts
These interviews were also used by the author for his dissertation submitted for
the degree of Master of Philosophy in Industrial Systems, Manufacturing and Manage-
ment at the University of Cambridge. This work holds the title ”Business Models for
the Diffusion of Innovation: Understanding the Adoption of Carsharing with Electric
Vehicles” [206] and the gathered data was used within a case study for a different re-
search question of ”how can business models be designed to support the adoption of
innovations?”. Further, a summary was presented at the Conference on Future Auto-
motive Technology 2013 [207].
Just as explained in section 3.2, following the interviews, data was recorded, stored,
analyzed and matched to theory and the aim of this research. This is depicted in fig-
ure 3.3.
Having determined the broad range of hypothetical adoption determinants for car-
sharing, step two is to explore them argumentatively and qualitatively whether they
are relevant for local adaption or not. Since the input of step one is based on broad
and universally valid diffusion of innovation theory, this step ensures research specific
focus and reduces complexity in order to enable quantitative analysis in step three. For
this and for step two the same booking and structural data base as in section 3.3 was
used, where the data was also described in detail.
Step 3 uses this data and the input from step 1 and 2 to perform a regression anal-
ysis. The reasons for choosing this method of analysis are multifarious. Most impor-
tantly, there is a need for a multivariate analysis method because independent variables
are possibly interrelated. Also, factors with the biggest impact on success on a uni-
variate basis might be different from a multivariate perspective which is closer to real
world’s complexity. According to Backhaus et al. multivariate analysis methods can
be grouped in ”structure verifying” and ”structure discovering” methods. [14] Since
step 1 is concerned with developing hypothesizes about possible relationships, in gen-
eral, structure verifying methods should be applied in order to test these hypothesizes.
Within the range of possible methods, the scales of measure regarding the dependent](https://image.slidesharecdn.com/6e07fbad-1fc9-4865-930b-b3b2597817b7-150708184002-lva1-app6891/85/Seign_Dissertation-70-320.jpg)
![3.4. WHAT INFLUENCES SUCCESS? 55
and independent variables are important. Since this research is concerned with metric
scale levels rather than nominal scale levels, regression analysis and time series are
possible methods that qualify. However, temporal and periodical relationships are not
in focus for which reason regression analysis appears as most useful analysis method.
It can be used to estimate relationships among variables, give prognoses on how the
dependent variable changes when one of the independent variables changes, as well
as it is possible to create predictions for future developments (ceteris paribus). [14]
Furthermore, regression analysis can also be used to explain observed spatial patterns
as it allows to model, examine, and explore spatial relationships. [204] To carry out a
regression analysis, Sutherland and Bergin [232] propose five steps:
1. Create scatter plots between the dependent variable and all independent variables
in order to note direction and strength of possible relationships (e.g. if there is
any relationship at all and if it is linear to fit in methodological assumptions of
regression analysis)
2. Run OLS (ordinary least squares) regression
3. Check if the overall model is significant
4. Check if the coefficients are significant
5. Check which variable is most important and how much variation the model ex-
plains
Subsection 3.4.5, where the regression analysis is performed, is designed according
to these five steps and detailed statistical explanations will be given where applied.
3.4.3 Qualitative Determination of Success Factors
In order to get a comprehensive overview on what possible success factors (adoption
determinants) for free-floating carsharing might be, 34 interviews were carried out and
as a result 152 hypothetical factors appeared. These factors are presented as hypothe-
sizes organized by their theoretical roots in table 3.3.
Again, to keep this work clear and comprehensible, the detailed analysis report
with explanations and considerations of experts’ is outlined in Appendix D.](https://image.slidesharecdn.com/6e07fbad-1fc9-4865-930b-b3b2597817b7-150708184002-lva1-app6891/85/Seign_Dissertation-71-320.jpg)
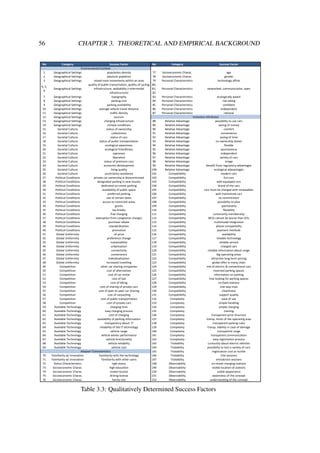
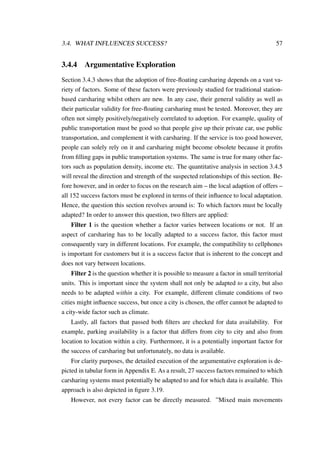
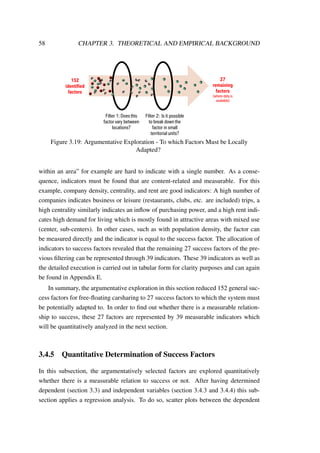
![3.4. WHAT INFLUENCES SUCCESS? 59
and all independent variables (represented through the 39 indicators) have to be cre-
ated as the direction and strength of possible relationships must be noted in order to
verify that the hypothetical relationships are true and that methodological prerequisites
of regression analysis are met (e.g. linearity). [232]
When examining these scatterplots – which can be found in Appendix F – and the
respective coefficient of determination R2 (which is in this case of a two-dimensional
regression also the squared Pearson product-moment correlation coefficient), only 13
notable relationships are found. These relationships are noted between booking density
as dependent variable and the following independent variables:
1. population density (R2 = 0.1104)
2. company density (R2 = 0.2004)
3. rent index (R2 = 0.1437)
4. distance to an ICE train station (R2 = 0.1123)
5. distance to the city center (town hall) (R2 = 0.1578)
6. restaurant and hotel density (R2 = 0.1782)
7. natural gas vehicle affinity index (R2 = 0.0701)
8. lifestyle (type down-to-earth) (R2 = 0.0462)
9. lifestyle (type materialistic oriented) (R2 = 0.0531)
10. car density (R2 = 0.1049)
11. one person households (R2 = 0.05)
12. UMTS affinity index (R2 = 0.1271)
13. high-tech affinity index (R2 = 0.113)
In this consideration, company density explains twenty percent of the variation in
the response variable booking density. The remaining eighty percent can be attributed
to unknown, one or more of the other twelve variables, or inherent variability. Con-
sequently, no satisfactory single relationship was found. Furthermore, these thirteen
indicators are highly correlated - mathematically and in terms of content. For example
the distance to an ICE train station and to the city center (town hall) are strongly related
as both analyzed cities have an ICE train station close to the city center. Similarly, a
UMTS affine area is also high-tech affine and vice versa. To overcome this, a multiple
regression must be applied which takes the interdependencies into account.
Since there are no more or less meaningful regression models, all potential combi-
nations have to be tested and an exploratory regression is applied. Exploratory regres-
sion tries all possible combinations of explanatory variables to see which models pass](https://image.slidesharecdn.com/6e07fbad-1fc9-4865-930b-b3b2597817b7-150708184002-lva1-app6891/85/Seign_Dissertation-75-320.jpg)
![60 CHAPTER 3. THEORETICAL AND EMPIRICAL BACKGROUND
all of the predefined ordinary least squares (OLS) diagnostic parameters. This method
is similar to stepwise regression but rather than only looking for models with high R2
values, exploratory regression looks for models that meet all of the requirements and
assumptions of the OLS method. [74] The selection criteria were that the model must
have one to five explanatory variables and an adjusted coefficient of determination (R2)
>0.3. The Adjusted R2 ( ¯R2), is used in multiple regression to adjust R2 downwards de-
pending on the number of independent variables since simply adding more variables
can raise R2. It was further specified, that the coefficient’s p-value (p-value <0.05 →
coefficient is supposed to be statistically significant), the p-value of the F-statistic (p-
value <0.05 → indicates overall model significance) and the VIF (Variance Inflation
Factor) value (VIF <7.5 → explanatory variables are not redundant) meet the defined
criteria.
As a result of this step, the following model appeared:
bdi = x+ pdi +rdi +thdi +ri ∀i (3.1)
• bdi is the booking density of segment i
• pdi is the population density of segment i
• rdi is the restaurant and hotel density of segment i
• thdi is the distance from segment i to the city center of the considered city
• ri is the index of the rent of segment i
With an Adjusted R2-value of 0.43 this model explains 43 percent of the varia-
tion in booking density through the independent variables which is very good. For
field research and empirical data, already 20-30% rank as good result. [176] The re-
maining 57 percent can be attributed to randomness, unknown variables, or inherent
variability. [196] Table 3.4 gives a model summary and also shows that the model has
a standard error of estimate (Sy,x) of 3260.36, which is the square root of the mean
squared error, or MSE. [22]
Model Summary
b
Model R R Square
1 ,653
a
,426 ,425 3260,356216
a.
b.
Table 3.4: Model Summary](https://image.slidesharecdn.com/6e07fbad-1fc9-4865-930b-b3b2597817b7-150708184002-lva1-app6891/85/Seign_Dissertation-76-320.jpg)
![3.4. WHAT INFLUENCES SUCCESS? 61
Table 3.6 shows the ANOVA (Analysis Of Variance) table for the regression. There
are two sums of squares - the regression and residual (or error) sums of squares. The
variance of the residuals (or errors) is the value of the mean square error or MSE - here
it is 10,629,922.658. Compared to the variance of booking density of 18,490,217.18
(see descriptive statistics of booking density in table 3.5), scattering is reduced by the
factor 1.74.
N Min. Max. Mean Std. De-
viation
Variance
Booking
Density
2126 25.01 36,069.05 5,177.61 4,300.03 18,490,217.18
Table 3.5: Descriptive Statistics
The ANOVA table (3.6) also shows the F test. Here, the hypothesis is tested, that
the independent variables show no relationship to booking density. For this model, the
value of the F test is F(4, 2121) = 393.833 and the table shows that this is significant
(p <.001) and it can be determined that the model provides a significantly better pre-
diction than the mean value. Hence, the overall model is significant [232] and booking
density is related to population density, rent index, town hall (city center) distance, and
restaurant and hotel density.
ANOVA
a
Model df Mean Square F Sig.
1 Regression
Residual
Total
16745645555 4 4186411389 393,833 ,000
b
22546065958 2121 10629922,66
39291711514 2125
a.
b.
Table 3.6: ANOVA (Analysis Of Variance) Table
Table 3.7 gives information about the coefficients of the model. With this informa-
tion the unstandardized regression model appears as:
bdi = −3793.239+0.132pdi +8.343rdi −0.677thdi +7987.185ri ∀i (3.2)
The unstandardized coefficients or slopes can be interpreted the following way:
One meter increase in distance from the town hall reduces booking density by 0.677](https://image.slidesharecdn.com/6e07fbad-1fc9-4865-930b-b3b2597817b7-150708184002-lva1-app6891/85/Seign_Dissertation-77-320.jpg)
![62 CHAPTER 3. THEORETICAL AND EMPIRICAL BACKGROUND
bookings per square kilometer. The standardized or beta coefficients tell that rent index
is the most powerful independent variable in this multivariate analysis, followed by
town hall distance, population density, and lastly restaurant and hotel density.
Coefficients
a
Model
Unstandardized Coefficients
tB Std. Error Beta
1 (Constant)
PopulationDensity
RentIndex
TownHallDistance
RestaurantHotelDensity
-3793,239 515,443 -7,359 ,000
,132 ,008 ,293 17,109 ,000
7987,185 431,658 ,324 18,504 ,000
-,677 ,036 -,314 -18,685 ,000
8,343 ,788 ,193 10,593 ,000
Coefficientsa
Model Sig.
1 (Constant)
PopulationDensity
RentIndex
TownHallDistance
RestaurantHotelDensity
,000
,000
,000
,000
,000
a.
Seite 1
Table 3.7: Model Coefficients
Next, table 3.7 shows the t tests for the slope and intercept, examining the hypoth-
esis H0 : β = 0 for each independent variable used. Here again, the null hypothesis can
be rejected and all variables and the constant are statistically significant (p <0.001).
Finally, the assumption that the residuals are independent, normally distributed,
and that they have equal variances for any x value, must be checked. The normal
plot in figure 3.20 reveals however, that the residuals are not fully normal distributed
and the model is slightly biased. It is likely that other independent variables could
explain more variation in the data. [22] However, they are unknown or might not be
measurable.
3.4.6 Analysis Results
In summary and as a result of this analysis step, the quantitative analysis reveals that
booking density as manifestation of ”success” within a city is dependent on local val-
ues of rent (positive relationship - the higher the rent, the higher the booking density in](https://image.slidesharecdn.com/6e07fbad-1fc9-4865-930b-b3b2597817b7-150708184002-lva1-app6891/85/Seign_Dissertation-78-320.jpg)
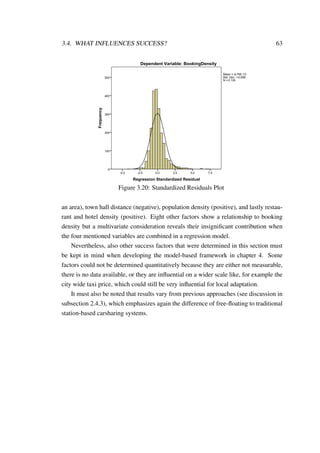
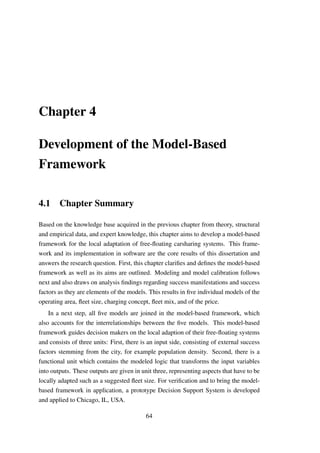
![4.2. DEFINITION, SCOPE AND AIMS 65
4.2 Definition, Scope and Aims of the Model-Based
Framework
When developing a model-based framework, it must be understood what is meant with
this term. First, ”model” should be defined. In literature, this term is used and defined
in numerous ways including ”a standard or example for imitation or comparison”, ”a
pattern or mode of structure or formation”, and ”a simplified representation of a sys-
tem or phenomenon, as in the sciences or economics, with any hypotheses required
to describe the system or explain the phenomenon”. [238] On the basis of functional,
structural or behavioral similarities to an original, a model is used to solve problems
which cannot be solved with the original as this would be too complex or even impos-
sible. [96]
In this research certain aspects of carsharing systems are modeled, hence represent-
ing a standard for the imitation of real-life pattern in a simplified way. For example,
the operating area for free-floating carsharing can be determined through a model, sim-
plifying reality through focus on key influencing aspects. The model imitates reality’s
relationships of these factors with the operating area, and sets a standard for a vari-
ety of cases and environments. In other words, this model brings the complexity of
reality in a simple equation which can be applied in a variety of settings, rather than
expensively trying out different operating areas city by city. Accordingly, key aspects
of carsharing systems that have to be locally adapted must be modeled.
In section 3.2 it is extensively analyzed which aspects of free-floating carsharing
systems should or must be locally adapted, even though in general it is found that
standardization is sought wherever possible. The qualitative discussion gives valuable
input for companies on what to adapt locally. There is a wide variety of locally adaptive
elements that have to be considered but as a result of the discussion, five aspects need
further investigation and modeling: the operating area, fleet size, charging concept,
fleet mix, and the price.
These individual models will then be joined in a framework and therefore a model-
based framework is developed. A framework is ”a structural plan or basis of a project”
or ”a structure or frame supporting or containing something.” [237] For example, in
computer systems, ”a framework is often a layered structure indicating what kind of
programs can or should be built and how they would interrelate”. [189] In the case of
this research, it is not computer programs that are contained in a framework but the
five individual models that are developed. The framework structures them and brings](https://image.slidesharecdn.com/6e07fbad-1fc9-4865-930b-b3b2597817b7-150708184002-lva1-app6891/85/Seign_Dissertation-81-320.jpg)
![66 CHAPTER 4. DEVELOPMENT OF THE MODEL-BASED FRAMEWORK
them in interrelation.
The objective of the model-based framework is to enable and support decision
makers when adopting free-floating carsharing systems to local markets. To do so, the
framework must depict critical and important aspects to support decision makers who
work in reality with its full complexity. People are unable to process all information
and therefore it is crucial to know what is important in order to monitor and adapt it.
Adopted from Bogenberger, who defined ”ideal” characteristics for a ramp meter-
ing strategy [28], the following set of main features for the model-based framework is
derived:
• FOUNDATION: The framework should be based on theoretical foundations and
hence on reasonable assumptions and objectives, rigorous problem formulation,
and efficient and accurate solution methods. This is ensured through research
design in section 2.6 and this section.
• SUPPORT: Its main aim is to give support in the local adaptation of free-floating
carsharing systems by providing decision-makers with an understanding of the
environmental context and the consequences of their actions. Therefore, also an
input validation or plausibility check should be included, giving feedback on the
sensitivity of the decision made.
• ADJUSTMENT: Easily adjustable since factors and parameters will change over
time and must be updated to keep models up-to-date and refine them.
• OPERABILITY: The implementation of the model-based framework at carshar-
ing providers must be possible without extensive costs, training and computing
efforts.
• COLLECTABILITY: The input data for the framework must be collectable with-
out extensive primary research efforts. Therefore, it must be objective and quan-
tifiable standard secondary data that is used as input for the models.
• TRANSFERABILITY: The basic structure of the framework must fit any car-
sharing provider and market.
• VERSATILITY: It must be assured that the framework can be used for electric
free-floating carsharing as well as with conventional vehicle carsharing.
• DYNAMIC: It should show how changes within a city affect the carsharing sys-
tem dynamically (new input data = new results).
• APPLICABILITY: The framework must be applicable to existing markets in
order to optimize them according to the research and for new markets to plan for
launches in new cities.](https://image.slidesharecdn.com/6e07fbad-1fc9-4865-930b-b3b2597817b7-150708184002-lva1-app6891/85/Seign_Dissertation-82-320.jpg)
![4.3. MODELING LOCALLY ADAPTIVE ASPECTS 67
On the contrary, it is not aimed by the model-based framework to automatically
compute definitive answers on how to locally adapt a free-floating carsharing system.
The environment is changing constantly and there is an always changing and unpre-
dictable number of ”soft” factors which must be considered when determining the local
shape of a system - for example the presence of local partners, the business policy of a
company, local politics and many more. To take this need for flexibility into account,
the framework is considering ”soft” key issues that must always be considered and
prescribes a qualitative alignment of some aspects.
A summary of this chapter was also submitted for the 2015 TRB Annual Meet-
ing [208].
4.3 Modeling Locally Adaptive Aspects
4.3.1 Operating Area
The first aspect of free-floating carsharing systems that has to be determined and hence
the first element of the model-based framework is the operating or business area. The
operating area is the key element of a free-floating carsharing operation as it defines the
geographic and to a wide extent also the demographic target market. For customers,
the definition of a ”right” operating area is decisive for whether and how often they use
the system, as section 3.4 revealed. Therefore, in theory, a larger operating area leads
to a higher number of customers, bookings, and potentially longer booking durations.
In reality however, operating areas cannot be arbitrarily large since the number of cars
would grow uneconomically to ensure availability and vehicle distribution could be-
come highly complex. The joint character of carsharing limits the flexibility to certain
areas, as the car has to be picked up from a location within the operating area, where
the previous user parked it. Consequently, there must be a sufficiently high probability
that the car will be picked up from another user within short time. Only then the con-
cept can be economic and realize positive ecological effects since a parked carsharing
vehicle does not contribute in solving traffic problems and is a waste of resources. As
a result, determining an optimal operating area depends on an a priori prediction of
potential booking hot-spots within an urban area.
The possibility to designate an operating area and accordingly the possibility to
offer free-floating carsharing hinges on the question regarding the possibility whether
on-street parking is sufficiently available or not. In most cases, local authorities will](https://image.slidesharecdn.com/6e07fbad-1fc9-4865-930b-b3b2597817b7-150708184002-lva1-app6891/85/Seign_Dissertation-83-320.jpg)
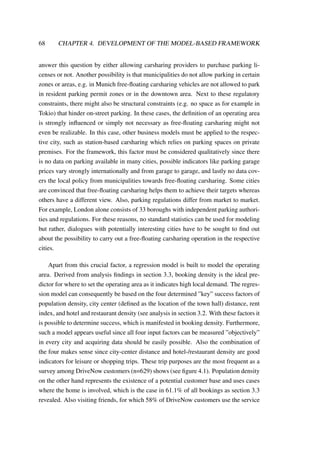
![4.3. MODELING LOCALLY ADAPTIVE ASPECTS 69
as figure 4.1 shows, is covered by this factor. Finally, rent is an indicator for mixed use
in an area. Pure residential areas potentially have higher booking rates in the morning,
early evening and on the weekend whereas pure nightlife areas with many restaurants
will not have many bookings during the day but many at night. The combination of
both is hence ideal. Furthermore, areas with higher rents can be considered more at-
tractive and the carsharing target group of young urban early adopters are likely to live
in these areas.
4%
23%
27%
29%
35%
44%
58%
64%
0% 10% 20% 30% 40% 50% 60% 70%
Other
Business trips
Private trips out of the city
Commuting to and from work
Shopping for daily needs (food etc.)
Shopping for occasional needs (furniture,
etc.)
Visisting friends
Go for a night out, leisure activities
Figure 4.1: Survey: Trip Purposes of DriveNow Users [26]
In order to develop the regression model for the derivation of the operating area,
two major variations to the previously determined model in section 3.4.5 must be con-
sidered. First, to ensure transferability to a variety of cities worldwide, it is important
to relativize all success factors. For example, cities vary greatly in their size. In a
big city, a segment that is 8,000 meters from the city center might be still very central
whereas in a small city this could already be beyond the city borders. To relativize
the factors, indices for each success factor must be calculated, comparing for each seg-
ment the absolute value of a factor. For example, a 8,000m city center distance must be
compared with the average value of a factor within the analyzed city, e.g. an average
city center distance of 9,500m over all segments. To generalize, let xit be the value of
an explanatory (success) factor i in segment t of an observed city. Then the index pit
is derived the following way:
pit :=
xit
¯xi
∀i (4.1)
where ¯xi = 1
T ∑T
t=1 xit is the average of the explanatory variable i in the observed](https://image.slidesharecdn.com/6e07fbad-1fc9-4865-930b-b3b2597817b7-150708184002-lva1-app6891/85/Seign_Dissertation-85-320.jpg)
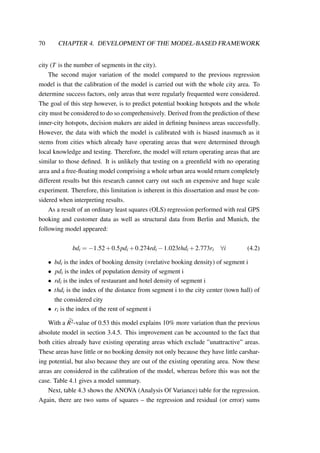
![4.3. MODELING LOCALLY ADAPTIVE ASPECTS 71
Model Summary
b
Model R R Square
Adjusted R
Square
Std. Error of
the Estimate
1 ,728a
,530 ,529 1,245937908
Predictors: (Constant), RelRent, RelPopDensity, RelHotelRestDensity, RelTownHallDistancea.
Dependent Variable: RelBuDib.
Page 1
Table 4.1: Model Summary
of squares. The variance of the residuals is the value of the mean square error or
MSE and amounts to 1.552. Compared to the variance of booking density of 3.298
(see descriptive statistics of booking density in table 4.2), scattering is reduced by the
factor 2.13.
N Min. Max. Mean Std. De-
viation
Variance
Relative
Booking
Density
5,571 0 19.81 1 1.81 3.298
Table 4.2: Descriptive Statistics
Also in the ANOVA table the F test can be found, testing the hypothesis that the
independent variables show no relationship to booking density. For this model, the
value of the F test is F(4, 5566) = 1,566.504 and the table shows that this is signifi-
cant (p <.001) and it can be determined that the model provides a significantly better
prediction than the mean value. Hence, the hypothesis can be rejected and the overall
model can be regarded as significant. [232] As a result, the index of booking density
is related to the indices of population density, rent, city center distance, and restaurant
and hotel density.
ANOVA
a
Model
Sum of
Squares df Mean Square F Sig.
1 Regression
Residual
Total
9727,118 4 2431,780 1566,504 ,000b
8640,443 5566 1,552
18367,561 5570
Dependent Variable: RelBuDia.
Predictors: (Constant), RelRent, RelPopDensity, RelHotelRestDensity, RelTownHallDistanceb.
Table 4.3: ANOVA (Analysis Of Variance) Table](https://image.slidesharecdn.com/6e07fbad-1fc9-4865-930b-b3b2597817b7-150708184002-lva1-app6891/85/Seign_Dissertation-87-320.jpg)
![72 CHAPTER 4. DEVELOPMENT OF THE MODEL-BASED FRAMEWORK
Information about the coefficients of the model can be found in table 4.4. While the
unstandardized coefficients are part of the model equation, the unstandardized coeffi-
cients or slopes can be interpreted the following way: 1 index point increase in distance
from the city center reduces the index of booking density by 0.298. In general, these
indices can be interpreted as percentages, e.g. a rent index of 0.5 indicates that the rent
in this segment is only 50% of the average rent in the respective city. Consequently,
the arithmetic mean of all segments of a city is always 1. Also, the standardized or
beta coefficients tell that the index of the distance to the city center is the most power-
ful independent variable in this model, followed by the indices of restaurant and hotel
density, rent, and lastly population density.
Coefficients
a
Model
Unstandardized Coefficients
Standardized
Coefficients
t Sig.B Std. Error Beta
1 (Constant)
RelPopDensity
RelHotelRestDensity
RelTownHallDistance
RelRent
-1,520 ,129 -11,766 ,000
,500 ,027 ,200 18,286 ,000
,274 ,010 ,297 27,594 ,000
-1,023 ,038 -,298 -27,224 ,000
2,773 ,107 ,261 25,939 ,000
Dependent Variable: RelBuDia.
Table 4.4: Model Coefficients
Furthermore, table 4.4 shows the t tests for the slope and intercept, examining
the hypothesis H0 : β = 0 for each independent variable used. Here again, the null
hypothesis can be rejected and all variables and the constant are statistically significant
(p <0.001).
As a final check of the model, the assumption that the residuals are independent,
normally distributed, and that they have equal variances for any x value must be ex-
amined. As expected, just like in the previous regression model in section 3.4.5, the
normal plot reveals that the residuals are not fully normal distributed (see figure 4.2)
and the model is slightly biased, making it likely that other independent variables could
explain more variation in the data [22] but they are still unknown or might not be mea-
surable.
This model can be used for free-floating carsharing with conventional vehicles as
well as with electric vehicles. It must be noted however, that this model does not con-
tain one key aspect of carsharing with electric vehicles - charging infrastructure. Cur-
rently, there is no comprehensive available dataset which could have been included in](https://image.slidesharecdn.com/6e07fbad-1fc9-4865-930b-b3b2597817b7-150708184002-lva1-app6891/85/Seign_Dissertation-88-320.jpg)
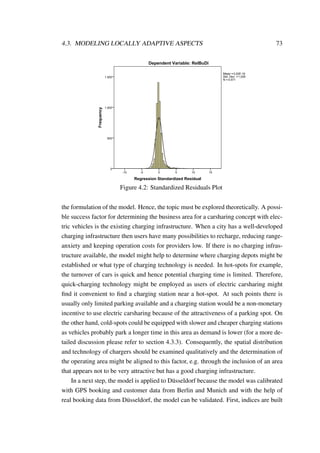
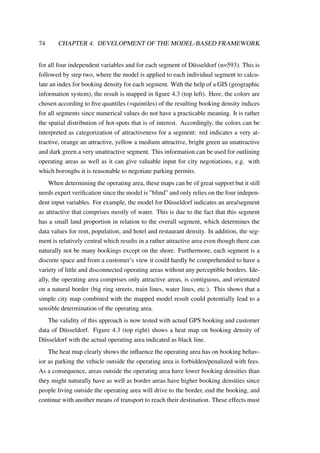
![4.3. MODELING LOCALLY ADAPTIVE ASPECTS 75
be accepted however, since there is no data on what would be without a predefined
operating area.
The comparison of the modeling result with actual booking data reveals a high vi-
sual conformity regarding the rough border of an operating area. However, there are
also clear deviations, as indicted in figure 4.3 on the bottom, which depicts the model
residual. However, most can be explained when looking at a city map. Segments
with high shares of water (as previously explained), parks, or industrial areas were
indicated more attractive than in reality because they mostly also had smaller residen-
tial/recreational areas that determined data values regarding rent and restaurant density.
The highest deviation with more than 10 standard deviations occurred in the city center
in an area known as the ”longest bar in the world”. [259] Logically, the model assigns
this area a very high attractiveness; however, it is a pedestrian zone and no cars can
enter the area for which reason there are no bookings in reality. This again shows the
limitations of the model and the need for expert evaluation of the results. Nevertheless,
the model proved its high applicability as deviations (over- and underestimations of the
model) occur mainly within hot-spot areas. This does not influence the determination
of a business area because the absolute forecast (or the level of relativity) of the book-
ing density is indifferent for this decision. Areas with standard deviations >0.25 that
are outside of the actual business area can again be explained through segments with a
high share of water, parks, and industrial areas.
Furthermore, also a cross-evaluation was conducted. In the development, the model
was calibrated with GPS booking and customer data from Munich and Berlin and in
cross-evaluation, the model is calibrated first with data from D¨usseldorf and Munich
and second with data from D¨usseldorf and Berlin. Even though there was a shorter
period in which actual booking data was collected in D¨usseldorf, as a result, the model
proved to be very stable. Both cross-evaluations returned similarly high ¯R2-values with
significant overall models and significant coefficients.
To evaluate the model’s overall validity further, it was applied to Hamburg in order
to examine whether it is also applicable to other free-floating carsharing providers, here
namely car2go. Since there is no booking data from car2go, only the actual business
area of car2go is considered which is freely available on the provider’s website. Car2go
is present in Hamburg for more than two years [67] at the time of this research and since
its launch the operating area was expanded four times [58] and hence grew organically
according to the local experience which was made. Thus, the actual operating area
can be considered as mature. The result of the model’s application to Hamburg can be](https://image.slidesharecdn.com/6e07fbad-1fc9-4865-930b-b3b2597817b7-150708184002-lva1-app6891/85/Seign_Dissertation-91-320.jpg)
![76 CHAPTER 4. DEVELOPMENT OF THE MODEL-BASED FRAMEWORK
seen in figure 4.4. It shows, that the modeled results have a good fit with the actual
operating area. Major overestimations were made south of the actual operating area
where there is mostly indutry and a harbor and west from the operating area, which is
an exclusive residential area and car2go might have decided that no sufficient demand
can be expected in this area (e.g. due to the use of simple smart vehicles that might not
attract wealthy customers).
Overall, the evaluation of the developed regression model for the determination
of the operating area for free-floating carsharing systems shows positive results. The
model appears very useful for its purpose when it is applied with common sense. Con-
sidering more data, e.g. trafficability, would mean gathering primary data and therefore
high efforts and expenses. This could lead to more accuracy but it is opposed to the
aimed features of the model-based framework and most likely not worth the effort in
reality, since the operating area will be planned by experts with at least some degree of
simple verification of the results, e.g. with a city map or through local inspection.
A summary of this section was also presented at the 2nd Symposium of the Eu-
ropean Association for Research in Transportation (hEART [209] as well as it was
submitted for the Research in Transportation Economics journal [210].](https://image.slidesharecdn.com/6e07fbad-1fc9-4865-930b-b3b2597817b7-150708184002-lva1-app6891/85/Seign_Dissertation-92-320.jpg)
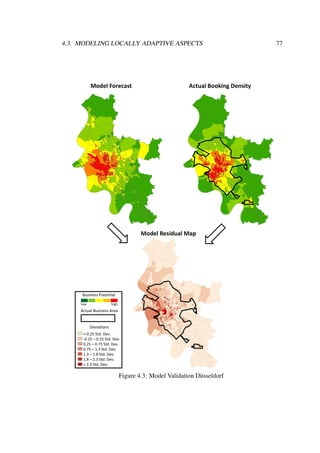
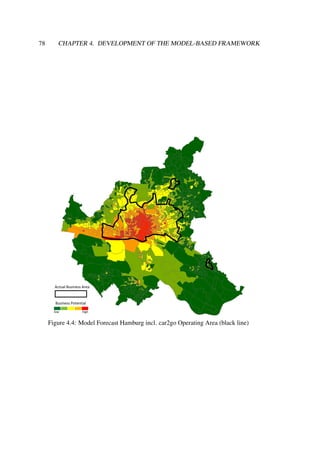
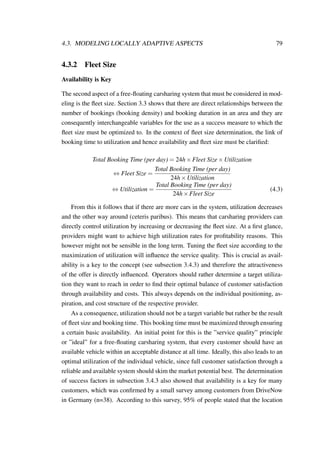
![80 CHAPTER 4. DEVELOPMENT OF THE MODEL-BASED FRAMEWORK
of the car is important, whereas only 27% are interested in the type of the vehicle. [21]
Furthermore, without an offer (a car) there can be no bookings.
Availability would ideally be defined as the percentage of potential customers who
look for a car and successfully find one. Unfortunately, it is unknown how many
potential or interested customers there are. A possible solution could be to compare
the number of queries through the smartphone application with the number of actual
bookings but this data appeared to be randomly distributed and not related to booking
data and accordingly, no conclusions could be drawn from it. Adopted from Barrios
”patch-based-availability” [20, 19, 18], another approach is to define availability as
spatial coverage of the service within the operating area. Here, availability represents
the ratio of the area served to the total operating area. The area served is understood
as the walking area around a car because only if potential customers are within this
walking area, they will end up booking a car. Otherwise, potential customers will
choose a different mode of transportation. Since the operating area should be defined
as attractive area, providers can expect demand everywhere in this area as well as
customers expect to be served within this area. Therefore, the spatial coverage of the
service appears as a very suitable measure for availability and service quality.
The acceptable walking area depends on an individuals’ willingness to walk and
naturally fewer cars are needed when people are willing to walk longer to reach one.
Car2go states from experience that the concept does not work with fewer than four cars
per square kilometer [154] which corresponds with the limitation of DriveNow and
car2go to reserve cars 15 minutes in advance only as well as with experts’ who widely
agree that people are not willing to walk more than 5-10 minutes (see subsection 3.4.3
and [66]). In a city, five minutes of walking translate to a traveled beeline of roughly
250 meters on the map due to traffic lights, turning, etc. [222] This 250 meter radius
around each car as vehicle-specific ”commuting area” or ”walking circles”, translates
in turn to 5 vehicles/km2 and is therefore consistent with the statement of car2go, being
a slightly more ”pessimistic” assumption. Since this fosters customer satisfaction and
hence the diffusion of the concept, 250m appear as good general indicator.
Input-Variable Operating Area
Considering these walking areas around each car, the fleet size can be easily deter-
mined when knowing the size of the operating area because the bigger the area the
more cars are needed to ensure availability. The extent of the operating area can be
determined with the previously developed regression model through summarizing all](https://image.slidesharecdn.com/6e07fbad-1fc9-4865-930b-b3b2597817b7-150708184002-lva1-app6891/85/Seign_Dissertation-96-320.jpg)

![82 CHAPTER 4. DEVELOPMENT OF THE MODEL-BASED FRAMEWORK
0
50
100
150
200
250
300
350
400
0%
10%
20%
30%
40%
50%
60%
70%
80%
90%
100%
00 01 02 03 04 05 06 07 08 09 10 11 12 13 14 15 16 17 18 19 20 21 22 23
ExpectedUtilization[#cars]
ExpectedUtilization[%]
Time Period
Target
Utilization
Weekday
Weekend
Figure 4.6: Typical Utilization Curve for Weekdays and Weekends
but until saturation is reached, the number of customers will grow and so will the num-
ber of bookings. Having a fixed number of cars, utilization will grow accordingly and
every utilized vehicle is a potential gap in availability as it takes vehicles out of the
system, leaving behind a gap for other potential customers. This is illustrated through
the red gap in figure 4.7.
Figure 4.7: Illustration of a Simplified Approach to Determine the Fleet Size: A
Utilized Vehicle Leaves an Availability-Gap
In this definition of utilization, the technical availability of the vehicles must be
included as well because a certain part of the fleet is constantly not available due to
maintenance, service blocks, refueling through the provider, charging times (which
depend on the charging concept and technology, see also subsection 4.3.3 and 4.3.4),
and technical problems among many other things.
As a result, there must be enough cars to allow for utilization whilst ensuring avail-
ability (=service quality) at the same time:
Fleet Size = Number of cars to fulfill the willingness to walk∗(1+Utilization)
Further, utilization is a variable to which the number of cars has to be adapted
to constantly to keep utilization at the same level whilst the customer base grows.
Ideally, providers could constantly increase the fleet size and start with a utilization of](https://image.slidesharecdn.com/6e07fbad-1fc9-4865-930b-b3b2597817b7-150708184002-lva1-app6891/85/Seign_Dissertation-98-320.jpg)
![4.3. MODELING LOCALLY ADAPTIVE ASPECTS 83
0% to realize the maximum saving potential. Figure 4.8 illustrates this exemplary for
a fleet size of 403 cars at a target utilization of 15% and an assumed constant customer
behavior. The red line shows the increasing fleet from 0% utilization until 15% target
utilization is reached. Alternatively and depicted by the blue line, providers could start
with their target utilization configuration of the fleet size, keep it constant and once the
target utilization is reached, increase the fleet to keep utilization at this level.
0
100
200
300
400
500
600
700
800
900
1,000
0
10,000
20,000
30,000
40,000
50,000
60,000
70,000
80,000
90,000
100,000
110,000
120,000
130,000
140,000
150,000
160,000
170,000
180,000
190,000
200,000
FleetSize
Number of customers @ 4 bookings á 30min per customer and month
Fleet Size
Saving Potential
Figure 4.8: Illustration of the Continuous Adaption of the Fleet Size to Customer
Growth
Input-Variable Spatial Coverage
As previously mentioned, this determination only works under the assumption of a
uniform distribution of vehicles - an assumption that is not realistic and the equa-
tion above will not lead to 100% availability as suggested. To some degree this is
acceptable or even good, since the spatio-temporal demand is not equally distributed
either. However, an unequal distribution reduces availability at some points as illus-
trated in figure 4.9. To avoid this, relocation strategies might be applied (see for exam-
ple [255, 254, 20, 19, 130]). The basis for these strategies must be an accurate forecast
of demand and an optimization of potential earnings and transfer costs. Ideally, there
are only as many cars in the system as utilized by customers and a ”perfect” reloca-
tion strategy ensures 100% availability at the same time. Since demand is unknown a
further potential solution could lie in setting a side condition to not only transfer cars
to demand hot spots but also to assure spatial coverage throughout the operating area.](https://image.slidesharecdn.com/6e07fbad-1fc9-4865-930b-b3b2597817b7-150708184002-lva1-app6891/85/Seign_Dissertation-99-320.jpg)
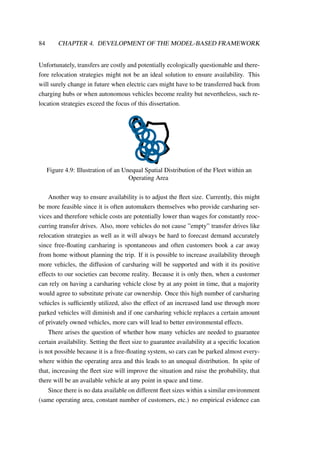
![4.3. MODELING LOCALLY ADAPTIVE ASPECTS 85
be found on the effect of different fleet sizes on availability. To close this knowledge
gap, a simulation-based approach is chosen. The goal of the simulation is to replicate
the real world spatio-temporal vehicle distribution in order to be able to try out dif-
ferent combinations of fleet sizes and utilizations in the simulation environment. The
results of these different combinations are different values for the availability or spa-
tial coverage of the service within the business area, which was defined as the ratio of
the area served to the total operating area. With the data gained from this simulation,
providers can see which respective vehicle density results from their choice of spatial
coverage and utilization targets.
The implementation of this simulation is executed in NetLogo, which is an agent-
based programming language and programmable modeling environment. [261] In fig-
ure 4.22 a screenshot of the simulation model can be found .
Calibration and validation of the simulation is based on real booking GPS booking
and customer data of a free-floating carsharing system because it is considered im-
portant to accurately reflect the spatio-temporal changes in vehicle distribution in the
simulation as real (served and unserved) spatio-temporal demand is unknown.
The parameterization and calibration of the simulation is based on an average day
in Munich and to reflect vehicle distributions, origins, and destinations accurately, in-
ner Munich was divided in 10 zones based on traffic cells (see figure 4.10).
40%
Share of total
bookings
30%
15%
5%
10%
Figure 4.10: Heatmap of Munich in 33x33 Meter Patches for Simulation Calibration
(Left) and Division of Munich in 10 Zones for Simulation Calibration (Right)
For each full hour between 6:00 am and 11:00 pm the number of cars in each zone
was counted as well as the number of bookings that followed in the respective hour
(e.g. no. of bookings in zone 1 from 6:00 to 6:59 am). This data is the basis for the](https://image.slidesharecdn.com/6e07fbad-1fc9-4865-930b-b3b2597817b7-150708184002-lva1-app6891/85/Seign_Dissertation-101-320.jpg)
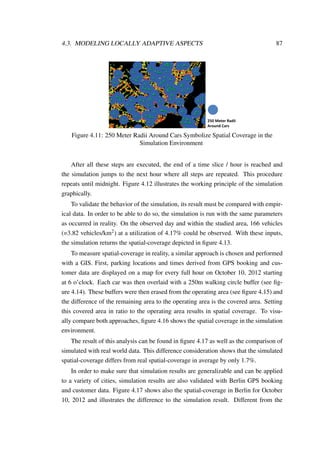
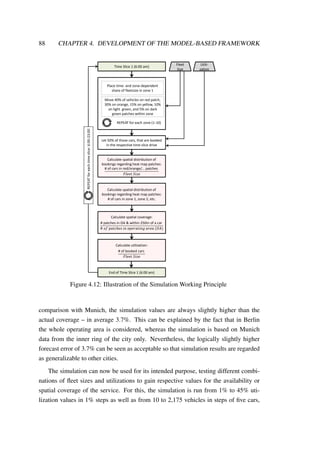
![4.3. MODELING LOCALLY ADAPTIVE ASPECTS 89
0.0%
10.0%
20.0%
30.0%
40.0%
50.0%
60.0%
70.0%
80.0%
90.0%
100.0%
6 7 8 9 10 11 12 13 14 15 16 17 18 19 20 21 22 23
SpatialCoverage
Figure 4.13: Validation: Simulated Spatial Coverage for Munich
equaling to vehicle densities from 0.23 to 50 vehicles per square kilometer. This results
in 19,530 combinations of utilization and fleet size respectively vehicle densities and
therefore in 19,530 simulation runs. To illustrate this, an example is given in table 4.5
as well as figure 4.18 shows the relationship of fleet size and spatial coverage at an
exemplary utilization of 15% in an operating area of 100 km2.
Run Number Target Utiliza-
tion
Corresponding
Vehicle Den-
sity [Veh./km2]
Resulting Spa-
tial Coverage
1,476 15% 5.75 49.9%
1,477 16% 5.75 48.7%
1,478 15% 6 51.3%
1,479 15% 5.5 47.9%
... ... ... ...
Table 4.5: Exemplary Extract of the Simulation Result Table
It can be seen that coverage is a logarithmic function of the vehicle density. The
curve will vary depending on the chosen utilization as well as the fleet size depends
on the operating area. In any city there will be parks, non-parking zones, water areas,
etc. for which reason it is not possible to achieve 100% coverage, unless such areas are
completely cut out of the operating area which however leads to customer confusion](https://image.slidesharecdn.com/6e07fbad-1fc9-4865-930b-b3b2597817b7-150708184002-lva1-app6891/85/Seign_Dissertation-105-320.jpg)
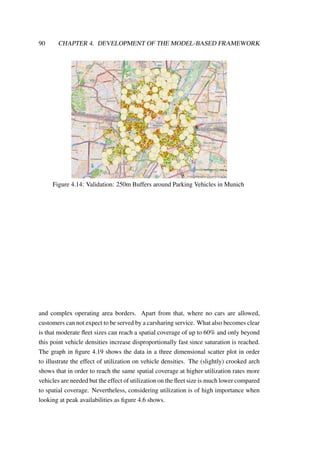
![4.3. MODELING LOCALLY ADAPTIVE ASPECTS 91
Figure 4.15: Validation: Simulated Spatial Coverage for Munich Cut Out from the
Operating Area
Utilization [%]50 40 30 20 10 0
SpatialCoverage[%]
100
80
60
40
20
0
Vehicle Density [#/km²]
6050403020100
Figure 4.19: Three Dimensional Scatter Plot on the Relationship of Spatial Coverage,
Vehicle Density, and Utilization.
These simulation results can now be used for the determination of the fleet size.
To stick with the example from table 4.5, a provider could choose a spatial coverage
of 49.9% and a target utilization of 15% and as a result must choose a vehicle density
of 5.75 vehicles per km2. Through the extensive amount of combinations simulated, a
strong database was created from which providers can determine their desired vehicle
density, resulting from their choice of spatial coverage and utilization targets.](https://image.slidesharecdn.com/6e07fbad-1fc9-4865-930b-b3b2597817b7-150708184002-lva1-app6891/85/Seign_Dissertation-107-320.jpg)
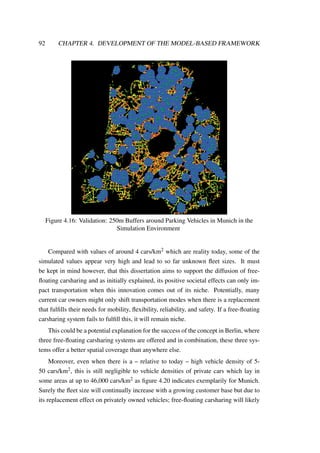
![4.3. MODELING LOCALLY ADAPTIVE ASPECTS 93
-3.0%
-2.0%
-1.0%
0.0%
1.0%
2.0%
3.0%
4.0%
5.0%
6.0%
7.0%
6 7 8 9 10 11 12 13 14 15 16 17 18 19 20 21 22 23
SimulationDeviationMunich
0%
5%
10%
15%
20%
25%
30%
35%
40%
45%
50%
6 7 8 9 10 11 12 13 14 15 16 17 18 19 20 21 22 23
SpatialCoverage
Time @ Oct 10, 2012 in Munich
0%
5%
10%
15%
20%
25%
30%
35%
40%
45%
50%
6 7 8 9 10 11 12 13 14 15 16 17 18 19 20 21 22 23
SpatialCoverage[%]
Time @ Oct 10, 2012 in Berlin
-7.0%
-6.0%
-5.0%
-4.0%
-3.0%
-2.0%
-1.0%
0.0%
6 7 8 9 10 11 12 13 14 15 16 17 18 19 20 21 22 23
SimulationDeviationBerlin
Average Deviation: 1,7%
Average Deviation: 3,7%
Figure 4.17: Validation: Real World Spatial-Coverage in Munich (Top Left) and
Berlin (Top Right) and the Respective Simulation Deviations (Below).
decrease the overall vehicle densities in cities.
As a result, combined with inputs on the respective size of the operating area, the
fleet size for any given city can be determined and the following model can be derived:
Fleet Size = Area of the Operating Area[km2]∗Desired Vehicle Density[Vehicles
km2 ]
Here, the desired vehicle density is connected to utilization and spatial coverage values
that must be chosen by providers. Rather than being expressed by a function, this relationship
is manifested in simulation results as described above.
To evaluate this approach with real data is not possible since it has not yet been
applied, neither is there data on trials with different fleet sizes in reality as mentioned
previously. Furthermore, utilization and technical availability rates are not published.
However, it is known that car2go plans to fleet in 4 cars per square kilometer of op-
erating area. [154] In Berlin, the operating area of car2go comprises 275km2 and the
fleet consists of 1,200 vehicles, [43] which results in 4.34 cars/km2 or 8.5% more than
announced. This is a hint that utilization might have been considered, to which extent](https://image.slidesharecdn.com/6e07fbad-1fc9-4865-930b-b3b2597817b7-150708184002-lva1-app6891/85/Seign_Dissertation-109-320.jpg)
![94 CHAPTER 4. DEVELOPMENT OF THE MODEL-BASED FRAMEWORK
0%
10%
20%
30%
40%
50%
60%
70%
80%
90%
100%
23
173
322
472
610
771
921
1,082
1,197
1,370
1,566
1,669
1,796
1,945
2,107
2,268
2,429
2,648
2,625
2,901
3,028
3,235
3,361
3,488
3,454
3,741
3,753
3,937
4,421
4,294
4,559
4,823
4,708
4,939
SpatialCoverage[%]
Fleet Size @ chosen utilization
Figure 4.18: The Relationship of Spatial Coverage and Fleet Size (Assumptions:
Operating Area: 100km2, 15% Utilization).
is not clear however. Further, it is also unknown whether spatial coverage is considered
by providers or not and it is even less known which service levels are desired.
A validation whether which values for utilization and spatial coverage are ”right” or
”good” is neither possible with empirical data. So far, there have been only relatively
minor alterations of the fleet size as well as the fleet size growth went in hand with
customer growth. Therefore, it is not possible to measure effects of an increased or
decreased fleet size on bookings as well as no saturation (=oversupply of vehicles)
could have been observed.
Another approach is to divide a city into zones, continually measure vehicle den-
sities in those zones and see which effects they have on bookings. Again however,
no relationships can be found and there is no plateau which would represent a perfect
balance of vehicle densities and booking densities in those zones. Figure 4.21 shows
this approach based on Munich GPS booking and customer data from October 2012,
where Munich was divided in 10 zones (see also figure 4.10).](https://image.slidesharecdn.com/6e07fbad-1fc9-4865-930b-b3b2597817b7-150708184002-lva1-app6891/85/Seign_Dissertation-110-320.jpg)
![4.3. MODELING LOCALLY ADAPTIVE ASPECTS 95
Vehicle Density [#/km²]
0-3,000
3,001-6,000
6,001-9,000
9,001-12,000
12,001-15,000
15,001-46,367
Number of cars in Munich:
617,500
Thereof in the DriveNow
operating area:
265,000
Figure 4.20: Private Vehicle Density in Munich
Figure 4.21: The Relationship of Vehicle Density and Booking Density
For the tip of every hour the vehicle density was measured (x-axis) as well as
the number of trips that occurred in the following time slice normalized by the area (y-
axis). The reasons why there are no results of this analysis are multifarious: First, every
zone is different and within a city there are hot- and cold-spots that cannot be compared
in their performance. Second, every time of the day is different and at 3:00am not many
bookings can be expected regardless of the vehicle density. Third, every day behaves
differently, e.g. on Saturdays there are no midday lows. Fourth, also within only one](https://image.slidesharecdn.com/6e07fbad-1fc9-4865-930b-b3b2597817b7-150708184002-lva1-app6891/85/Seign_Dissertation-111-320.jpg)

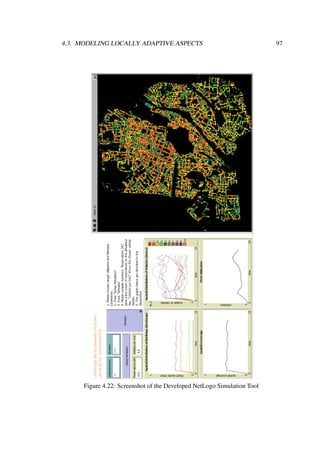
![98 CHAPTER 4. DEVELOPMENT OF THE MODEL-BASED FRAMEWORK
4.3.3 Charging Concept
From a local adaptation perspective, carsharing with electric vehicles mainly differs
from conventional carsharing inasmuch as there is a need to charge the vehicles. This
takes longer than refueling, is potentially more complicated, and must be performed
more often due to shorter vehicle ranges. The higher frequency and duration of charg-
ing also leads to high operational costs for providers. Depending on the local circum-
stances, carsharing providers must find the right charging concept because currently
there is a very limited charging infrastructure compared to the mature gas station net-
work.
Before examining the charging concept, the underlying technology must be out-
lined briefly. There are a variety of charging technologies ranging from conductive
and inductive charging to battery switch systems. Currently, conductive charging (per
cable) is the technological standard and within this technology, there is also a variety
of charging modes which are mainly characterized by their charging power and hence
charging time. A further distinction can be made regarding the use of either alter-
nating current (AC) or direct current (DC) and single-and three-phase systems. [132]
Table 4.6 gives an overview on this matter.
Charging
Mode
Connection Single-phase Three-phase Charging
Time
Mode 1 (AC) Household socket Max. 16A
3.7kW
Max. 16A
11kW
2-6 h
Mode 2 (AC) Charging station,
household socket
Max. 32A
7.4kW
Max. 32A
22kW
1-6h
Mode 3 (AC) Charging station Max. 63A
14.5kW
Max. 63A
43.5kW
30 min
Mode 4 (DC) Charging station
(fixed cable)
DC-Low
max. 38kW
35 min
DC-High
max. 170kW
<15 min
Table 4.6: Charging Modes for Conductive Charging. Adapted from [132]
Based on these different technological solutions, there are also different opera-
tional or organizational solutions (charging concepts) for carsharing providers regard-
ing how and where to charge. Here, it must be distinguished between centralized and
decentralized charging concepts. [29] Currently, in free-floating carsharing centralized
concepts involve charging depots (e.g. parking houses with charging stations) where](https://image.slidesharecdn.com/6e07fbad-1fc9-4865-930b-b3b2597817b7-150708184002-lva1-app6891/85/Seign_Dissertation-114-320.jpg)
![4.3. MODELING LOCALLY ADAPTIVE ASPECTS 99
the provider collects vehicles to charge them, e.g. overnight or when the state-of-
charge drops below a predefined number. An example for this is car2go in San Diego
where a depot is operated. In this depot, 30 cars can be charged simultaneously. [137]
In future, this could furthermore involve charging infrastructure which is installed in
company parking houses (being underutilized at night), hotels (being underutilized
during the day), shopping centers, park+ride garages, etc. which could enable cus-
tomer involvement also for central concepts, e.g. in combination with a valet parking
service. [29, 205] On the other hand, decentralized concepts already involve the cus-
tomer who is incentivized to use public (on-street) charging infrastructure when ending
a booking as for example it is practice at DriveNow [159] or Multicity [165] in Berlin.
Here, charging by the fleet management should be the exceptional case and also relies
on decentralized public charging infrastructure.
Charging technology and concept are logically connected. A faster charging tech-
nology means higher vehicle availability, lower opportunity costs, but also more in-
frastructure costs which might not always be necessary, e.g. charging over night when
demand is low. This would most likely be the case in most central charging concepts
and consequently, mode 1 or 2 technology should be sufficient. This however must be
adapted to actual demand as more vehicles would be necessary to compensate charg-
ing times in case charging cannot only be performed in times of low utilization. For
decentralized concepts carsharing providers will probably not determine the employed
technology but rather make use of an existing infrastructure. Investing in an exclusive
public infrastructure is economically not feasible and politically unrealistic since the
infrastructure would be built on public space. Ideally however, areas with long park-
ing times (e.g. in residential areas at night) would be sufficiently supplied by mode 2
charging technology whereas in booking hotspots or areas with a quick turnover (high-
way rest stops, shopping centers, restaurant areas, traffic hubs) mode 3 or 4 might be
economically feasible. [205]
Having laid this background, carsharing providers must adapt their charging con-
cept to the given environment to ensure the optimum of customer comfort and reason-
able efforts (hence: costs) for the provider. Ideally, customers do not want to have
any hassle and simply leave the car wherever they want without performing any duty.
The ideal world from a provider’s point-of-view is the contrary, customers charge the
vehicles regularly themselves and no expensive fleet management action is needed.
Combining both ideals could work best in an environment with a high number of](https://image.slidesharecdn.com/6e07fbad-1fc9-4865-930b-b3b2597817b7-150708184002-lva1-app6891/85/Seign_Dissertation-115-320.jpg)
![4.3. MODELING LOCALLY ADAPTIVE ASPECTS 101
on local circumstances is the chosen incentive strategy. Even if there is only a lim-
ited charging station density, high incentives might encourage people to detour and to
utilize stations so much, that the charging challenge can be solved. Experience with
gasoline vehicles shows that there are also people who deliberately pick up cars with
low tank levels to fuel them up and get the incentive. Whether this is a meaning-
ful solution for providers depends on their individual cost structure and whether it is
cheaper to incentivize customers or to transfer vehicles on their own. This strategic
decision does not depend on local circumstance and is therefore not further considered
in modeling.
A consequence from this consideration is that station-density is the clear influen-
tial factor whether (and to which degree) decentralized charging concepts can work.
If a city offers a sufficient density, providers should employ a decentralized charging
concept or at least make use of the public charging infrastructure as much as possible
(e.g. car2go in San Diego incentivizes users to use public chargers and only charges
in its depot when needed similarly to DriveNow in Munich which incentivizes the use
of the merely 8 stations in its operating area). If there is no sufficient public charg-
ing infrastructure, central concepts must be applied. A ”sufficient” public charging
infrastructure however will only be deployed if there is a ”sufficient” amount of elec-
tric vehicles utilizing them. This chicken and egg problem is seen as one of the main
obstacles of electromobility. [190] It must be noted however, that a carsharing provider
who potentially brings hundreds or thousands of electric vehicles to a city might take
an active role in solving the problem and might thus change the environmental settings
actively and be (one of) the reasons why more public chargers are installed.
In a next step it must be determined what a ”sufficient” charging station density is.
The term is defined as follows:
Station Density = Number of Public Charging Stations
Operating Area
Here, the operating area is determined through the model in subsection 4.3.1 and
clearly stands in a qualitative interrelationship to the existing infrastructure but is de-
fined as given for this investigation. The missing part of the equation is the number of
charging stations.
Similar to the determination of the fleet size, the ideal number of charging stations
in the operating area depends on the willingness to walk. As a rule of thumb, also
here the 250m-500m beeline applies (see subsection 4.3.1) as the distance people are
willing to walk to a car should a priori be the same as the distance they are willing to](https://image.slidesharecdn.com/6e07fbad-1fc9-4865-930b-b3b2597817b7-150708184002-lva1-app6891/85/Seign_Dissertation-117-320.jpg)
![4.3. MODELING LOCALLY ADAPTIVE ASPECTS 103
Station Density = Number of Public Charging Stations
Operating Area ≥ 3stations
km2 ⇒ Decentralized
Station Density = Number of Public Charging Stations
Operating Area < 3stations
km2 ⇒ Central
As discussed, these stations should use the appropriate technology depending on
their location as well as their spatial distribution should be ideally equal in the operat-
ing area. Therefore, the location of charging stations and their employed technology
should be qualitatively included in the choice of the charging concept as well as in the
decision of where to define the business area (see discussion in subsection 4.3.1).
The qualitative check can rely on the output of the regression model that aids in
determining the operating area. In expected hot-spots there should be faster chargers
than in areas where less bookings and longer parking periods can be expected. In case
the employed technology is regarded as suitable, the spatial distribution of charging
stations within the operating area should be equal to ensure proximity. If the charg-
ing technology does not fit this prescription, potentially more chargers are needed in
areas with longer parking durations. In practice, a visual check of chargers’ spatial
distribution can be regarded as most useful. Figure 4.23 gives an overview on different
methods to carry out this check. Map a) shows the spatial distribution of RWE charging
stations in Berlin within the operating area of DriveNow. Here, it can clearly be seen
that stations are clustered and that there are wide areas within the operating area that
are not covered by RWE’s network. To extend this visual check, the use of geographic
information systems (GIS) can provide for a more detailed analysis. Map b) shows the
application of the standard distance to the Berlin data. This statistic provides a sum-
mary measure of charging station distribution around their center. This is similar to the
way a standard deviation measures the distribution of data values around the statistical
mean. Here a circle polygon is drawn centered on the mean and with a radius equal
to one standard distance, covering ca. 68% of all stations. Another way of using a
GIS to measure and depict spatial distribution is the standard deviation ellipse as illus-
trated in map c). It summarizes the spatial characteristics of geographic features such
as central tendency, dispersion, and directional trends. Charging stations are concen-
trated in the center with fewer features toward the periphery and one standard deviation
ellipse polygon will cover approximately 68 percent of stations as well. [73] A third
and pragmatic approach is to draw buffers around charging stations that represent the
325m walking circle (= 3 stations/km2) beeline radius that is assumed to be regarded as
acceptable for walking to and from a charging station. This is shown in map d). These](https://image.slidesharecdn.com/6e07fbad-1fc9-4865-930b-b3b2597817b7-150708184002-lva1-app6891/85/Seign_Dissertation-119-320.jpg)
![104 CHAPTER 4. DEVELOPMENT OF THE MODEL-BASED FRAMEWORK
buffers show the potential ”commuter belt” around stations and are therefore useful
when checking the coverage and potential gaps in the spatial distribution of charging
stations.
a) b)
c) d)
Figure 4.23: Overview on Methods to Check the Spatial Distribution of Charging
Stations: a) Shows a Simple Map of RWE Charging Stations in the Operating Area of
DriveNow Berlin for Visual Inspection, b) Applies the Standard Distance, c) the
Standard Deviation Ellipse, and d) Walking Circles with 325m Beeline Radii
A third option for analyzing and measuring the spatial distribution of chargers is to
rely on index values. This however is not recommended and it is crucial to perform a
qualitative visual check because merely relying on index values (e.g. when no graph-
ical GIS system is available) could easily lead to misinterpretations. For example,
Huang and Leung showed that the Coefficient of Variation and the Hoover Concen-
tration Index are different kinds of measurement intended to show the same pattern
of regional inequality but they may show opposite results when they are applied to
specific cases. [115]
Since operability is a requirement of the model-based framework, the use of a GIS
should be avoided when this does not compromise the performance of the framework.
Without doubt, the use of a GIS as applied in map b), c), and d) in figure 4.23 can sup-
port decision makers but a simple visual check as in map a) will also enable managers](https://image.slidesharecdn.com/6e07fbad-1fc9-4865-930b-b3b2597817b7-150708184002-lva1-app6891/85/Seign_Dissertation-120-320.jpg)
![4.3. MODELING LOCALLY ADAPTIVE ASPECTS 105
to make decisions. As a consequence no statistical measures for geographic distribu-
tion are incorporated in the model-based framework. Nevertheless, this section showed
how to quantify the spatial distribution and it is left to the readers’ discretion whether
to perform a statistical analysis in addition to the visual check of the spatial distribution
of charging infrastructure or not.
Lastly, it must also be considered that the choice of the charging concept might
have effects on the fleet availability (cars are utilized for different time periods whilst
charging) and hence on the fleet size as discussed in the previous section. Also, in
this concept, the utilization of charging stations and thereby the possibility that some
stations are occupied and not available is neglected for the reasons discussed. In future
however, BEVs could reach significant market shares. In this case, the necessary num-
ber of charging stations for decentralized charging concepts can be derived similar to
the number of vehicles and the utilization of the given stations by all vehicles must be
considered.
To evaluate this proposition with empirical data, current free-floating operations
with electric vehicles are considered. Since the biggest provider, car2go, does not
publish where and how many charging stations are part of the service in the respective
cities, multiple sources were used in the desk research conducted. Table 4.7 gives an
overview on the results.
It can be seen that only on two occasions charging depots are in use (at least accord-
ing to the communication made by the firms). One time, in San Diego, they are used
in combination with a decentralized concept as fall back solution. The other time is in
combination with a few public chargers to enable customers to charge themselves occa-
sionally. Furthermore, a clear relationship between the willingness to employ electric
vehicles in free-floating carsharing operations and station density is revealed. Opera-
tors seem to avoid central concepts and are only deploying substantial electric fleets
where there are relatively high charging station densities. Additionally, in these four
cites the local government or the local charging infrastructure providers are planning
to expand the charging network extensively: Berlin announced a tender with the aim
to employ 300 charging stations by the end of 2013 and 800 by the end of 2015, [211]
in Stuttgart the expansion of the charging network to 500 stations is planned in the
course of 2013, [72] Amsterdam announced to install 1,000 charging stations in 2012
(result unknown), [138] and San Diego is in the process of installing 700 charging sta-
tions within the city limits. [106] From this it follows that current station densities in
these cities will increase remarkably shortly after the start of operation of carsharing](https://image.slidesharecdn.com/6e07fbad-1fc9-4865-930b-b3b2597817b7-150708184002-lva1-app6891/85/Seign_Dissertation-121-320.jpg)
![106 CHAPTER 4. DEVELOPMENT OF THE MODEL-BASED FRAMEWORK
Provider City Charging
Concept
Oper-
ating
Area
[km2]
Fleet
Size
(BEVs)
No. of
Charg-
ing
Sta-
tions
Charging
Station
Density
Stations
km2
Vehicle
Den-
sity
Vehicles
km2
car2go Ulm Decentral-
ized
52 300
(20)
48 0.92 5.77
car2go San
Diego
Mixed 77 300
(300)
100 1.29 3.9
car2go Amster-
dam
Mixed 80 300
(300)
250 3.13 3.75
car2go Stuttgart Decentral-
ized
75 300
(300)
190 2.53 4
car2go Portland Central 95 280
(30)
4 0.04 2.95
Drive
Now
Berlin Decentral-
ized
140 650
(40)
64 0.46 4.64
Drive
Now
Munich Central 73 300
(20)
8 0.11 4.11
Multi-
city
Berlin Decentral-
ized
107 350
(350)
63 0.59 3.27
Table 4.7: Overview of Free-Floating Carsharing Offers Regarding their Charging
Concept and Local Charging Station Densities (At the Start of Operation, where Data
was Available). Based on:
[137, 111, 244, 177, 138, 162, 145, 42, 44, 70, 159, 165, 164].
offers and thus, comes close or even higher than the theoretically deducted number
of 3 charging stations per square kilometer as a necessary basic coverage to allow for
decentralized charging concepts.
Looking at current practices, it seems that providers avoid central charging con-
cepts and rather employ conventional fleets. However, if providers decide for strategic
or political reasons to employ electric vehicles in a city with an insufficient charging
station density, central charging concepts are the agony of choice.
4.3.4 Fleet Mix
The next aspect that has to be modeled is the fleet mix. The fleet mix can be seen
regarding different types of vehicles (compact cars for the city, minivans for transport-
ing bulky items, convertibles for vacation trips, etc.) as well as regarding to different](https://image.slidesharecdn.com/6e07fbad-1fc9-4865-930b-b3b2597817b7-150708184002-lva1-app6891/85/Seign_Dissertation-122-320.jpg)
![4.3. MODELING LOCALLY ADAPTIVE ASPECTS 107
drivetrains (electric cars for short and conventional cars for long distances).
Offering a variety of vehicles gives customers the possibility to choose the right
vehicle for a variety of use cases. Ideally providers should offer a wide variety of
different vehicles in every city and therefore the mix of different types of vehicles
is not directly influenced by local circumstances. However, an aspect that should be
considered qualitatively is the existing local vehicle mix. For example, in Dubai or
Los Angeles large vehicles shape the streetscape whereas in Italy small city cars are
predominant. The reason for this might be cultural, economical (different fuel prices),
but also due to local infrastructure (street widths for example). Therefore, the per se
standardized fleet mix of different vehicle types might need to be aligned according to
local circumstances if there is an extreme misfit and customer acceptance is thought to
be jeopardized. To the contrary, providers so far do not adapt their vehicle mix to local
circumstances. Whilst DriveNow offers different vehicle types in its fleet, it does not
alter its offer market by market. Car2go goes one step further and only offers one type
of vehicle regardless of the market. This vehicle, a Smart, which is a two-seater micro-
car, is built for urban use, compact in size, and environmentally friendly and therefore
an ideal car for free-floating carsharing according to car2go. [59] This approach is not
only taken to cities where such vehicles are common, but also to cities like Denver and
possibly even Los Angeles [48] in future where large vans or trucks are standard. The
reason for neglecting this aspect might lie in customers’ perceptions. A small survey
among customers from DriveNow in Germany (n=38) asked according to which factors
people choose a carsharing vehicle. The answers were very conclusive, since 95%
stated that the location of the car is important, whereas only 27% are interested in the
type, 16% in the brand, and 5% in the engine power of the vehicle. [21] Nevertheless,
ideally a qualitative alignment to the local vehicle mix should be carried out in order
to avoid misplanning.
As discussed in section 3.2, the local adaptation of the fleet mix focuses on the mix
of drivetrains and hence the share of BEVs in local carsharing fleets. Discussing what
a suitable success measure for the fleet mix is, is not relevant, because the fleet mix
strongly depends on the results from the charging concept model (see subsection 4.3.3).
Applying a fleet mix model only becomes necessary when a sensible charging concept
can be applied. This means if it is not possible to charge decentralized in a city, the use
of electric vehicles should be avoided because central charging concepts are disadvan-
tageous for customers and providers as discussed previously. This is also mostly the
case in reality where electric fleets are the exception in free-floating carsharing.](https://image.slidesharecdn.com/6e07fbad-1fc9-4865-930b-b3b2597817b7-150708184002-lva1-app6891/85/Seign_Dissertation-123-320.jpg)
![4.3. MODELING LOCALLY ADAPTIVE ASPECTS 109
0%
10%
20%
30%
40%
50%
60%
70%
80%
90%
100%
0
5,000
10,000
15,000
20,000
25,000
30,000
Frequency
Cumulated Vehicle Trips per Day [km per vehicle per day]
Frequency
Cumulated %
Figure 4.24: Histogram on Vehicle Kilometers per Day
distance trip also takes more time and therefore limits the availability of the few con-
ventional vehicles. Whilst the average booking duration of the 98.84% of bookings
that can be served with electric vehicles is 32.1 minutes, the average booking duration
of trips with 65km or more driving distance is 290.5 minutes. This means a trip that
can only be served with a conventional vehicle is in average nine times longer than a
trip that can be served with an electric vehicle. From this it follows that the minimum
share of conventional vehicles should be set accordingly:
Minimum Share of Conventional Vehicles = 1.16%∗ 290.5 minutes
32.1 minutes = 10.5%
To get to one of this 10.5% minimum share of conventional vehicles it is mostly
necessary to walk longer than five minutes. It is assumed however, that this is accepted
by customers since the longer walk is negligible in comparison to the expected longer
overall duration of the conventional vehicle trip as opposed to the average of 30 min-
utes driving time for BEV trips. Despite this assumption, people will not be willing
to walk longer in proportion to their trip time as this would be in average 9 x 5 min-
utes = 45 minutes. In this case, it is still possible to use an electric vehicle to drive
to the required conventional vehicle. This possibility should be enabled by providers,
e.g. through the possibility of double-reservations, to compensate the relatively low
density of conventional vehicles.
As mentioned in the discussion of the charging concept in subsection 4.3.3, ide-
ally, customers do not want to have any hassle and simply leave the car wherever they
want without performing any duty. Providers on the other hand aim that customers
charge the vehicles regularly themselves and no expensive fleet management actions](https://image.slidesharecdn.com/6e07fbad-1fc9-4865-930b-b3b2597817b7-150708184002-lva1-app6891/85/Seign_Dissertation-125-320.jpg)
![110 CHAPTER 4. DEVELOPMENT OF THE MODEL-BASED FRAMEWORK
0.00%
10.00%
20.00%
30.00%
40.00%
50.00%
60.00%
70.00%
80.00%
90.00%
100.00%
0
50,000
100,000
150,000
200,000
250,000
300,000
350,000
5 10 15 20 25 35 45 55 65 150 higher
Frequency
Distances [km]
Frequency
Cumulated %
Figure 4.25: Histogram on Trip Distances
are needed. Combining both views is concluded to work best in an environment with
a sufficient number of publicly available charging stations. Here, potentially available
parking spaces at these stations might even outweigh potential hassles when charg-
ing the vehicle. A sufficient number of charging stations to charge decentralized was
defined to be three stations per km2 in the operating area due to the limited willing-
ness to walk. When looking at the influential factors for determining the fleet size
in section 4.3.2, it becomes clear that there are more cars than the minimum number
of charging stations, depending on the utilization and spatial coverage rates set. This
number of electric vehicles cannot be chosen arbitrarily high. The utilization of charg-
ing stations through carsharing and other electric vehicles is already factored out since
vehicles do not need to be charged after every trip and there are not many electric ve-
hicles in the markets yet. In order not to overwork this assumption when infleeting
high numbers of BEVs, the maximum number of BEVs should not be higher than the
number of charging stations in the operating area.
From this discussion, the following model can be derived:
1) If there is a decentralized charging concept, then:
Number of Charging Stations
Fleet Size ≥ 89.5% ⇒ 89.5% BEV share
Number of Charging Stations
Fleet Size ≤ 89.5% ⇒ BEV share = Number of Charging Stations
Fleet Size
2) If there is a ”Strategic/Regulatory Need for BEVs”, then: Manual Input
3) Else: 0% BEVshare](https://image.slidesharecdn.com/6e07fbad-1fc9-4865-930b-b3b2597817b7-150708184002-lva1-app6891/85/Seign_Dissertation-126-320.jpg)
![4.3. MODELING LOCALLY ADAPTIVE ASPECTS 111
An evaluation of this model is not possible since it is not known how operators
determine the mix of electric and conventional vehicles. Only from DriveNow it can be
assumed that the number of electric vehicles is relatively low, as the vehicles are used in
research projects as well as the vehicle itself is only a prototype, accordingly, equipping
the whole fleet would not be feasible. Car2go and Multicity on the other hand appear
to fleet in vehicles strategically determined since they either have completely electric
fleets, e.g. to get access to a city’s parking spaces, or just a handful of BEVs, e.g.
for promotion reasons. Multicity for example clearly positions itself in the market
as purely electric offer; hence the question regarding the fleet mix is irrelevant for
them. Table 4.7 gives an overview on the fleet mix of all at least partly electric free-
floating systems. Nevertheless, from a theoretical perspective the proposed model is
seen as robust whilst in reality regulatory or strategic reasons will often play a role
when determining the fleet mix. This is also considered by the model by allowing for
manual input.
4.3.5 Pricing
Determination of the Willingness-to-Pay
When modeling the price, it is aimed to support decision makers in setting an appro-
priate price level and adapt this level to local conditions.
In Germany, free-floating carsharing was born and is in operation since 2008/2009
when car2go started testing the approach in Ulm. Since then, different prices were tried
out and the driving price per minute of car2go reached a plateau of 0.29 EUR. [231]
This was also the price when DriveNow, the second free-floating provider, started op-
erations in 2011 until changing the price in 2013 to 0.31 EUR per minute [69] whilst
offering only well-equipped premium BMW and MINI vehicles as opposed to car2go’s
base Smart vehicles. Because customer growing rates continue to be very high, a price
around 0.30 EUR per minute appears to be acceptable in Germany from a diffusion and
customer perspective. Whether this price point is at its optimum must be questioned
however.
Ideally, prices are set with the knowledge of their elasticities, i.e. how much more
or less bookings can be expected when the price is altered. Unfortunately, there is
no available data on different price points and the effect on the system. Also, price
elasticities of other products from the transportation sector cannot easily be transferred](https://image.slidesharecdn.com/6e07fbad-1fc9-4865-930b-b3b2597817b7-150708184002-lva1-app6891/85/Seign_Dissertation-127-320.jpg)
![112 CHAPTER 4. DEVELOPMENT OF THE MODEL-BASED FRAMEWORK
since the innovation of free-floating carsharing is a new and different way of trans-
portation. Accordingly, simply transferring other price elasticities might lead to wrong
conclusions and no evaluation would be possible in this research. This makes a slightly
different approach necessary.
If observation is not possible, survey-based methods appear as alternative for mea-
suring willingness to pay. [163] For this dissertation, van Westendorp’s Price Sensi-
tivity Meter (PSM) [245] is chosen because it appears as most practicable and useful
technique. Whilst its hypothetical character can be criticized for leading to potentially
unrealistic results, the observation of real transactions would always be under the in-
fluence of the existing market price and therefore, results cannot be generalized. Also,
their potential cost is out of scope of this research. A further advantage of the PSM is
that it can be applied through online-surveys and is relatively compact, for which rea-
son it is possible to achieve high participant numbers and thus a better representativity
of results.
To give a brief overview on the technique, the PSM consists of four basic questions
which are answered by the respondents referring to a scale of prices:
1. At which price on this scale are you beginning to experience carsharing as cheap?
2. At which price on this scale are you beginning to experience carsharing as ex-
pensive?
3. At which price on this scale are you beginning to experience carsharing as too
expensive - so that you would never consider using it yourself?
4. At which price on this scale are you beginning to experience carsharing as too
cheap - so that you say ”at this price quality cannot be good”?
In the actual survey, for which 2,500 random customers in five cities (=12,500
customers in total) were asked in May 2014 via email to fill out a online survey, ”car-
sharing” is of course altered to the product name and moreover, a scenario is created
which mirrors typical usage patterns and is therefore tangible for customers. This sce-
nario 1 contains a city-specific use-case where a customer drives 30 minutes to a park
and picks up some drinks on the way. This is followed by the four questions of the
PSM in which a total price for this drive is the reference point. With this design of the
questionnaire, it is tried to make customers forget the actual minutely price and think
about how much they would pay for such a trip.
For comparison and opposed to this approach, scenario 2 is developed, which di-
rectly asks customers about their opinion on the minutely driving price, which is rela-
tively abstract but useful for comparison with results from scenario 1, especially when](https://image.slidesharecdn.com/6e07fbad-1fc9-4865-930b-b3b2597817b7-150708184002-lva1-app6891/85/Seign_Dissertation-128-320.jpg)
![4.3. MODELING LOCALLY ADAPTIVE ASPECTS 113
considering the communicative aspect of a single minutely price. In order not to distort
results, it was blocked to go back to scenario 1 once answers were submitted to prevent
customers from aligning answers.
As a result, 2,071 customers participated in the survey. Data was cleared for in-
complete answers and bad data, e.g. when a customer states a higher price for ”cheap”
than for ”expensive”. This leaves 1,653 complete and valid answers. Analysis shows
that 53% of respondents were female and 41% also used another free-floating carshar-
ing provider and due to this and the random choice of customers, data can be regarded
as transferable for other providers as well.
Following van Westendorp’s guideline on analysis and interpretation [245], the four
questions asked in each scenario yield four cumulative distributions which are depicted
schematically for scenario 1 in figure 4.26. In this graph, the x-axis represents the
different price points whereas the y-axis shows the cumulative number of customers
(=potential market share). The answers of the respondents are shown as cumulated
frequency distributions whilst three curves are depicted inverted to be able to deduct
some key information graphically. This includes:
• Optimal Pricing Point (OPP): An equal number of people believe a product
is too cheap or too expensive; hence, resistance against this price is very low
(intersection of ”too expensive” and ”too cheap” (inverted)).
• Indifference Price (IDP): An equal number of people experience the product
as cheap or expensive (intersection of ”expensive” and ”cheap” (inverted)). This
is generally the median price actually paid by the customer or the price of the
product of an important market leader.
• Point of Marginal Cheapness (PMC): The number of people that experience
the product as too cheap is larger than the number which experience it merely as
cheap (intersection of ”cheap” and ”too cheap” (inverted)).
• Point of Marginal Expensiveness (PME): The number of people that expe-
rience the product as too expensive is larger than the number which experi-
ence it merely as expensive (intersection of ”expensive” and ”too expensive”
(inverted)).
• Range of Acceptable Prices: The range between PME and PMC, because be-
low or above these points prices are unacceptably cheap or expensive for most
people.
For reasons of clarity, the results of graphical analysis with the explained rele-
vant pricing points determined are extracted in table 4.8. Furthermore, as figure 4.26](https://image.slidesharecdn.com/6e07fbad-1fc9-4865-930b-b3b2597817b7-150708184002-lva1-app6891/85/Seign_Dissertation-129-320.jpg)
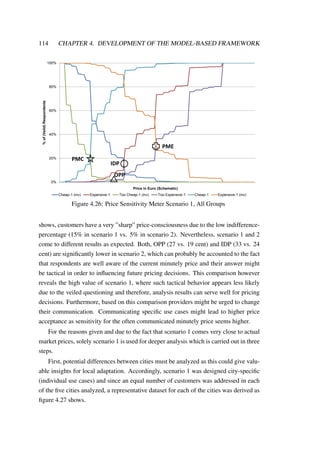
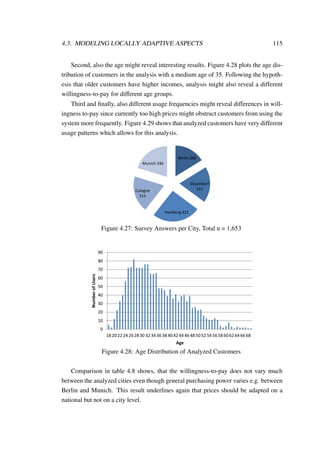
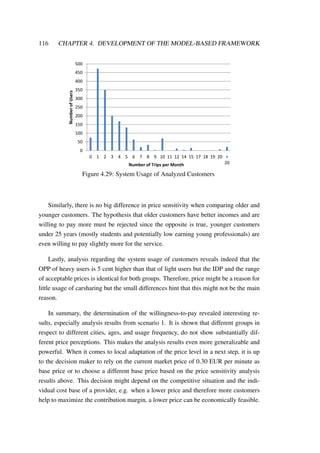
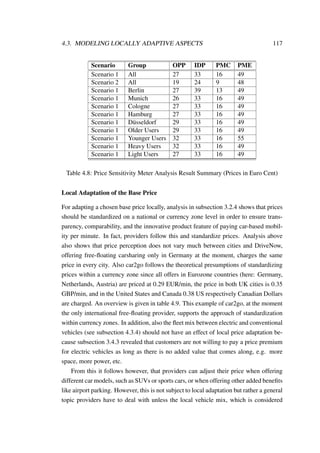
![118 CHAPTER 4. DEVELOPMENT OF THE MODEL-BASED FRAMEWORK
qualitatively in the framework, is locally adapted. The example of DriveNow, charging
a price premium for SUVs and convertibles as well as for airport parking, shows that
this is already addressed in practice.
Logically, and supported by theory, the price must be locally adapted when there
is a new currency involved. Applying only the exchange rate from an existing to a
new market to derive the price in a new currency might be misleading as not only
the currency but also price levels and incomes in new markets can be very different.
Accordingly, cost structures vary as well, having an effect on the providers’ opera-
tional costs. These operational costs are not scope of this dissertation and change from
provider to provider. It can be assumed however, that a generally higher price level in
a country will not only offer the chance to raise prices for the offer but also leads to
higher operational costs and vice versa, leaving profit margins unaffected. According
to the definition of success in subsection 3.3.1, this work proposes to apply a market-
based pricing strategy rather than a cost based pricing strategy to promote the adoption
of the concept.
Adapting the price locally should not only rely on the general price level or the
general purchasing power parity. These measures are derived from baskets of goods
which price levels are compared between countries, including a wide variety of prod-
ucts and services. For free-floating carsharing, the goods in these market baskets are
not representative and a generally higher price and income level might not automat-
ically lead to the acceptance of higher prices for mobility. General baskets of goods
are valuable for economical inter-country comparisons in real terms of gross domestic
product. Therefore, it is more sensible to derive a custom price index for free-floating
carsharing which is based on substitution goods from the transportation sector. It can
be assumed, that if people are willing to pay a certain price for a substitution, they
are also willing to accept the same relative price level for carsharing regardless of the
general price level and their income. The need for mobility is seen as constant because
it is assumed that the use of carsharing does not induce additional mobility but rather
changes the choice of transport mode.
As described by Millard-Ball et al., in its functionality, the carsharing concept is
intended to fill the mobility gap between public transport, taxis, bicycles, car rental and
private cars. [151] Customers use carsharing to avoid elevated fixed costs of ownership
and instead pay higher variable costs in form of fees charged by minute or kilometer.
Therefore, carsharing only works in areas with robust transportation alternatives as
combined mobility is seen as one of the concepts’ strengths. [66] In subsection 3.4.3](https://image.slidesharecdn.com/6e07fbad-1fc9-4865-930b-b3b2597817b7-150708184002-lva1-app6891/85/Seign_Dissertation-134-320.jpg)
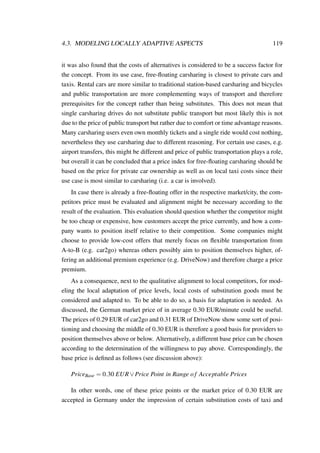
![120 CHAPTER 4. DEVELOPMENT OF THE MODEL-BASED FRAMEWORK
private car use. In a next step, a base index is built which represents the taxi and car
ownership costs in Germany accordingly and it is defined as:
IndexBase = 2∗(TaxiPriceBerlin+TaxiPriceMunich
2 )+(CarPriceBerlin+CarPriceMunich
2 )
In the base index, Munich and Berlin are considered since both are big German
cities with car2go and DriveNow presence. Also, taxi price is weighted double com-
pared to car ownership costs because free-floating carsharing intends to replace car
ownership (see section 2.3) and once diffused, taxis are more likely to be a substitute
for free-floating carsharing. Additionally, free-floating carsharing is very similar to
the flexibility of taxi services with the distinction that one has to drive on his/her own.
The car ownership price cannot be neglected however, since it is also a representa-
tion of local policies which should not be undermined. For example, if car ownership
is heavily taxed in a market in order to reduce it, offering ”cheap” carsharing could
lead to disagreement from local authorities which should be avoided, especially when
considering how important local regulations (e.g. parking) for the concept are.
Having set the base price and the base index, it is possible to allow for local adap-
tation of the price, when local taxi and car ownership costs are known. With these two
variables, a new index is created, the local index:
IndexLocal = 2∗TaxiPriceLocal +CarPriceLocal
The last determinant for the model is the exchange rate. Considering the exchange
rate is important in order to transfer the value of one currency to another. As a result,
figure 4.30 sums up the approach chosen and the following model to locally adapt
prices is proposed:
PriceLocal = IndexLocal∗ExchangeRate (to EUR)
IndexBase
∗PriceBase ∗ExchangeRate(from EUR)
In order to allow for transferability, a common data source should be used when
applying the model. The Swiss bank UBS regularly publishes a report on global prices
and incomes on a city level called ”Preise und L¨ohne”. In its last edition from 2012,
72 cities in 58 countries were considered, [241] making it a valuable data source. To
derive the base index as well as the local index, data from this report is used for local
taxi prices. For car ownership costs it is not sufficient to simply look at local vehicle
prices or taxes such as in the UBS report. Also insurances, gas prices, depreciation, or
maintenance have to be considered. Automobile clubs such as the AAA in the US or
the ADAC in Germany publish such figures on a regular basis for a variety of vehicles](https://image.slidesharecdn.com/6e07fbad-1fc9-4865-930b-b3b2597817b7-150708184002-lva1-app6891/85/Seign_Dissertation-136-320.jpg)
![4.3. MODELING LOCALLY ADAPTIVE ASPECTS 121
and a variety of annual mileages. Here, typical carsharing vehicles such as a MINI
Cooper with an annual mileage of around 15,000 kilometers is chosen to derive the
costs of private car ownership on a kilometer / mile basis. These costs can be assessed
on a national rather than on a city level because the only difference for car owners in
different cities is parking costs, which however depend on the individual person and
place of residence.
Base Price
Alternative 1
Base Price
Alternative 2
Current Market
Price (0,30€)
Determination of
Willingness-to-Pay
Local Price Level
for Mobility
Local Taxi Price
Local Private
Vehicle Costs
Exchange Rate
Market Specific
Price
(Driving per Minute)
Competitors’ Prices
Figure 4.30: Summary of the Price Model Approach
In general, the model should be applied to a city level; however, since standardiza-
tion is pursued within a currency zone or a country, a lead market has to be defined for
price modeling. Usually, this would be the capital or the biggest/most important city
of a country respectively the first city that is approached in a new country. All other
cities in that country that follow should be priced according to such a lead market.
Evaluation
To apply and evaluate the model, cities in which car2go is currently present are chosen
since it is the only international free-floating provider. Car2go is present in cities in the
Eurozone, USA, UK, and Canada. Eurozone cities are based according to the German
base price and are therefore not modeled, whilst for the US Miami is the lead market
(since it is the biggest city where car2go is present), for the United Kingdom it is
London, and for Canada it is Toronto.
In a first step, IndexBase must be determined. To do so, data for taxi prices [241]
(based on a 5 km/3 mile journey) and for a comparable private car ride was used. [2]
This results in the following:
IndexBase = 2∗ 8.33 EUR+13.93 EUR
2 +
0.39 EUR
km ∗5 km+0.39 EUR
km ∗5 km
2 = 24.23 EUR
Now, the indices for Miami, [241, 5] London, [241, 236] and Toronto [241, 41] are
calculated:](https://image.slidesharecdn.com/6e07fbad-1fc9-4865-930b-b3b2597817b7-150708184002-lva1-app6891/85/Seign_Dissertation-137-320.jpg)
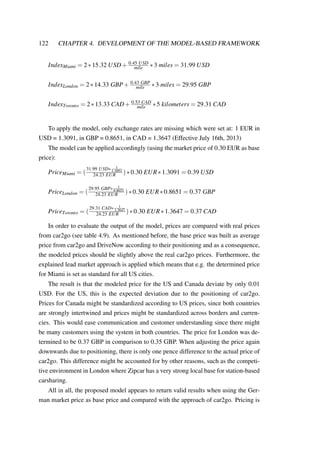
![4.4. DERIVATION OF THE MODEL-BASED FRAMEWORK 123
always a sensible issue that is driven by a variety of company specific factors and the
market environment an offer is placed in. Nevertheless, the proposed model can surely
give guidance when adopting the prices for free-floating carsharing systems to local
markets.
City Country/ Mon-
etary Union
Driving Price
(per minute)
Modeled Price
Amsterdam Eurozone 0,29 EUR - (base price)
Austin USA 0,38 USD 0.39 USD
Berlin Eurozone 0,29 EUR -
Birmingham UK 0,35 GBP 0.37 GBP
Calgary Canada 0,38 CAD 0.37 CAD
Denver USA 0,38 USD 0.39 USD
D¨usseldorf Eurozone 0,29 EUR -
Hamburg Eurozone 0,29 EUR -
Cologne Eurozone 0,29 EUR -
London UK 0,35 GBP 0.37 GBP
Miami USA 0,38 USD 0.39 USD
Munich Eurozone 0,29 EUR -
Portland USA 0,38 USD 0.39 USD
San Diego USA 0,38 USD 0.39 USD
Seattle USA 0,38 USD 0.39 USD
Stuttgart Eurozone 0,29 EUR -
Toronto Canada 0,38 CAD 0.37 CAD
Ulm Eurozone 0,29 EUR -
Vancouver Canada 0,38 CAD 0.37 CAD
Washington USA 0,38 USD 0.39 USD
Vienna Eurozone 0,29 EUR -
Table 4.9: Evaluation: Actual vs. Modeled Prices of car2go [42]
4.4 Derivation of the Model-Based Framework
In the previous section five individual models were developed and each of these models
has a certain set of input and output parameters as well as the models are interrelated.
The first model outputs the operating area and relies on population density, city
center distance, housing rent, and hotel-/restaurant density as input parameters. In
addition to those quantitative inputs, experts must also carry out a qualitative alignment
with a city map to exclude water, large parks, etc., on-street parking possibilities, and](https://image.slidesharecdn.com/6e07fbad-1fc9-4865-930b-b3b2597817b7-150708184002-lva1-app6891/85/Seign_Dissertation-139-320.jpg)

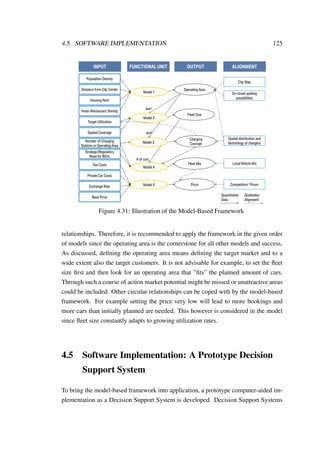
![126 CHAPTER 4. DEVELOPMENT OF THE MODEL-BASED FRAMEWORK
(DSS) are ”computer technology solutions that can be used to support complex deci-
sion making and problem solving”. [216] In concrete terms, the model-based frame-
work (as depicted in figure 4.31) is implemented in Microsoft Excel, [150] comple-
mented by the add-in ExcelToDBF to allow for the manipulation of geographical in-
formation [31] as well as Google Earth [104] for the depiction of information on a map.
With this solution the requirements of ”operability” and ”adjustment” can be fulfilled
because Excel is the industry standard for spreadsheets and ExcelToDBF and Google
Earth are freeware and easy to use. This avoids extensive costs, training and comput-
ing efforts. Accordingly, operators of the software can easily implement adjustments
over time and for their specific needs. Figure 4.32 gives an overview on the operating
principle of the Decision Support System.
Distance from City Center
Population Density
Hotel-/Restaurant Density
Housing Rent
Number of Charging
Stations in Operating Area
Target Utilization
Strategic/Regulatory
Need for BEVs
Taxi Costs
Exchange Rate
Private Car Costs
Spatial Coverage
Base Price
Geodata
.shp / .dbf
Expert Knowledge
City Data / other
Sources
Data Requirement Source System Output
Operating Area
Fleet Size
Charging
Concept
Fleet Mix
Price
.xls
Decision Support System
with 5 Modules
.kml
Recommendations
Figure 4.32: Overview on the Operating Principle of the Decision Support System
The program is divided in five modules whereas each module is an Excel spread-
sheet, each representing one model (operating area, fleet size, charging mode, fleet
mix, and price). Each sheet has a step-by-step guidance on how to use the tool, in-
put data, and interpret results. The functional unit or ”calculation areas” are hidden
for the user to allow for easy handling, as well as a variety of VBA (Visual Basic for
Applications) coded macros assists the user. Further, results and assisting graphics are](https://image.slidesharecdn.com/6e07fbad-1fc9-4865-930b-b3b2597817b7-150708184002-lva1-app6891/85/Seign_Dissertation-142-320.jpg)
![4.5. SOFTWARE IMPLEMENTATION 127
illustrated through a variety of plots.
Specifically for the determination of the operating area, the tool helps to manipulate
geographical data and guides on the import of data into Google Earth, where detailed
analyses and the detailed planning of the operating area is carried out. To do so, the
acquired geographic variables population density, rent, city center distance, and hotel-
/and restaurant density have to be pasted in the tool along with a tract ID and the area of
the respective segment. These two optional and additional inputs ensure the quality of
the input and allow for validity checks, but are not essential to the output. After having
pasted the information in the tool the user merely has to push ”calculate” and in the
background, indexes of the variables are created and the regression model is applied.
The outcome, the forecast ”relative booking density” is now presented to the user as
well as quintiles are calculated for coloring the map in five categories. Consequently, a
step-by-step guidance explains the user thoroughly how to create a map from this data
in Google Earth with the help of the ExcelToDBF add-in. An impression shall be given
in figure 4.33, depicting a screenshot of Google Earth where an operating for London
is assessed (data is provided by GeoLytix [99]). In Google Earth the user is able to
overlay the forecast model with other geographic information that might be needed
(controlled parking zones, not accessible areas, waterland, parks, etc.) to determine
the operating area. The area of this zone must then be entered into the tool and for
information, the chosen size of the operating area is compared to those of other cities,
normalized by the total population of a city and, in another plot, by the cities’ overall
population densities. Figure G.1 in Appendix G shows a screenshot of the operating
area module.
To move to the next part of the tool, figure G.2 in Appendix G shows a screenshot
of the fleet size part with step-by-step guidance on the left, input parameters in green,
the resulting fleet size in red, performance indicators in grey, as well as with plots for
validation and performance review. In concrete terms, users must choose the aimed
target utilization and spatial coverage they want to achieve with the carsharing system.
To validate these inputs, users must click ”update plots” and three information plots
are given. The first shows the expected utilization during a typical weekday and a
typical weekend in order to review whether the chosen utilization accounts for enough
”buffer” in peak times. The second plot shows the relationship of spatial coverage
and fleet size at the chosen utilization. Here, users can see how other input values for
spatial coverage affect the fleet size and that potentially a higher choice might end up
in a disproportionately growing fleet size. Eventually, graph three gives information of](https://image.slidesharecdn.com/6e07fbad-1fc9-4865-930b-b3b2597817b7-150708184002-lva1-app6891/85/Seign_Dissertation-143-320.jpg)
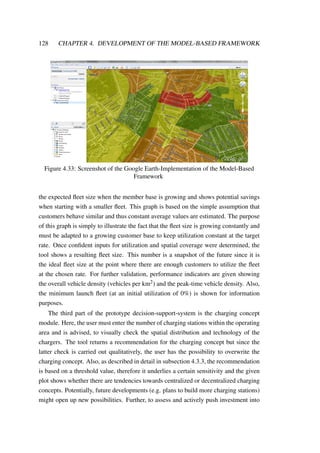
![130 CHAPTER 4. DEVELOPMENT OF THE MODEL-BASED FRAMEWORK
4.6 Model Validation: Application to Chicago
The aim of this section is to demonstrate and evaluate the applicability of the model-
based framework. Therefore, a free-floating carsharing system is planned out for
Chicago, IL, USA, which was chosen as it is a big North American city that does
not yet have a free-floating carsharing system. Since the models, the framework and
its software implementation were already explained, the application of the latter is the
next logical step.
The first aspect that is determined for Chicago is the operating area. To do so,
four variables - population density, hotel-/restaurant density, city center distance, and
housing rent - were acquired from Spatial Insights [219] on census tract level. Here,
the greater metropolitan area of Chicago with its 9.1 million inhabitants was chosen for
analysis. In other contexts a different definition of a ”city” might be chosen. For exam-
ple, this could be sensible if the city border goes in hand with different municipalities
and hence different political attitudes and parking regulations.
To carry out analysis and create a forecast model, the acquired data must be copied
in the tool, calculations are processed and guidance is given on how to import the layer
to Google Earth. The result of this steps is given in figure 4.34.
Figure 4.34: Screenshot of the Operating Area Forecast Model in Google Earth for
Chicago](https://image.slidesharecdn.com/6e07fbad-1fc9-4865-930b-b3b2597817b7-150708184002-lva1-app6891/85/Seign_Dissertation-146-320.jpg)
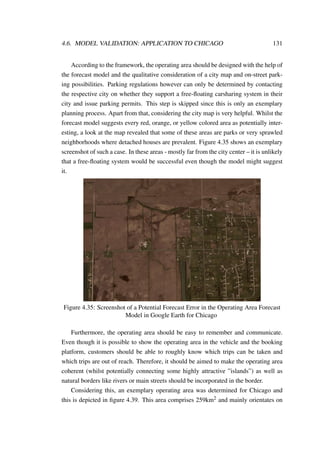
![132 CHAPTER 4. DEVELOPMENT OF THE MODEL-BASED FRAMEWORK
the lake shore in the east, Touhy Avenue in the north, Harlem Avenue in the west,
and Stevenson Expressway as well as Dwight D Eisenhower Expressway in the south.
Further, a small area known as Indian Village and Hyde Park was chosen as attractive
”island” in the south of the main operating area. Lastly, in order to potentially enable
the use of electric vehicles, the locations of charging stations were considered.
The next aspect that has to be determined is the fleet size. Here, a target utilization
of 15% is chosen to ensure availability also in peak times whilst utilizing he vehicles
economically as well. Further, the spatial coverage is set to 40% because experience
with such a coverage shows a good reception by customers. Accordingly, 1044 vehi-
cles should be employed in Chicago. As figure 4.36 shows, this means that also in peak
times 700 vehicles (=2.7 per km2) are available. Since this is a rather conservative ap-
proach, no smaller starting fleet is considered, even though the software suggests that
887 vehicles would be sufficient in the beginning because there are no customers yet
who utilize the vehicles.
If a more bold approach should be chosen along with the assumption that a better
availability leads to a more successful system, more vehicles should be employed.
Figure 4.37 shows which spatial coverage can be reached with which fleet size, e.g. to
reach 60% coverage, 2117 vehicles would be necessary.
0
200
400
600
800
1000
0%
10%
20%
30%
40%
50%
60%
70%
80%
90%
100%
00 01 02 03 04 05 06 07 08 09 10 11 12 13 14 15 16 17 18 19 20 21 22 23
ExpectedUtilization[#cars]
ExpectedUtilization[%]
Time Period
Target
Utilization
Weekday
Weekend
Figure 4.36: Expected Utilization of the Fleet (1044 Cars) in Chicago
The third aspect to be determined concerns the charging concept. As analysis in
Google Earth revealed, there are only 59 charging stations within the operating area,
even though the determination of this area considered the location of chargers. This
results in only 0.23 charging stations per km2 and is thus far below the threshold value
of three for decentralized charging concepts. Moreover, the stations are highly clus-
tered and big proportions of the operating area are not covered and thus unattractive](https://image.slidesharecdn.com/6e07fbad-1fc9-4865-930b-b3b2597817b7-150708184002-lva1-app6891/85/Seign_Dissertation-148-320.jpg)
![4.6. MODEL VALIDATION: APPLICATION TO CHICAGO 133
0%
10%
20%
30%
40%
50%
60%
70%
80%
90%
100%
60
566
1,073
1,610
2,057
2,534
3,131
3,697
4,144
4,532
5,069
5,695
6,112
6,858
7,186
7,663
8,229
8,527
9,362
9,660
10,435
10,406
11,062
11,837
12,314
12,731
SpatialCoverage[%]
Fleet Size @ chosen utilization
Figure 4.37: Expected Spatial Coverage of the Fleet (1044 Cars) in Chicago at 15%
Utilization
for electric vehicles. To reach the threshold charging station density for decentralized
charging, at least 718 additional chargers must be built and ideally, they should be
distributed evenly in the operating area and hotspots should be equipped with DC fast-
chargers. Due to these circumstances, it is advised to charge electric vehicles centrally
- if these are needed or strategically desired. Because of the huge gap to reach a de-
centralized concept, no manual overwriting of this recommendation is carried out and
the charging concept is set to be centralized.
This fact strongly influences the next aspect, the fleet mix. Since a centralized
charging concept is disadvantageous to customers and providers, it is recommended
not to employ electric vehicles and accordingly the fleet consists of 100% conventional
vehicles. In case e.g. the city wishes at least 20% electric vehicles in order to issue
parking permits for the operator, this can be entered manually in the tool but in the case
of Chicago such a requirement is not known. Another consideration is to look at the
type of vehicle(s) that should be employed in Chicago and how this blends in with the
local vehicle landscape of rather big (from an European point of view) cars and how
the chosen vehicles might fit the local needs e.g. for seat or luggage capacity.
Fifth and finally, the price for a free-floating carsharing system in Chicago is de-
termined. In this application, the actual market price of similar systems in Germany of
0.30 EUR is set as a base price for local adaptation. This local adaptation relies on the
local taxi price and private car costs. According to UBS [241], the reference price for
taxis is $13.25 and according to the AAA, private car costs amount to $0.45 per mile
for a typical carsharing vehicle. [5] The last input is the exchange rate which is set at
1.3731 US Dollar per Euro. Given these inputs, a local price of $0.34 is suggested,](https://image.slidesharecdn.com/6e07fbad-1fc9-4865-930b-b3b2597817b7-150708184002-lva1-app6891/85/Seign_Dissertation-149-320.jpg)
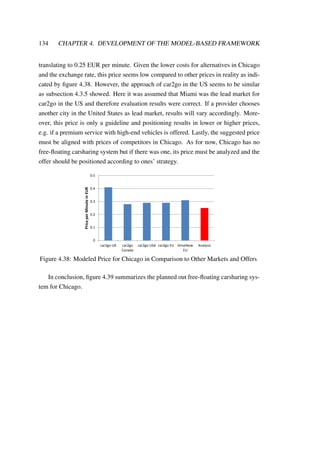
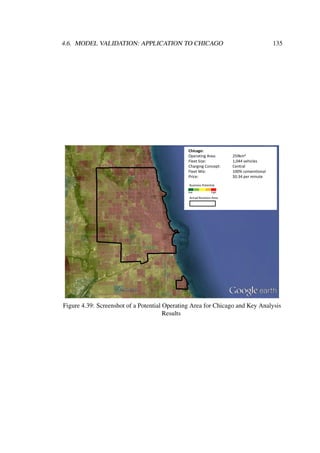
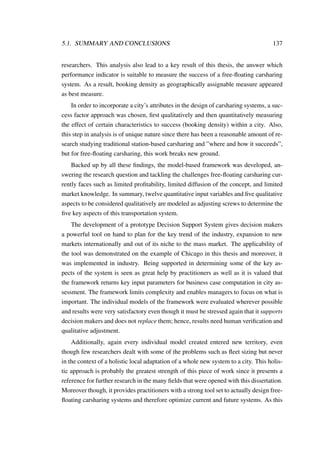
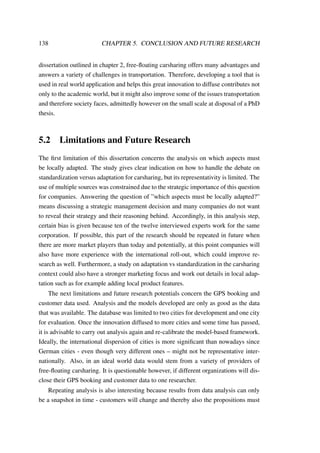
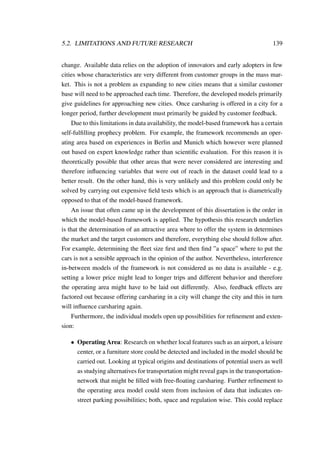
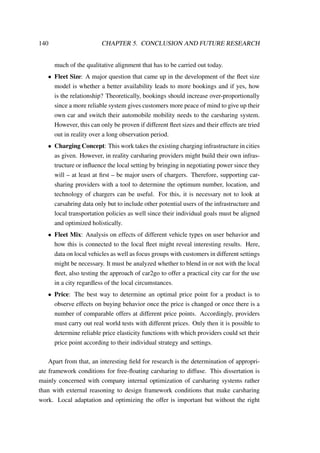
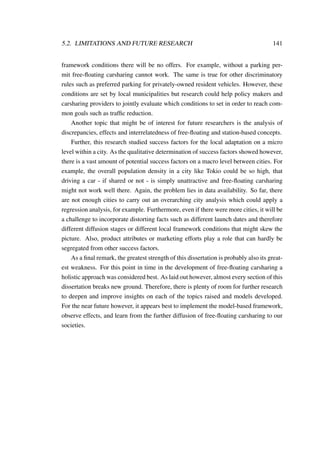
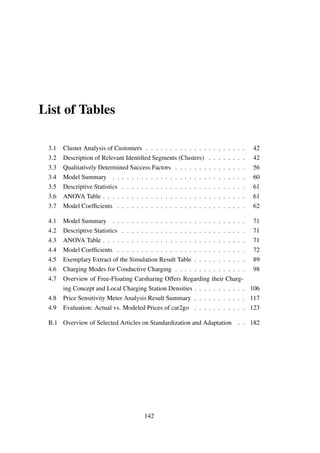
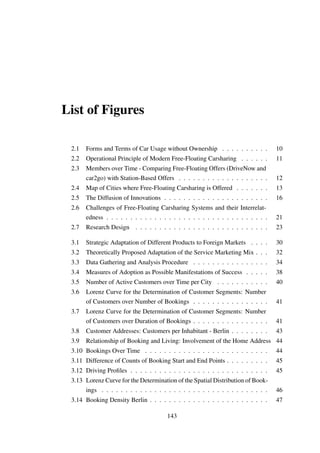

![Bibliography
[1] J. E. Abraham. A survey of carsharing preferences. World Transport Policy and
Practice, 5(3), 1999.
[2] ADAC. ADAC Autokosten 2013. http://www.adac.de/_mmm/pdf/
autokostenuebersicht_m-r_47088.pdf, 2013.
[3] Ritu Agarwal and Jayesh Prasad. The Role of Innovation Characteristics and
Perceived Voluntariness in the Acceptance of Information Technologies. Deci-
sion Sciences, 28(3):557–582, 1997.
[4] Icek Ajzen and Thomas J. Madden. Prediction of goal-directed behavior: At-
titudes, intentions, and perceived behavioral control. Journal of Experimental
Social Psychology, 22(5):453–474, 1986.
[5] American Automobile Association. Cost of Owning and Operating Vehicle
in U.S. Increased 1.9 Percent According to AAA’s 2012 ‘Your Driving
Costs’ Study. http://newsroom.aaa.com/2012/04/cost-of-owning-
and-operating-vehicle-in-u-s-increased-1-9-percent-according-
to-aaa%E2%80%99s-2012-%E2%80%98your-driving-costs%E2%80%99-
study/, 2012.
[6] Aral Aktiengesellschaft. Trends beim Autokauf 2013: Aral Studie.
http://www.aral.de/content/dam/aral/pdf/Brosch%C3%BCren/aral_
studie_trends_beim_autokauf_2013.pdf, 2013.
[7] Arthur D. Little. Zukunft der Mobilit¨at 2020, 2009.
[8] Auto Motor und Sport. Kongress - Die Rede von Bundesumwelt-
minister R¨ottgen - CO2-Grenzwert von zehn bis 35 Gramm ab 2040.
http://www.auto-motor-und-sport.de/eco/kongress-die-rede-von-
147](https://image.slidesharecdn.com/6e07fbad-1fc9-4865-930b-b3b2597817b7-150708184002-lva1-app6891/85/Seign_Dissertation-163-320.jpg)
![148 BIBLIOGRAPHY
bundesumweltminister-roettgen-co2-grenzwert-von-zehn-bis-35-
gramm-ab-2040-1828128.html, 2010.
[9] Auto Motor und Sport. Paris setzt auf Fahrr¨ader und Elektroautos - Im
Oktober startet Paris mit 3.000 E-Autos. http://www.auto-motor-und-
sport.de/news/paris-setzt-auf-fahrraeder-und-elektroautos-im-
oktober-startet-paris-mit-3-000-e-autos-3585683.html, 2011.
[10] Auto Motor und Sport. Urbane Mobilit¨at - Pariser wollen sich keine Elek-
troautos leihen. http://www.auto-motor-und-sport.de/news/neues-
verkehrskonzept-in-paris-erfolg-von-miet-e-autos-bleibt-aus-
4466806.html, 2012.
[11] Auto123.com. car2go Calgary: over 15,000 members in 60 days.
http://www.auto123.com/en/news/car2go-calgary-over-15000-
members-in-60-days?artid=148395, 2012.
[12] autogazette. Geringer Bekanntheitsgrad der Anbieter - Aral-Studie: Car-
sharing wenig attraktiv. http://www.autogazette.de/carsharing/
aral/unternehmen/aral-studie-carsharing-wenig-attraktiv-
434086.html, 2013.
[13] Automobilwoche. Prestigewert von Autos sinkt. http://www.
automobilwoche.de/article/20110829/DPA/308299998/1282/
prestigewert-von-autos-sinkt, 2011.
[14] Klaus Backhaus. Multivariate Analysemethoden: Eine anwendungsorientierte
Einf¨uhrung. Springer-Lehrbuch. Springer, Berlin [u.a.], 13 edition, 2011.
[15] K. Baehring, S. Hauff, M. Sossdorf, and K. Thommes. Methodologische
Grundlagen und Besonderheiten der qualitativen Befragung von Experten in
Unternehmen: Ein Leitfaden. Die Unternehmung, 62(1):89–111, 2008.
[16] Yves Balcer and Steven A. Lippman. Technological expectations and adoption
of improved technology. Journal of Economic Theory, 34(2):292–318, 1984.
[17] Adam Bannister. Britain’s Traffic Problems and Car-Sharing. Contemporary
Review, Vol. 286, No. 1668, 2005.](https://image.slidesharecdn.com/6e07fbad-1fc9-4865-930b-b3b2597817b7-150708184002-lva1-app6891/85/Seign_Dissertation-164-320.jpg)
![BIBLIOGRAPHY 149
[18] Jorge A. Barrios and Jean C. Doig. Fleet Sizing for Flexible Carsharing Sys-
tems: A Simulation-Based Approach. 93rd Annual Meeting Transportation Re-
search Board, Washington, D.C., 2014.
[19] Jorge Andres Barrios. Flexible Carsharing: Planning and Operation, Masters
Thesis, Graduate Division, Supervisor: Daganzo, Carlos, University of Califor-
nia, Berkeley, Berkeley, CA, 2011.
[20] Jorge Andres Barrios. On the Performance of Flexible Carsharing, In-
stitution of Civil Engineers New York Metropolitan Area Local Asso-
ciation. http://www.iceusa.org/GS1%20J%20A%20Barrios_On%20the%
20Performance%20of%20Flexible%20Carsharing.pdf, 2012.
[21] Christian Baumann. Service Design f¨ur flexible Fahrzeugnutzung, Bache-
lors Thesis, Supervisor: Naumann, Peter, Fakult¨at f¨ur Design, Hochschule
M¨unchen, Munich, 2013.
[22] Betsy Jane Becker. Regression - SPSS Regression Output, Michigan State Uni-
versity, 2004.
[23] Siegfried Behrendt. Car-sharing - Nachhaltige Mobilit¨at durch eigentumslose
Pkw-Nutzung? Fallstudie im Rahmen des Projektes Eco-services for sustainable
development in the European Union, volume 43. Werkstattbericht, IZT, Institut
f¨ur Zukunftsstudien und Technologiebewertung, Berlin, 2000.
[24] BeMobility. BeMobility – BeMobility –Berlin elektroMobil - Gemeinsamer
Abschlussbericht des Projektkonsortiums, 2011.
[25] Ralf Beste and Christian Schw¨agerl. Fahren statt besitzen, Der Spiegel. http:
//www.spiegel.de/spiegel/print/d-73107837.html, 2010.
[26] BMW. DriveNow - Kundenbefragung, Dezember 2011, BMW internal docu-
ment, BMW AG, Munich, 2011.
[27] BMW. Carsharing Mitgliederentwicklung, BMW internal document,
BMW AG, Munich, 2013.
[28] Klaus Bogenberger. Adaptive Fuzzy Systems for Traffic Responsive and Coor-
dinated Ramp Metering. Fachgebiet Verkehrstechnik und Verkehrsplanung der
Technischen Universit¨at M¨unchen, M¨unchen, 2001.](https://image.slidesharecdn.com/6e07fbad-1fc9-4865-930b-b3b2597817b7-150708184002-lva1-app6891/85/Seign_Dissertation-165-320.jpg)
![150 BIBLIOGRAPHY
[29] Klaus Bogenberger et. al. Planung von Elektromobilit¨at im Großraum M¨unchen.
(E-Plan M¨unchen) -Forschungsvorhaben zum Schaufensterprojekt ”Elektromo-
bilit¨at verbindet Bayern Sachsen“, Gesamtvorhabenbeschreibung, 2012.
[30] Susanne B¨ohler, Daniel Bongardt, Carolin Sch¨afer-Sparenberg, and Georg
Wilke. Zukunft des Car-Sharing in Deutschland - Schlussbericht, Wuppertal
Institut f¨ur Klima, Umwelt, Energie GmbH, Wuppertal, 2007.
[31] Andrea Bonfiglio. ExcelToDBF. http://exceltodbf.sourceforge.net/,
2009.
[32] Daniel Bongardt and Georg Wilke. Innovation and diffusion of car-sharing for
sustainable consumption and production of urban mobility. In Theo Geer Ken,
Arnold Tukker, Carlo Vezzoli, and Fabrizio Ceschin, editors, Sustainable Con-
sumption and Production: Framework for Action, pages 61–66. 2nd Conference
of the Sustainable Consumption Research Exchange (SCORE!) Network, Brus-
sels, Belgium, 10.-11.03.2008, 2008.
[33] Harry Bouwman, Henny de Vos, and Timber Haaker. Mobile service innovation
and business models. Springer, Berlin, 2008.
[34] M. Brandstotter, M. Haberl, R. Knoth, B. Kopacek, and P. Kopacek. IT on
demand-towards an environmental conscious service system for Vienna (AT),.
Environmentally Conscious Design and Inverse Manufacturing, EcoDesign’03.
2003 3rd International Symposium, 08.-11.12.2003, 2003.
[35] Stephen Walter Brown. Service quality: Multidisciplinary and multinational
perspectives. Lexington Books, Lexington and Mass, 1991.
[36] Bundesministerium f¨ur Umwelt Naturschutz und Reaktorsicherheit. EU-
Verordnung zur Verminderung der CO2 – Emissionen von Personenkraftwagen,
Bundesministerium f¨ur Umwelt, Naturschutz und Reaktorsicherheit, Berlin,
2009.
[37] Bundesministerium f¨ur Umwelt Naturschutz und Reaktorsicherheit. Umwelt-
bewusstsein in Deutschland 2012 - Ergebnisse einer repr¨asentativen
Bev¨olkerungsumfrage, Statista GmbH, Berlin. http://www.bmu.de/
fileadmin/Daten_BMU/Download_PDF/Umweltinformation_Bildung/
4396.pdf, 2013.](https://image.slidesharecdn.com/6e07fbad-1fc9-4865-930b-b3b2597817b7-150708184002-lva1-app6891/85/Seign_Dissertation-166-320.jpg)
![BIBLIOGRAPHY 151
[38] Bundesverband CarSharing e. V. Positionspapier Elektromobilit¨at und CarShar-
ing, Bundesverband CarSharing e. V., Berlin, 2012.
[39] Jon Burkhardt and Adam Millard-Ball. Who Is Attracted to Carsharing? Trans-
portation Research Record, 1986(1):98–105, 2006.
[40] R. D. Buzzell. Can you Standardize Multinational Marketing? Harvard Busi-
ness Review, November-December:102–113, 1968.
[41] Canadian Automobile Association. Driving Costs, Beyond the price tag: Un-
derstanding your vehicle’s expenses. http://www.caa.ca/docs/eng/CAA_
Driving_Costs_English.pdf, 2012.
[42] car2go. Home. https://www.car2go.com, 2013.
[43] car2go. Mehr Berlin mit mehr als 1200 car2go, car2go Deutschland GmbH.
https://www.car2go.com/de/berlin/, 2013.
[44] car2go Portland. Recent Posts by Others on car2go Portland, Face-
book Inc. https://www.facebook.com/car2go.Portland/posts/
552680234777981?comment_id=5796932&offset=0&total_comments=1,
2013.
[45] Carsharing US. Innovative Carsharing Program in Singapore Ends.
http://carsharingus.blogspot.de/2008/03/innovative-carsharing-
program-in.html, 2008.
[46] Ramon Casadesus-Masanell and Joan Enric Ricart. From Strategy to Business
Models and to Tactics, Harvard Business School, Cambridge, MA. http://
www.hbs.edu/research/pdf/10-036.pdf, 2009.
[47] S. T. Cavusgil and S. Zou. Marketing Strategy-Performance Relationship: An
Investigation of the Empirical Link in Export Market Ventures. Journal of Mar-
keting, 58:1–21, 1994.
[48] CBS. Torrance Eyes Controversial Car-Sharing Program, CBS Local Me-
dia. http://losangeles.cbslocal.com/2013/04/09/torrance-eyes-
controversial-car-sharing-program/, 2013.](https://image.slidesharecdn.com/6e07fbad-1fc9-4865-930b-b3b2597817b7-150708184002-lva1-app6891/85/Seign_Dissertation-167-320.jpg)
![152 BIBLIOGRAPHY
[49] Christine Celsor and Adam Millard-Ball. Where does carsharing work?: Using
geographic information systems to assess market potential. Transportation Re-
search Record: Journal of the Transportation Research Board, 1992(1):61–69,
2007.
[50] Robert Cervero, Nina Creedman, Madhav Pai, Muhammad Pohan, and Yu-Hsin
Tsai. City CarShare: Assessment of Intermediate-Term Travel-Behavior Im-
pacts. IURD Working Paper Series, Institute of Urban and Regional Develop-
ment, UC Berkeley, 2002.
[51] H. Chesbrough and R.S Rosenbloom. The role of the business model in cap-
turing value from innovation: evidence from Xerox Corporation’s technology
spin–off companies. Industrial and corporate change, 11(3):529–555, 2002.
[52] Henry Chesbrough. Business Model Innovation: Opportunities and Barriers.
Long Range Planning, 43(2-3):354–363, 2010.
[53] M. Chuttur. Overview of the Technology Acceptance Model: Origins, Develop-
ments and Future Directions, Indiana University. http://sprouts.aisnet.
org/785/1/TAMReview.pdf, 2009.
[54] Francesco Ciari. Estimation of Car-Sharing Demand Using an Activity-Based
Microsimulation Approach: Model Discussion and Preliminary Results, Con-
ference paper STRC 2010, Monte Verit`a; Ascona. http://www.strc.ch/
conferences/2010/Ciari.pdf, 2010.
[55] Francesco Ciari, Benno Bock, and Michael Balmer. Modeling Station-Based
and Free-Floating Carsharing Demand: A Test Case Study for Berlin, Germany.
93rd Annual Meeting Transportation Research Board, Washington, D.C., 2014.
[56] Michael R. Czinkota and Ilkka A. Ronkainen. International Marketing, vol-
ume 8. Thomson Learning, 2007.
[57] D’ Aveni. Hypercompetition. Vuibert, Paris, 1995.
[58] Daimler AG. 2 Jahre car2go in Hamburg: Mehr Autos und gr¨oßeres
Gesch¨aftsgebiet, Global Media Site, Daimler AG. http://media.daimler.
com/dcmedia/0-921-614319-49-1577274-1-0-1-0-0-0-11701-614319-
0-1-0-0-0-0-0.html, 2013.](https://image.slidesharecdn.com/6e07fbad-1fc9-4865-930b-b3b2597817b7-150708184002-lva1-app6891/85/Seign_Dissertation-168-320.jpg)
![BIBLIOGRAPHY 153
[59] Daimler AG. car2go startet in M¨unchen - Mia san hier, Daimler
AG. http://www.daimler.com/dccom/0-5-7153-49-1606941-1-0-0-0-
0-0-9293-0-0-0-0-0-0-0-0.html, 2013.
[60] Marco Dalan and Nikolaus Doll. Junge Deutsche verlieren Lust am teuren Auto,
Die Welt. http://www.welt.de/wirtschaft/article6755428/Junge-
Deutsche-verlieren-Lust-am-teuren-Auto.html, 2010.
[61] D. Ronald Daniel. Management Information Crisis. Harvard Business Review,
39(September-October):110–119, 1961.
[62] John M. Darley and James R. Beniger. Diffusion of Energy-Conserving Inno-
vations. Journal of Social Issues, 37(2):150–171, 1981.
[63] F. D. Davis, R. P. Bagozzi, and P. R. Warshaw. User Acceptance of Computer
Technology: A Comparison of Two Theoretical Models. Management Science,
35(8):982–1003, 1989.
[64] Michaela Denk. 7. Clusteranalyse - Multivariate Statistik f¨ur Betriebswirte,
Universit¨at Wien, Wien. homepage.univie.ac.at/michaela.denk/Clust.
pdf, 2013.
[65] Martyn Denscombe. The good research guide: For small-scale social research
projects. Open University Press, Maidenhead, 3 edition, 2007.
[66] Colin Dentel-Post. Less Parking, More Carsharing: Supporting Small-Scale
Transit-Oriented Development: Dissertation/Thesis. University of California,
Berkeley, Berkeley and CA, 2012.
[67] Manuel Dohr. car2go in Hamburg - Carsharing von Daimler und Europcar, Auto
Motor und Sport. http://www.auto-motor-und-sport.de/eco/car2go-
in-hamburg-carsharing-von-daimler-und-europcar-2856820.html,
2010.
[68] Claus Doll, Martin Gutmann, and Martin Wietschel. Integration von Elektro-
fahrzeugen in Carsharing- Flotten - Simulation anhand realer Fahrprofile, Fraun-
hofer ISI, Karlsruhe, 2011.
[69] DriveNow. DriveNow mit neuem Tarifmodell, DriveNow GmbH & Co.
KG. http://blog.drive-now.de/2013/02/28/drivenow-mit-neuem-
tarifmodell/, 2013.](https://image.slidesharecdn.com/6e07fbad-1fc9-4865-930b-b3b2597817b7-150708184002-lva1-app6891/85/Seign_Dissertation-169-320.jpg)
![154 BIBLIOGRAPHY
[70] DriveNow. Home, DriveNow GmbH & Co. KG. https://de.drive-now.
com/?language=de_DE&L=0, 2013.
[71] John Elkington. Partnerships from cannibals with forks: The triple bottom
line of 21st–century business. Environmental Quality Management, 8(1):37–
51, 1998.
[72] EnBW. Im Bau: 160 weitere Standorte f¨ur Ladestationen von Elek-
troautos in Stuttgart in 2012, EnBW Energie Baden-W¨urttemberg AG.
https://www.enbw.com/blog/stuttgart/2012/09/10/im-bau-160-
weitere-standorte-fur-ladestationen-von-elektroautos-in-
stuttgart-in-2012/, 2012.
[73] ESRI. ArcGIS Resources, An overview of the Measuring Geographic
Distributions toolset, ESRI. http://resources.arcgis.com/en/help/
main/10.1/index.html#/An_overview_of_the_Measuring_Geographic_
Distributions_toolset/005p00000014000000/, 2013.
[74] ESRI. ArcGIS Resources: How Exploratory Regression works.
http://resources.arcgis.com/en/help/main/10.1/index.html#//
005p00000054000000, 2013.
[75] eurisy. Autolib’: short-distance electric car rental network for the
Paris Region - Paris and the ˆıle-de-France Region manage an elec-
tric vehicle rental service using an innovative satnav application.
http://www.eurisy.org/index.php/satellite-benefits/good-
practices/item/191-autolib-short-distance-electric-car-
rental-network-for-the-paris-region.html, 2012.
[76] European Automobile Manufacturers Association. European Motor Vehicle
Parc 2010 - Vehicles in use (2005-2010). http://www.acea.be/images/
uploads/files/ANFAC_Report_2010_(2012).pdf, 2012.
[77] Adam Faiers, Matt Cook, and Charles Neame. Towards a contemporary ap-
proach for understanding consumer behaviour in the context of domestic energy
use. Energy Policy, 35(8):4381–4390, 2007.
[78] Marcus Felson and Joe L. Spaeth. Community structure and collaborative
consumption: A routine activity approach. American Behavioral Scientist,
21(4):614–624, 1978.](https://image.slidesharecdn.com/6e07fbad-1fc9-4865-930b-b3b2597817b7-150708184002-lva1-app6891/85/Seign_Dissertation-170-320.jpg)
![BIBLIOGRAPHY 155
[79] J¨org Firnkorn and Martin M¨uller. What will be the environmental effects of
new free-floating car-sharing systems? The case of car2go in Ulm. Ecological
Economics, 70(8):1519–1528, 2011.
[80] J¨org Firnkorn and Martin M¨uller. Selling Mobility instead of Cars: New Busi-
ness Strategies of Automakers and the Impact on Private Vehicle Holding. Busi-
ness Strategy and the Environment, 21(4):264–280, 2012.
[81] Martin Fishbein and Icek Ajzen. Belief, attitude, intention and behavior: An
introduction to theory and research. Addison-Wesley, Reading and Mass., 1975.
[82] Institute for Mobility Research (ifmo). Mobilitaet junger Menschen
im Wandel – multimodaler und weiblicher. http://www.ifmo.de/tl_
files/publications_content/2011/ifmo_2011_Mobilitaet_junger_
Menschen_de.pdf, 2011.
[83] Institute for Mobility Research (ifmo). Mobility Y – The Emerging Travel
Patterns of Generation Y. http://www.ifmo.de/tl_files/publications_
content/2013/ifmo_2013_Mobility_Y_en.pdf, 2013.
[84] Institute for Mobility Research (ifmo). Zukunft der Mobilitaet – Szenarien fuer
das Jahr 2030. http://www.ifmo.de/tl_files/publications_content/
2013/ifmo_2013_The_Future_of_Mobility_en.pdf, 2013.
[85] Guy Fournier, Manuel Baumann, and Ren´e Seign. Integration von Elektro-
fahrzeugen in ein Netz mit hohem Anteil an erneuerbaren Energien - M¨ogliche
¨okonomische und ¨okologische Auswirkungen. ZfAW - Zeitschrift f¨ur die
gesamte Wertsch¨opfungskette Automobilwirtschaft, pages 30–43, 2010.
[86] Guy Fournier, Henning Hinderer, Daniel Schmid, Ren´e Seign, and Manuel Bau-
mann. The new mobility paradigm: transformation of value chain and business
models. Enterprise and Work Innovation Studies, 8:9–40, 2012.
[87] Guy Fournier and Ren´e Seign. Mobilit¨at in Zukunft: Energieeffizienz als
Schl¨ussel? Technologie & Management, (3):46–48, 2009.
[88] Guy Fournier, Ren´e Seign, and V´eronique G¨ohlich. Carsharing with electric
vehicles: A contribution to sustainable mobility? Le R´eseau international
de recherche sur les Organisations et le D´eveloppement Durable, Nantes, 22.-
23.05.2012, 2012.](https://image.slidesharecdn.com/6e07fbad-1fc9-4865-930b-b3b2597817b7-150708184002-lva1-app6891/85/Seign_Dissertation-171-320.jpg)
![156 BIBLIOGRAPHY
[89] Guy Fournier, Ren´e Seign, V´eronique G¨ohlich, and Dominik W¨urzer. Car-
sharing mit Elektrofahrzeugen: Ein Beitrag zu unserer zuk¨unftigen Mobilit¨at?
Zeitschrift f¨ur die gesamte Wertsch¨opfungskette Automobilwirtschaft, 15(1):60–
68, 2012.
[90] Guy Fournier and Matthew Stinson. The Future Thinks Electric: Developing an
Electric Mobility Value Chain as a Foundation for a new Energy Paradigm. In
R. Briefly and Z. Turkalj, editors, Interdisciplinary Management Research VII,
pages 868–883. Osijek/Pforzheim, 2011.
[91] Fraunhofer-Institut f¨ur Arbeitswirtschaft und Organisation IAO. Strategien von
St¨adten zur Elektromobilit¨at - St¨adte als Katalysatoren auf dem Weg zur Mo-
bilit¨at der Zukunft,Fraunhofer-Institut f¨ur Arbeitswirtschaft und Organisation
IAO, Stuttgart, 2012.
[92] Christopher Freeman and Carlota Perez. Structural Crises of Adjustment, Busi-
ness Cycles and Investment Behaviour. In Giovanni Dosi, Christopher Freeman,
Richard Nelson, Gerald Silverberg, and Luc L. Soete, editors, Technical change
and economic theory, pages 38–61. Pinter, 1988.
[93] Alexander Frenzel Baudisch and Hariolf Grupp. Evaluating the market poten-
tial of innovations: A structured survey of diffusion models, Jenaer Schriften
zur Wirtschaftswissenschaft, Friedrich-Schiller-Universit¨at Jena, Jena. http:
//www.wiwi.uni-jena.de/Papers/wp-sw2106.pdf, 2006.
[94] Frost & Sulivan. Business Models and Opportunities in the European Tradi-
tional and Peer-to-Peer Carsharing Market - More than 200 Traditional and 24
Peer-to-Peer Carsharing Operators by 2015, Frost & Sulivan, Mountain View,
CA, 2012.
[95] Frost & Sulivan. Business Models and Opportunities in the North American
Traditional and Peer-to-Peer Carsharing Market - More than 50 Traditional and
Peer-to-Peer Carsharing Operators by 2015, Frost & Sulivan, Mountain View,
CA, 2012.
[96] Gabler Wirtschaftslexikon. Modell, Springer Fachmedien Wiesbaden
GmbH. http://wirtschaftslexikon.gabler.de/Definition/modell.
html, 2013.](https://image.slidesharecdn.com/6e07fbad-1fc9-4865-930b-b3b2597817b7-150708184002-lva1-app6891/85/Seign_Dissertation-172-320.jpg)
![BIBLIOGRAPHY 157
[97] Hubert Gatignon and Thomas S. Robertson. Technology Diffusion: An Empir-
ical Test of Competitive Effects. Journal of Marketing, 53(1):35–49, 1989.
[98] Infas Geodaten. HOME. http://www.infas-geodaten.de, 2012.
[99] GeoLytix. Home. http://geolytix.co.uk/, 2013.
[100] Pervez N. Ghauri and Philip R. Cateora. International marketing. McGraw-Hill
Education, Maidenhead, 2005.
[101] Bill Gillham. Research interviewing: A practical guide. Open Univ. Press,
Maidenhead [u.a.], 2005.
[102] J. Glaeser and G. Laudel. Experteninterviews und qualitative Inhaltanalyse,
volume 4. VS Verlag, Wiesbaden, 2010.
[103] M. Glotz-Richter, W. Loose, and C. Nobis. Car-Sharing als Beitrag zur L¨osung
von st¨adtischen Verkehrsproblemen. Internationales Verkehrswesen, pages
333–337, 2007.
[104] Google. Google Earth. http://www.google.de/intl/de/earth/, 2013.
[105] Markus Grabitz. Mobiles Carsharing – erste Zweifel an der ¨oko-Bilanz,
Stuttgarter Nachrichten,. http://www.stuttgarter-nachrichten.
de/inhalt.neue-mobilitaetskonzepte-mobiles-carsharing-
erste-zweifel-an-der-oeko-bilanz.77eb09fe-a671-4061-8b1b-
67463ef7f9bd.html, 2013.
[106] Green Cities California. San Diego’s Electric Vehicle Charging Net-
work. http://www.greencitiescalifornia.org/pages/san-diego-EV-
charging-network.html, 2013.
[107] D. D. Gremler. Service Blueprinting: Designing Service from the Cus-
tomer’s Point of View, Phonak Practice Development Conference, Center
for Service Leadership, W.P. Carey School of Business, Arizone State
University. http://www.phonakpro.com/content/dam/phonak/gc_us/
Documents/PracticeDevelopment/2011/Phonak_Service_Blueprint_
Slides_20111021.pdf, 2011.
[108] J. Hauschildt. Innovations Management. Verlag Vahlen, Munich, 1997.](https://image.slidesharecdn.com/6e07fbad-1fc9-4865-930b-b3b2597817b7-150708184002-lva1-app6891/85/Seign_Dissertation-173-320.jpg)
![158 BIBLIOGRAPHY
[109] Robert Henrich. car2go und Amsterdam unter Strom: 300 Elektro-Fahrzeuge
der Marke smart f¨ur car2go in der niederl¨andischen Metropole, Press Con-
ference Daimler AG, news aktuell. http://www.presseportal.de/pm/
68912/2024944/ots-audio-car2go-und-amsterdam-unter-strom-300-
elektro-fahrzeuge-der-marke-smart-fuer-car2go-in-der, 2011.
[110] Robert Henrich. Daimler Mobility Services Presentation, Automobilwoche
Konferenz 2013, 16.05.2013 M¨unchen, Crain Communications GmbH, 2013.
[111] Steffan Heuer. Interview mit Walter Rosenkranz, Technicity, Daimler AG.
http://technicity.daimler.com/interview-walter-rosenkranz/,
2013.
[112] R.E Holloway. Perceptions of an innovation: Syracuse university Project Ad-
vance. Dissertation Abstracts International, 39(02), 1977.
[113] Graham J. Hooley, Nigel Piercy, and Brigitte Nicolaud. Marketing strategy and
competitive positioning. FT Prentice Hall, Harlow and England and New York,
4 edition, 2008.
[114] S. Horner and J. Swarbrooke. Leisure Marketing: A Global Perspective. Else-
vier Butterworth-Heinemann, Oxford and UK, 2005.
[115] Yefang Huang and Yee Leung. Measuring regional inequality: a comparison of
coefficient of variation and Hoover concentration index. The Open Geography
Journal, 2:25–34, 2009.
[116] IBM. Frustration Rising: IBM Global Commuter Pain Survey, IBM.
http://www-03.ibm.com/press/us/en/attachment/35314.wss?
fileId=ATTACH_FILE1&fileName=Frustration%20Rising_IBM%202011%
20Commuter%20Pain%20Report.pdf, 2011.
[117] Intergovernmental Panel on Climate Change. Synthesis report 2007, Intergov-
ernmental Panel on Climate Change, Valencia, 2007.
[118] International Energy Agency. World Energy Outlook 2010 - Executive Sum-
mary, International Energy Agency (IEA), Paris, 2010.
[119] Mark W. Johnson, Clayton M. Christensen, and Henning Kagermann. Reinvent-
ing Your Business Model. Harvard Business Review, 86(12):50–59, 2008.](https://image.slidesharecdn.com/6e07fbad-1fc9-4865-930b-b3b2597817b7-150708184002-lva1-app6891/85/Seign_Dissertation-174-320.jpg)
![BIBLIOGRAPHY 159
[120] Markus Jordan. car2go will mit 300 smarts in M¨unchen starten, MB-
passion. http://blog.mercedes-benz-passion.com/2013/04/car2go-
will-mit-300-smarts-in-munchen-starten/, 2013.
[121] Daphne M. Keats. Interviewing: A practical guide for students and profession-
als. Open University, Buckingham, 2001.
[122] W. Kempton and J. Tomic. Vehicle-to-grid power fundamentals: Calculating
capacity and net revenue. Journal of Power Sources, pages 268–279, 2005.
[123] W. Kempton and J. Tomic. Using fleets of electric-drive vehicles for grid sup-
port. Journal of Power Sources, 168:459–468, 2007.
[124] W. Kempton, J. Tomic, S. Letendre, S. Brooks, and A. T. Lip. Vehicle-to-
Grid Power: Battery, Hybrid and Fuel Cell Vehicles as resources for Distributed
Electric Power in California. University of Callifornia, Davis CA, 2001.
[125] Ban Ki-moon. Secretary-General’s remarks to the World Economic Forum
Session on Redefining Sustainable Development, United Nations,New York.
http://www.un.org/apps/sg/sgstats.asp?nid=5056, 2011.
[126] David Klang, Maria Walln¨ofer, and Fredrik Hacklin. The Anatomy of the Busi-
ness Model: A Syntactical Review and Research Agenda. Opening Up Innova-
tion: Strategy, Organization and Technology, Imperial College, London Busi-
ness School, 16.-18.06.2010, London and UK, 2010.
[127] A. Koh. Relationship Among Organizational Characteristics, Marketing Strat-
egy and Export Performance. International Marketing Review, 8(3):46–60,
1991.
[128] Reinhard Kolke. Auto der Zukunft, Presentation at ADAC Verkehrsforum
Sankelmark 2012, Sankelmark, ADAC e.V., 20.10.2012, 2012.
[129] Katherine Kortum. Driving Smart: Carsharing Mode Splits and Trip Frequen-
cies. 93rd Annual Meeting Transportation Research Board, Washington, D.C.,
2014.
[130] Katherine Kortum and Randy B. Machemehl. Free-floating carsharing systems:
innovations in membership prediction, mode share, and vehicle allocation op-
timization methodologies. The University of Texas at Austin, Austin and TX,
2012.](https://image.slidesharecdn.com/6e07fbad-1fc9-4865-930b-b3b2597817b7-150708184002-lva1-app6891/85/Seign_Dissertation-175-320.jpg)
![160 BIBLIOGRAPHY
[131] Philip Kotler and Gary Armstrong. Principles of Marketing, volume 13. Pren-
tice Hall, New Jersey, 2010.
[132] Markus Kuhl. Infrastrukturtechnologien und -konzepte f¨ur die Elektromobilit¨at:
Eine St¨arken- und Schw¨achen-Analyse, Bachelors Thesis, Supervisor: Bogen-
berger, Klaus, Institut f¨ur Verkehrswesen und Raumplanung (IVR), Universit¨at
der Bundeswehr M¨unchen, Neubiberg, 2013.
[133] T. H. Kwon and R. W. Zmud. Unifying the fragmented models of information
systems implementation. In J. R. Boland and R. Hirshheim, editors, Critical
Issues in Information Systems Research, pages 227–251. New York: John Wiley,
1987.
[134] L. F. Lages and S. D. Jap. A Contingency approach to marketing mix adaptation
and peformance in international marketing relationships. Universidade Nova de
Lisboa, Lisboa, 2002.
[135] Martin Lanzendorf. Gewohnheitstier Mensch: Elektroautos haben es schwer,
Autohaus Online. http://www.autohaus.de/elektroautos-haben-es-
schwer-996328.html, 2010.
[136] Scott Le Vine, Aruna Sivakumar, Martin E. H. Lee-Gosselin, and John W. Polak.
The Market and Impacts of New Types of Carsharing Systems: Case Study of
Greater London, Presented at the 92nd Annual Meeting of the Transportation
Research Board,Washington D.C., 2013.
[137] Morgan Lee. Car2go opens auto charging depot - Daimler’s free-floating
electric car service advances in San Diego, The San Diego Union-Tribune.
http://www.utsandiego.com/news/2012/nov/29/car2go-opens-auto-
charging-depot/, 2012.
[138] Andreas Leo. Elektrisierender Start: car2go macht Amsterdam mobil, Daimler
AG. http://media.daimler.com/dcmedia/0-921-1193661-49-1435639-
1-0-0-0-0-0-11694-0-0-1-0-0-0-0-0.html, 2011.
[139] L. C. Leonidou, C. S. Katsikeas, and S. Samiee. Marketing Strategy Determi-
nants of Export Performance: A Meta-Analysis. Journal of Business Research,
55:51–67, 2002.](https://image.slidesharecdn.com/6e07fbad-1fc9-4865-930b-b3b2597817b7-150708184002-lva1-app6891/85/Seign_Dissertation-176-320.jpg)
![BIBLIOGRAPHY 161
[140] T. Levitt. The Globalization of Markets. Harvard Business Review, May-
June:92–102, 1983.
[141] M. A. Littrell and N. J. Miller. Marketing across cultures: Consumer’s percep-
tion of product complexity, familiarity, an compatibility. Journal of Marketing,
15(1):67–86, 2001.
[142] Willi Loose. Die Zukunft des Carsharing in Europa. Freiburg, 2007.
[143] Willi Loose. The State of European Car-Sharing. Bundesverband CarSharing
e. V., Berlin, 2010.
[144] Edwin Mansfield. Technical Change and the Rate of Imitation. Econometrica,
29(4):741–766, 1961.
[145] Nino Marchetti. car2go Adds Electric Car Sharing To Portland, Oregon,
EarthTechling. http://www.earthtechling.com/2012/07/car2go-adds-
electric-car-sharing-to-portland-oregon/, 2012.
[146] Philipp Mayring. Qualitative Inhaltsanalyse: Grundlagen und Techniken. Beltz
P¨adagogik. Beltz, Weinheim, 11 edition, 2010.
[147] Heribert Meffert and Manfred Bruhn. Dienstleistungsmarketing: Grundla-
gen, Konzepte, Methoden ; mit Fallstudien. Meffert-Marketing-Edition. Gabler,
Wiesbaden, 3 edition, 2000.
[148] T. C. Melewar and Suraksha Gupta. Strategic international marketing: An
advanced perspective. Palgrave Macmillan, Houndmills and Basingstoke and
Hampshire and New York, 2012.
[149] Andreas Menn. Internet - Teilen statt Kaufen, WirtschaftsWoche.
http://www.wiwo.de/technologie/forschung/internet-teilen-
statt-kaufen/5981700.html, 2012.
[150] Microsoft. Office - Excel, Microsoft Corporation. http://office.
microsoft.com/de-de/excel/, 2013.
[151] A. Millard-Ball, G. Murray, J. Ter Schure, C. Fox, and J. Burkhardt. Car-
Sharing: Where and how it succeeds. Transportation Research Board, 2005.](https://image.slidesharecdn.com/6e07fbad-1fc9-4865-930b-b3b2597817b7-150708184002-lva1-app6891/85/Seign_Dissertation-177-320.jpg)
![162 BIBLIOGRAPHY
[152] G. E. Mills. Action research: A Guide for the teacher researcher, volume 2.
Merrill/Prentice-Hall, Upper saddle River and NJ, 2003.
[153] William J. Mitchell. Going the extra mile to make mass transit more personal,
Architectural Record. http://archrecord.construction.com/features/
critique/0708critique-1.asp, 2007.
[154] Andreas Molitor. Carsharing - Heißer Kampf um die spontanen Kurzzeitnutzer,
Automotive Agenda, ZEIT ONLINE GmbH. http://www.zeit.de/auto/
2012-07/carsharing-berlin/seite-3, 2012.
[155] Gary C. Moore and Izak Benbasat. Development of an Instrument to Measure
the Perceptions of Adopting an Information Technology Innovation. Informa-
tion Systems Research, 2(3):192–222, 1991.
[156] Geoffrey A. Moore. Inside the Tornado: Marketing strategies from Silicon
Valley’s cutting edge. HarperBusiness, New York, 1 edition, 1995.
[157] Geoffrey A. Moore. Crossing the chasm: Marketing and selling high-tech prod-
ucts to mainstream customers. Collins business essentials. Collins Business,
New York, rev. edition, 2006.
[158] Henrik Mortsiefer. Carsharing - Jetzt auch elektrisch, Der Tagesspiegel.
http://www.tagesspiegel.de/wirtschaft/carsharing-jetzt-auch-
elektrisch/7671184.html, 2013.
[159] henrik Mortsiefer. Elektroautos im Carsharing: BMW setzt Drive-Now in
Berlin unter Strom, Der Tagesspiegel. http://www.tagesspiegel.de/
wirtschaft/elektroautos-im-carsharing-bmw-setzt-drive-now-in-
berlin-unter-strom/8304794.html, 2013.
[160] Peter Muheim and Partner Luzern. CarSharing-der Schl¨ussel zur kombinierten
Mobilit¨at: Mobilit¨atsmanagement. Eidgen. Drucksachen-und Materialzentrale
EDMZ, 1998.
[161] Peter Muheim and Ernst Reinhardt. Carsharing: the key to combined mobility.
World Transport Policy & Practice, 5(3), 1999.
[162] Juliane M¨uhling. Charging without searching: New car2go charg-
ing spots at Amsterdam Q-Park garages, Daimler AG. http:](https://image.slidesharecdn.com/6e07fbad-1fc9-4865-930b-b3b2597817b7-150708184002-lva1-app6891/85/Seign_Dissertation-178-320.jpg)
![BIBLIOGRAPHY 163
//media.daimler.com/dcmedia/0-921-1193661-1-1501006-1-0-1-
0-0-1-11701-854934-0-1-0-0-0-0-0.html, 2012.
[163] Holger M¨uller, Steffen Voigt, and Bernd Erichson. Befragungsbasierte Metho-
den zur Ermittlung von Preisresponsefunktionen: Preisbereitschaft oder Kauf-
bereitschaft? Series: Working paper series Otto von Guericke University
Magdeburg, Faculty of Economics and Management. http://www.ww.uni-
magdeburg.de/fwwdeka/femm/a2009_dateien/2009_27.pdf, 2009.
[164] Multicity. Home, Citro¨en Deutschland GmbH. https://www.multicity-
carsharing.de/, 2013.
[165] Multicity. So geht’s, Citro¨en Deutschland GmbH. https://www.multicity-
carsharing.de/so-gehts/, 2013.
[166] J¨org Nauke. Deckmantel - Kommentar zu car2go,Stuttgarter Zeitung.
http://www.stuttgarter-zeitung.de/inhalt.kommentar-zu-car2go-
deckmantel.9355254e-bd1b-440c-98ae-b710c0041ee5.html, 2012.
[167] Alexander Neubacher. Emissionshandel: Rettet die Welt mit Ver-
schmutzungsrechten!, Spiegel Online. http://www.spiegel.de/politik/
deutschland/oeko-fimmel-kauf-von-emissionszertifikaten-hilft-
der-umwelt-a-828760.html, 2012.
[168] Claudia Nobis. Car Sharing as a Key Contribution to Multimodal and Sus-
tainable Mobility Behavior – the Situation of Car Sharing in Germany, German
Aerospace Center – Institute of Transport Research, Berlin. http://elib.
dlr.de/22239/1/TRB_2006_CarSharing_Nobis_31032006.pdf, 2006.
[169] Oliver Wyman. Oliver Wyman-Studie Elektromobilit¨at 2025: Powerplay beim
Elektrofahrzeug. Oliver Wyman, 2009.
[170] Oliver Wyman. Automotive Manager I/2010. Oliver Wyman, 2010.
[171] A. Osterwalder. The business model ontology: A proposition in a design science
approach. Universit´e de Lausanne, Lausanne, 2004.
[172] A. Osterwalder, Y. Pigneur, and C.L Tucci. Clarifying business models: Ori-
gins, present, and future of the concept. Communications of the association for
Information Systems, 16(1):1–25, 2005.](https://image.slidesharecdn.com/6e07fbad-1fc9-4865-930b-b3b2597817b7-150708184002-lva1-app6891/85/Seign_Dissertation-179-320.jpg)
![164 BIBLIOGRAPHY
[173] Alexander Osterwalder and Yves Pigneur. Business model generation. Wiley,
Hoboken and NJ, 2010.
[174] Shanta Pandey and Gautam N. Yadama. Community Development Programs
in Nepal: A Test of Diffusion of Innovation Theory. Social Service Review,
66(4):582–597, 1992.
[175] Carlota Perez. Structural change and assimilation of new technologies in the
economic and social systems. Futures, 15(5):357–375, 1983.
[176] Malte Persike. Mathematische und Statistische Methoden I, Multiple Lineare
Regression - Kennwerte, Presentation Methodenlehre at Johannes Gutenberg-
Universit¨at Mainz, Mainz, 23.02.2012, 2012.
[177] Franz Pfluger. Elektromobilit¨at - Gr¨oßte deutsche Autoflotte ging am Don-
nerstag in Stuttgart an den Start. Eine Weltpremiere., Reutlinger General
Anzeiger. http://www.gea.de/nachrichten/wirtschaft/car2go+kommt+
nach+hause.2917590.htm, 2012.
[178] Betty Jane Punnett and David A. Ricks. International business. Blackwell,
Malden and Mass, 2 edition, 1997.
[179] Guido Reinking. BMW testet car2go, Automobilwoche. http:
//www.automobilwoche.de/article/20110122/REPOSITORY/110129980/
1057/bmw-testet-car-to-go, 2011.
[180] D. Remenyi. Doing research in business and management: An introduction to
process and method. SAGE, London, 1998.
[181] Emmanuelle Reynaud. Strat´egies d’entreprises en d´eveloppement durable.
´Ethique en contextes. L’Harmattan, Paris, 2010.
[182] James Richardson. The business model: an integrative framework for strategy
execution. Strategic Change, 17(5-6):133–144, 2008.
[183] Tanja Rieckmann. Neue Carsharing-Angebote: Hersteller wappnen sich gegen
Autofrust, Spiegel Online. http://www.spiegel.de/auto/aktuell/neue-
carsharing-angebote-hersteller-wappnen-sich-gegen-autofrust-
a-710515-druck.html, 2010.](https://image.slidesharecdn.com/6e07fbad-1fc9-4865-930b-b3b2597817b7-150708184002-lva1-app6891/85/Seign_Dissertation-180-320.jpg)
![BIBLIOGRAPHY 165
[184] Jeremy Rifkin and Birgit Neumann. Access: Das Verschwinden des Eigentums ;
warum wir weniger besitzen und mehr ausgeben werden. Campus-Verl., Frank-
furt/Main and New York, 2000.
[185] Colin Robson. Real world research: A resource for social scientists and
practitioner-researchers. Blackwell Publishers, Oxford and UK and and Mad-
den and Mass, 2 edition, 2002.
[186] Everett M. Rogers. Diffusion of innovations. Free Press, New York, 5 edition,
2003.
[187] Everett M. Rogers and F. Floyd Shoemaker. Communication of Innovations: A
Cross-Cultural Approach. Free Press, 1971.
[188] Roland Berger Strategy Consultants. Automotive Insights 2011, Automotive
Landscape 2025, Roland Berger Strategy Consultants, M¨unchen, 2011.
[189] Margaret Rouse. Framework: Definition, TechTarget. http://whatis.
techtarget.com/definition/framework, 2005.
[190] Christian Rudolph. Die Rolle der Kommunen bei Marktdurchdringungsszenar-
ien f¨ur Elektromobilit¨at. In Heike Proff, editor, Zuk¨unftige Entwicklungen in der
Mobilit¨at, pages 81–89. Gabler Verlag, Wiesbaden, 2012.
[191] Farzaneh Sakhdari. Vermarktung von CarSharing-Konzepten. Freie Universit¨at
Berlin, Berlin, 2005.
[192] S. Samiee, I. Jeong, J. H. Pae, and S. Tai. Advertising Standardization in Multi-
national Corporations: The Subsidiary Perspective. Journal of Business Re-
search, 56(8):613–626, 2003.
[193] S. Samiee and K. Roth. The influence of global marketing standardization on
performance. Journal of Marketing, 56(April):1–17, 1992.
[194] Wolfgang Schade, Anja Peters, Claus Doll, Stefan Klug, Jonathan K¨ohler, and
Michael Krail. VIVER-Vision f¨ur nachhaltigen Verkehr in Deutschland, Work-
ing paper sustainability and innovation, 2011.
[195] Christian Schendera. Clusteranalyse mit SPSS. Oldenbourg, R, M¨unchen, 1
edition, 2008.](https://image.slidesharecdn.com/6e07fbad-1fc9-4865-930b-b3b2597817b7-150708184002-lva1-app6891/85/Seign_Dissertation-181-320.jpg)
![166 BIBLIOGRAPHY
[196] Josef Schira. Statistische Methoden der VWL und BWL: Theorie und Praxis.
Wirtschaft. Pearson Studium, M¨unchen and Boston [u.a.], 2 edition, 2005.
[197] Caroline Schmalen, Matthias Kunert, and Hannes Weindlmaier. Erfolgsfak-
torenforschung: Theoretische Grundlagen, methodische Vorgehensweise und
Anwendungserfahrungen in Projekten f¨ur die Ern¨ahrungsindustrie. Wis-
senschaftszentrum der Technischen Universit¨at M¨unchen f¨ur Ern¨ahrung, Land-
nutzung und Umwelt, Freising, 2006.
[198] Stefan Schmid and Thomas Kotulla. The Debate on Standardization and Adap-
tation in International Marketing and Management Research - What Do We
Know, What Should We Know? ESCP Europe Working Paper, (50), 2009.
[199] Stefan Schm¨oller and Klaus Bogenberger. Analyzing External Factors on the
Spatial and Temporal Demand of Car Sharing Systems. EWGT2013 – 16th
Meeting of the EURO Working Group on Transportation, 2013.
[200] Michael Schrage. Michael Schrage on Innovation. http://ubiquity.acm.
org/article.cfm?id=1040565, 2004.
[201] Joseph Alois Schumpeter. Konjunkturzyklen: Eine theoretische, historische und
statistische Analyse des kapitalistischen Prozesses. Vandenhoeck und Ruprecht,
G¨ottingen, 1961.
[202] Thomas Schuster, John Byrne, James Corbett, and Yda Schreuder. Assessing
the Potential Extent of Carsharing: A New Method and Its Implications. Trans-
portation Research Record, 1927(1):174–181, 2005.
[203] Bodo Schwieger. Second generation car-sharing: Developing a new mobil-
ity services target groups and service characteristics. S¨udwestdt. Verl. f¨ur
Hochschulschriften, Saarbr¨ucken, 2011.
[204] Lauren Scott and Monica Pratt. Answering Why Questions: An introduction
to using regression analysis with spatial data. ArcUser (ESRI), (Spring):40–43,
2009.
[205] Ren´e Seign. Integration von Elektrofahrzeugen in Carsharing-Konzepte: Strate-
gische Analyse, generische Gesch¨aftsmodellierung und Vorschl¨age zur Imple-
mentierung, Bachelors Thesis, Supervisor: Fournier, Guy, Fakult¨at f¨ur Technik,
Hochschule Pforzheim, Pforzheim, 2011.](https://image.slidesharecdn.com/6e07fbad-1fc9-4865-930b-b3b2597817b7-150708184002-lva1-app6891/85/Seign_Dissertation-182-320.jpg)
![BIBLIOGRAPHY 167
[206] Ren´e Seign. Business Models for the Diffusion of Innovation: Understanding
the Adoption of Carsharing with Electric Vehicles, Masters Thesis, Supervisors:
Theyel, Gregory, and Heffernan, Paul, Department of Engineering, Institute for
Manufacturing, University of Cambridge, Cambridge, UK, 2012.
[207] Ren´e Seign and Klaus Bogenberger. Prescription for the Successful Diffusion
of Carsharing with Electric Vehicles. Presentation at the Conference on Future
Automotive Technology. Focus Electromobility., TU M¨unchen, 18.03., 2013.
[208] Ren´e Seign and Klaus Bogenberger. Model-Based Design of Free-Floating Car-
sharing Systems. SUBMITTED FOR: TRB 94th Annual Meeting, 2015.
[209] Ren´e Seign, Maximilian Sch¨ussler, and Klaus Bogenberger. Modelling the
Business/Operating Area of Free-Floating Carsharing Systems. Presentation at
hEART 2013 – 2nd Symposium of the European Association for Research in
Transportation, Stockholm, 04.-06.09., 2013.
[210] Ren´e Seign, Maximilian Sch¨ussler, and Klaus Bogenberger. Enabling Sustain-
able Transportation: The Model-Based Determination of Business/Operating
Areas of Free-Floating Carsharing Systems. SUBMITTED FOR: Special Issue
on ”Austerity and Sustainable Transportation” of RETREC, 2014.
[211] Senatsverwaltung f¨ur Stadtentwicklung und Umwelt. Pressebox / Meldun-
gen: EU-weite Ausschreibung der Ladeinfrastruktur f¨ur Elektrofahrzeuge ges-
tartet. http://www.stadtentwicklung.berlin.de/aktuell/pressebox/
archiv_volltext.shtml?arch_1210/nachricht4806.html, 2013.
[212] Susan A. Shaheen and Adam P. Cohen. Worldwide Carsharing Growth: An In-
ternational Comparison. Transportation Research Record: Journal of the Trans-
portation Research Board 1992.1 (2007), pages 81–89, 2007.
[213] Susan A. Shaheen and Adam P. Cohen. Carsharing and Personal Vehicle Ser-
vices: Worldwide Market Developments and Emerging Trends. International
Journal of Sustainable Transportation, 7(1):5–34, 2013.
[214] Susan A. Shaheen, Mark A. Mallery, and Karla J. Kingsley. Personal vehicle
sharing services in North America. Research in Transportation Business &
Management, 3:71–81, 2012.
[215] R. Shanker. Services Marketing, volume 6. Excel Books, New Delhi, 2008.](https://image.slidesharecdn.com/6e07fbad-1fc9-4865-930b-b3b2597817b7-150708184002-lva1-app6891/85/Seign_Dissertation-183-320.jpg)
![168 BIBLIOGRAPHY
[216] Jung P. Shim, Merrill Warkentin, James F. Courtney, Daniel J. Power, Ramesh
Sharda, and Christer Carlsson. Past, present, and future of decision support
technology. Decision support systems, 33(2):111–126, 2002.
[217] A. Shoham. Marketing-Mix Standardization: Determinants of Export Perfor-
mance. Journal of Global Marketing, 10(2):53–74, 1996.
[218] Paul Shrivastava. Environmental technologies and competitive advantage.
Strategic Management Journal, 16(S1):183–200, 1995.
[219] SpatialInsights. US Data Products. http://www.spatialinsights.com/
catalog/default.aspx?category=9, 2013.
[220] Alexander Spickermann, Volker Grienitz, and von der Gracht, Heiko A. Head-
ing towards a multimodal city of the future? Technological Forecasting and
Social Change, 2013.
[221] R. Srinivasan. Services Marketing: The Indian Context, volume 3. PHI Learning
Pvt. Ltd, New Delhi, 2002.
[222] Stadt G¨utersloh Fachbereich Umweltschutz. Verschiedene Parktypen und Ver-
sorgungswerte: Naherholung - Quantitative Freiraumversorgung. http://
geodaten.guetersloh.de/fpp_typo3/index.php?id=64, 2013.
[223] Patrick St¨ahler. Business Models as an Unit of Analysis for Strategizing. Uni-
versit¨at St. Gallen, St. Gallen, 2002.
[224] Statista Planung&Analyse. Carsharing - Gr¨unde gegen die Nutzung,
Statista GmbH. http://de.statista.com/statistik/daten/studie/
169936/umfrage/gruende-gegen-die-nutzung-von-carsharing-in-
deutschland/, 2011.
[225] Karl Steininger, Caroline Vogl, and Ralph Zettl. Car-sharing organizations: The
size of the market segment and revealed change in mobility behavior. Transport
Policy, 3(4):177–185, 1996.
[226] Martina Stemmer. Gr¨uner Traum vom Carsharing in Wien geplatzt, derStan-
dard.at,. http://derstandard.at/1361240471707/Gruener-Traum-vom-
Carsharing-in-Wien-geplatzt, 2013.](https://image.slidesharecdn.com/6e07fbad-1fc9-4865-930b-b3b2597817b7-150708184002-lva1-app6891/85/Seign_Dissertation-184-320.jpg)
![BIBLIOGRAPHY 169
[227] Tai Stillwater, Patricia L. Mokhtarian, and Susan A. Shaheen. Carsharing and
the Built Environment. Transportation Research Record: Journal of the Trans-
portation Research Board, 2110(-1):27–34, 2009.
[228] Ruth Stock-Homburg and Harley Krohmer. Internationale Markenstandard-
isierung: ganz oder gar nicht? - Eine Untersuchung nichtmonotoner Wirkungs-
beziehungen. Journal of business economics, 77(10):1065–1091, 2007.
[229] F.L Stoller. The diffusion of innovations in intensive ESL programs. Applied
Linguistics, 15(3):300–327, 1994.
[230] Dawn Story and Trevor J. Price. Corporate social responsibility and risk man-
agement. Journal of Corporate Citizenship, 2006(22):39–51, 2006.
[231] S¨udwest Presse. Car2go erh¨oht den Fahrpreis in Ulm sp¨urbar, S¨udwest Presse
Online-Dienste GmbH. http://www.swp.de/ulm/lokales/ulm_neu_ulm/
Car2go-erhoeht-den-Fahrpreis-in-Ulm-spuerbar;art4329,1614585,
2012.
[232] Alex Sutherland and Tiffany Bergin. Joint Schools’ Social Science M4 -Linear
Regression Analysis I, University of Cambridge Judge Business School, Cam-
bridge, UK, 2012.
[233] A. Tapaninen. Characteristics of innovation: A customer-centric view
to adoption barriers of the wood pellet heating system, EuroMOT
2008, The Third European Confrence on Management of Technlol-
ogy & Innovation, Nice - Sophia Antipolis, France, 17 -19.09.2008.
http://webintec.ceram.fr/euromot2008/conftool/uploads/498/2-
EuroMOT2008_FINAL_version_2008-08-14.pdf, 2008.
[234] David J. Teece. Business Models, Business Strategy and Innovation: Business
Models. Long Range Planning, 43(2–3):172–194, 2010.
[235] teilAuto. Carsharing auf dem Dorf –geht das denn?, LUBW Lan-
desanstalt f¨ur Umwelt, Messungen und Naturschutz Baden-W¨urttemberg.
http://www.lubw.baden-wuerttemberg.de/servlet/is/78314/2011_
05_17_kurz_tuebingen.pdf?command=downloadContent&filename=
2011_05_17_kurz_tuebingen.pdf, 2011.](https://image.slidesharecdn.com/6e07fbad-1fc9-4865-930b-b3b2597817b7-150708184002-lva1-app6891/85/Seign_Dissertation-185-320.jpg)
![170 BIBLIOGRAPHY
[236] The Automobile Association. Motoring Costs 2013. http://www.
theaa.com/resources/Documents/pdf/motoring-advice/running-
costs/petrol2013.pdf, 2013.
[237] TheFreeDictionary. Framework. http://www.thefreedictionary.com/
framework, 2013.
[238] TheFreeDictionary. Model. http://www.thefreedictionary.com/model,
2013.
[239] Louis G. Tornatzky and Katherine J. Klein. Innovation characteristics and inno-
vation adoption-implementation: A meta-analysis of findings. IEEE Transac-
tions on Engineering Management, 29(1), 1982.
[240] T ¨UV Rheinland. Weltweite T¨uV Rheinland-Studie zu Elektromo-
bilit¨at: China und Indien fahren auf Hochvolttechnik ab, T¨uV Rheinland.
http://www.tuv.com/de/deutschland/ueber_uns/presse/meldungen/
newscontentde_66048.html, 2011.
[241] UBS. Preise und L¨ohne: Ein Kaufkraftvergleich rund um die Welt, UBS AG
CIO WM Research, Z¨urich. http://bit.ly/QoDlXQ, 2012.
[242] United Nations. World Urbanization Prospects: The 2009 Revision, United
Nations, New York, 2010.
[243] University of Li`ege and London Business School. Factors of the deci-
sion on the international product policy - Nature of the product, SME
and Entrepreneurship Research Centre of the University of Li`ege - Lon-
don Business School. http://www.eur-export.com/anglais/apptheo/
marketing/produit/natureproduita.htm, 2001.
[244] Unternehmen. car2go Elektroflotte in Ulm wird um 20 Fahrzeuge aufge-
stockt, S¨udwest Presse. http://www.swp.de/unternehmen/news/Car2go-
Fahrzeug-Nachfrage-San-Diego-Neu-Ulm-Amsterdam-Stuttgart-
Berlin-Ulm;art1168007,1464016, 2012.
[245] Peter H. van Westendorp. NSS – Price Sensitivity Meter (PSM) – A new ap-
proach to study consumer perception of price. Proceedings of the ESOMAR
Congress, 1976.](https://image.slidesharecdn.com/6e07fbad-1fc9-4865-930b-b3b2597817b7-150708184002-lva1-app6891/85/Seign_Dissertation-186-320.jpg)
![BIBLIOGRAPHY 171
[246] Viswanath Venkatesh and Hillol Bala. Technology Acceptance Model 3 and a
Research Agenda on Interventions. Decision Sciences, 39(2):273–315, 2008.
[247] C. Vignali. McDonald’s: think global, act local - marketing mix. British Food
Journal, 103(2):97–111, 2001.
[248] T. V¨ollink, R. Meertens, and C. Midden. Innovating ’Diffusion of Innovation’
Theory: Innovation Characteristics and the Intention of Utility Companies To
Adopt Energy Conservation Interventions. Journal of Environmental Psychol-
ogy, 22(4):333–344, 2002.
[249] D. Vrontis. Integrating Adaptaion and Standardisation in Internaional Market-
ing. Journal of Marketing Management, 19(3 & 4):283–305, 2003.
[250] D. Vrontis. The Creation of the AdaptStand Process in International Marketing.
Innovative Marketing, 1(2):7–21, 2005.
[251] Demetris Vrontis and Alkis Thrassou. Adaptation Vs. Standardization In In-
ternational Marketing - The Country of Origin Effect. Innovative Marketing,
3(4):1–21, 2007.
[252] Eric Waarts, Yvonne M. van Everdingen, and Jos van Hillegersberg. The dy-
namics of factors affecting the adoption of innovations. Journal of Product
Innovation Management, 19(6):412–423, 2002.
[253] Bryan Walsh. Todays Smart choice: Dont Own-Share. http:
//content.time.com/time/specials/packages/article/0,28804,
2059521_2059717_2059710,00.html, 2011.
[254] Simone Weikl and Klaus Bogenberger. Relocation Strategies and Algorithms
for free-floating Car Sharing Systems, Presentation at the 15th International
IEEE Conference on Intelligent Transportation Systems, Anchorage, AK, 16.-
19.09.2012, 2012.
[255] Simone Weikl and Klaus Bogenberger. Relocation Strategies and Algorithms for
Free-Floating Car Sharing Systems. IEEE Intelligent Transportation Systems
Magazine, 5(4):100–111, 2013.
[256] Martin L. Weitzman. The share economy: Conquering stagflation. Harvard
University Press, Cambridge and Mass, 1984.](https://image.slidesharecdn.com/6e07fbad-1fc9-4865-930b-b3b2597817b7-150708184002-lva1-app6891/85/Seign_Dissertation-187-320.jpg)
![172 BIBLIOGRAPHY
[257] Barbara Wejnert. Integrating Models of Diffusion of Innovations: A Conceptual
Framework. Annual Review of Sociology, 28(1):297–326, 2002.
[258] M. Wietschel, E. D¨utschke, U. Schneider, P. Pl¨otz, A. Peters, A. Roser,
and J. Globisch. Kaufpotenzial f¨ur Elektrofahrzeuge bei sogenannten Early
Adoptern. Endbericht, Fraunhofer-Institut f¨ur System-und Innovations-
forschung (ISI) und IREES GmbH Institut f¨ur Ressourceneffizienz und Energies-
trategien, 2012.
[259] Wikipedia. Bolkerstraße, Wikimedia Foundation Inc.,. http://de.
wikipedia.org/wiki/Bolkerstra%C3%9Fe, 2013.
[260] Wikipedia. Diffusion of Innovations, Wikimedia Foundation Inc.,. http://
http://en.wikipedia.org/wiki/Diffusion_of_innovations, 2014.
[261] Uri Wilensky. NetLogo, Center for Connected Learning and Computer-
Based Modeling, Northwestern University, Evanston, IL. http://ccl.
northwestern.edu/netlogo/, 1999.
[262] Robert K. Yin. Case study research: Design and methods. Sage Publications,
Los Angeles and Calif, 4 edition, 2009.
[263] Gerald Zaltman. Innovations and organizations. John Wiley & Sons Inc, New
York, 1973.
[264] Bin Zhou and Kara M. Kockelman. Opportunities for and impacts of carsharing:
A survey of the Austin, Texas market. International Journal of Sustainable
Transportation, 5(3):135–152, 2011.
[265] Zipcar. Third-Quarter Statement 2012. http://ir.zipcar.com/
releasedetail.cfm?ReleaseID=719904, 2012.
[266] C. Zott, R. Amit, and L. Massa. The business model: Theoretical roots, recent
developments, and future research, IESE Business School. http://www.iese.
edu/research/pdfs/DI-0862-E.pdf, 2010.](https://image.slidesharecdn.com/6e07fbad-1fc9-4865-930b-b3b2597817b7-150708184002-lva1-app6891/85/Seign_Dissertation-188-320.jpg)
![Appendix A
Structuring Carsharing Systems:
Illustrations on the Carsharing
Business Model, Blueprint, and
Service Marketing Mix
Key Partners Key Activities
Key Resources
Value Propositions Customer Relationships Customer Segments
Channels
Cost Structure Revenue Streams
City Dwellers
One-off sign-up at
Post-Offices or in
London
Underground
Website
Smartphone (compatible
with Apple, Android, etc)
Pick-up / drop-off
anywhere legal
Pay-per minute
£0.29 (all inclusive)
Individual urban
mobility without car
ownership
Systems
Management Fleet Management
Service team
Telematic Systems
Modern Electric Car
Fleet
Fleet Managment
Telematics
Management
Cleaning
Greater London
Authority
Early Adopters
Target Market
London (7.8 mio
population, density
4,978 /km2, 1,300
charging stations by
2013, good public
transportation,
cycling-network,
walkability, etc etc)
Boroughs
Transport for London
Payment with
Oyster-card,
reduced fee if trip in
combination with
public transportationNo registration cost
Multimodal
integration in TfL
services
24/7 availability in
under 300m walking
distance
Reserved parking
spots at Shell gas
stations + charging
stations
Shell
Post offices
Customer Support
Hassle-free,
charging is done by
provider if <60%
Facebook-Events
City-tailored Marketing,
focus on early adopters
(sponsoring of London
Marathon, free iPhone
cases with logo)
Integration of
London-Heathrow in
operating area
Heathrow Airport
British Gas
Boroughs in Inner
London as operating
area
Figure A.1: Simplified and Exemplary Business Model Canvas for a Free-Floating
Carsharing Systems in London (Adopted from [173])
173](https://image.slidesharecdn.com/6e07fbad-1fc9-4865-930b-b3b2597817b7-150708184002-lva1-app6891/85/Seign_Dissertation-189-320.jpg)
![174 APPENDIX A. STRUCTURING CARSHARING SYSTEMS
Line of interaction
Onstage
technology
Customer
action
Physical
evidence
Contact
employee
onstage
Contact
employeeor
technology
backstage
Support
processes
Line of visibility
Line of
internal
interaction
Offer
individual
urban
mobility
without car
ownership
Need for
urban
mobility
without car
ownership
Register
for
carsharing
Online
form on
website
Provide cars
and ICT
Purchase e-cars
Retrofit hardware for
information & communication
technology (ICT)
Integrate ICT
Insure cars
Appearance of website, shops, equipment, app, service
team, membership card
Got to shop
& receive
member-
ship card/ID
Technical ID
system
Member-
ship card
Verify
personal info
Hand out ID
Prepare
membership
contract
Maintain
stock of IDs
Operations
& Sales
Download
app & look
for cars
near by
On-going monitoring of information (location, battery level, cleanliness, …)
Customer
service
Provide &
maintain booking
platform/ customer
portal
Provide easy car
access
Provide complaint
management
Forecast
mobility &
power needs
Estimate price
options
Publish
contracts,
terms &
conditions
Training
Availability for incoming calls, e-mails, face-to-face help
“Emergency” procedure
Manage necessary repairs, warranty, charging
Book,
find car,
and
unlock it
Check (clean,
battery level,
damage
Use &
charge
e-car
Park
and
lock
e-car
Pay-per-
minute &
receive
invoice
Appearance of e-car (interior & exterior)
“Emergency” hotline
Technician/service team picks up car in
case of accident/damage
Fleet management
Charging
Cleaning
Driving experience
Profession
alism of
mailing
Invoice
via e-
mail,
charging
of credit
card
Prepare
and send
out
invoice/
mailing
Optimize
service
Find key
partners for
cooperation
Invoicing
Invoice usage
Manage
monetary
returns,
complaints,
claims & cross
settlements
(promotions,
discounts, ...)
Target-performance
comparison
Dispose cars according
to customer needs
Manage warranty &
repair services
Website
(layout,
usability)
On-board
questionnaire
Voice-in service
Figure A.2: Exemplary Service Blueprint for Carsharing. Based on Gremler’s Six
Components. [107]](https://image.slidesharecdn.com/6e07fbad-1fc9-4865-930b-b3b2597817b7-150708184002-lva1-app6891/85/Seign_Dissertation-190-320.jpg)
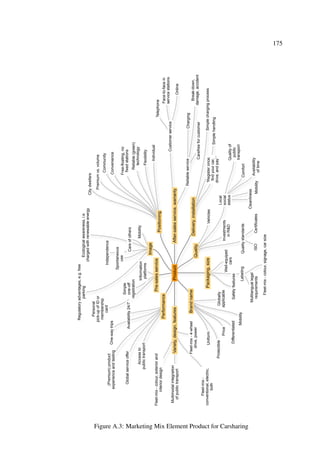
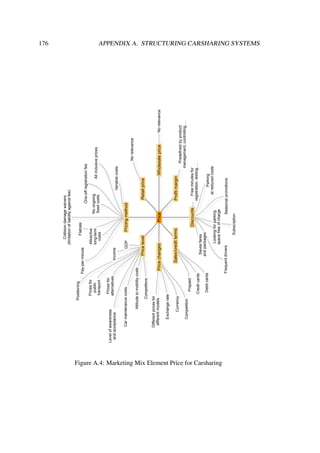
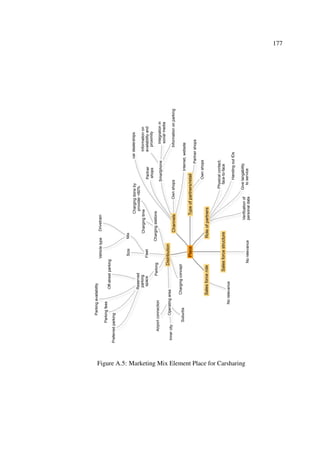
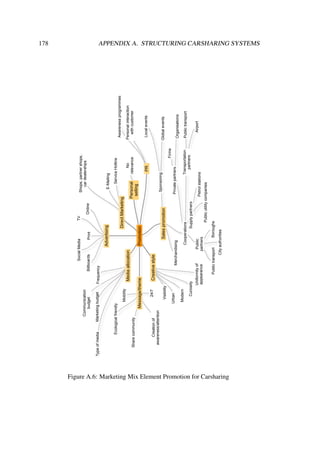
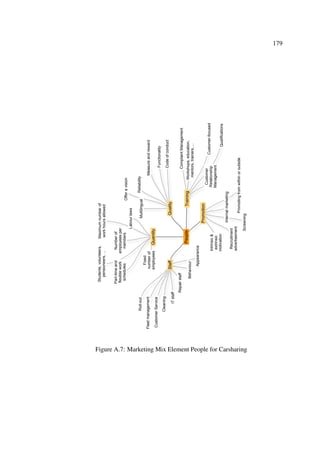
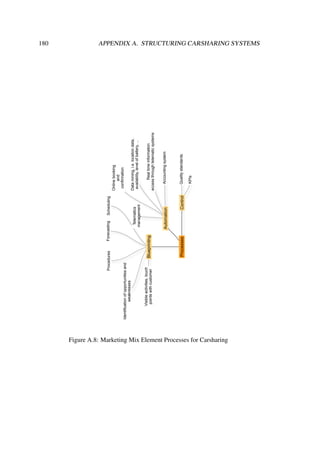
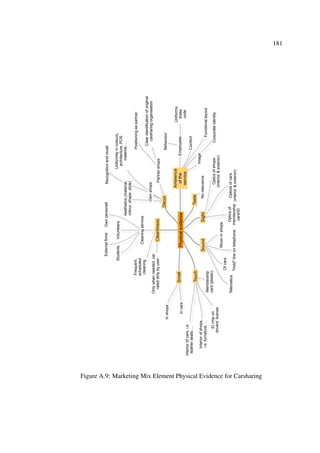
![Appendix B
Overview of Selected Literature on
Standardization and Adaptation
Table B.1: Overview of Selected Articles on Standardization and Adaptation.
Adapted from [198]; own adjustments.
Source Approach and Theo-
retical Basis
Theoretical Conclusion
Koh
(1991) [127]
Quantitative testing of
US exporters regard-
ing:
• Product
• Price
• Place
• Promotion
Exporters, who are formally trained in in-
ternational business, tend to charge higher
prices for products exported than for
sales in the domestic market. An often-
modified product line leads to a higher
perceived profitability. Adaptation to for-
eign market needs in terms of distribu-
tion and promotion is recommended due
to differences in product usage, language
and culture, and channel access.
Samiee
and Roth
(1992) [193]
Quantitative testing
of:
• Product
• Price
• Place
• Promotion
In the absence of cross-national market
segments, MNCs have to adapt their mar-
keting strategies to foreign countries in
order to discriminate prices and increase
customer loyalty.
182](https://image.slidesharecdn.com/6e07fbad-1fc9-4865-930b-b3b2597817b7-150708184002-lva1-app6891/85/Seign_Dissertation-198-320.jpg)
![183
Table B.1: Continued
Source Approach and Theo-
retical Basis
Theoretical Conclusion
Cavusgil
and Zou
(1994) [47]
Quantitative testing
of:
• Product
• Promotion
MNCs have to adapt their products and
communication to foreign countries in
the situation of high international compe-
tence.
Shoham
(1996) [217]
Quantitative testing of
US exporters regard-
ing:
• Product
• Price
• Place
• Promotion
MNCs have to adapt their marketing
strategies to foreign countries in order to
reduce friction between headquarters and
foreign subsidiaries.
Littrell
and Miller
(2001) [141]
Rogers’ Diffusion the-
ory
MNCs have to adapt innovative products
to foreign markets in order to decrease
consumers’ perceived complexity of the
products and to increase consumers’ per-
ceived familiarity and compatibility with
the products.
Vignali
(2001) [247]
Analysis of McDon-
ald’s global marketing
mix (7Ps)
Globalized organizations employ stan-
dardized products, promotional cam-
paigns, prices, and distribution channels
for all markets as if the world is one single
entity. Brand name, product characteris-
tics, packaging, and labeling are the easi-
est elements to be standardized. However,
adjusting the marketing mix becomes vi-
tal in order to suit local tastes and meet
special needs.](https://image.slidesharecdn.com/6e07fbad-1fc9-4865-930b-b3b2597817b7-150708184002-lva1-app6891/85/Seign_Dissertation-199-320.jpg)
![184 APPENDIX B. LITERATURE ON STANDARDIZATION AND ADAPTATION
Table B.1: Continued
Source Approach and Theo-
retical Basis
Theoretical Conclusion
Leonidou et al
(2002) [139]
Literature review of
articles and studies
that assess export
performance measure-
ments
MNCs should adapt their international
price levels, because export performance
is strongly depending on pricing prac-
tices of competitors, purchasing power in
the foreign country, costs of production,
promotion, and transportation, as well as
margins of distribution channels.
Lages and Jap
(2002) [134]
Quantitative testing
of Portuguese and
Brazilian firms and
theoretical consolida-
tion:
• Product
• Price
• Place
• Promotion
MNCs standardize their products to offer
competitive goods in export markets due
to economies of scale. By adapting price,
promotion, and place to differences in
the political-legal, economic, and socio-
cultural environment to any host country,
firms can improve their performance sig-
nificantly.
Vrontis
(2003,
2005) [249,
250]
Qualitative testing of
UK firms:
• Product
• Price
• Place
• Promotion
• People
• Processes
• Physical Evi-
dence
MNCs have to standardize their products
in order to achieve uniformity in image,
economies of scale, and consistency with
consumers, as well as improved planning
and controlling. Other elements have to
be adapted to meet the differences that
exist in the foreign country. The degree
of standardization of the service focused
Ps has to be balanced to ensure flexibility,
but also the offering of a universal appeal.](https://image.slidesharecdn.com/6e07fbad-1fc9-4865-930b-b3b2597817b7-150708184002-lva1-app6891/85/Seign_Dissertation-200-320.jpg)
![185
Table B.1: Continued
Source Approach and Theo-
retical Basis
Theoretical Conclusion
Stock-
Homburg
and Krohmer
(2007) [228]
Quantitative test-
ing across various
branches for con-
sumer goods in
Germany
MNCs have to standardize their brands
across nations in order to reduce con-
sumer’s uncertainty, to enhance a unified
brand image, high brand recognition, and
price advantages. Only a relatively high
degree of standardization can lead to pos-
itive effects on a brand. Remaining below
this certain degree means effects on the
brand will be negative.](https://image.slidesharecdn.com/6e07fbad-1fc9-4865-930b-b3b2597817b7-150708184002-lva1-app6891/85/Seign_Dissertation-201-320.jpg)
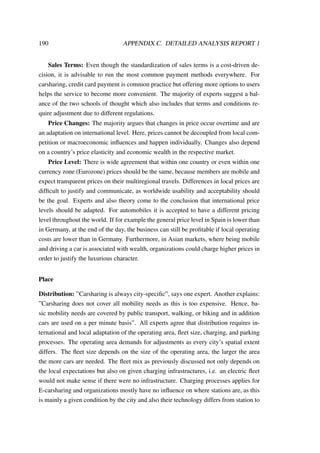
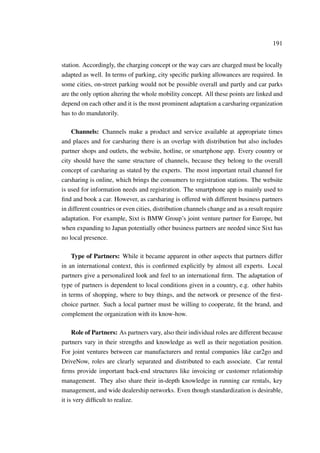
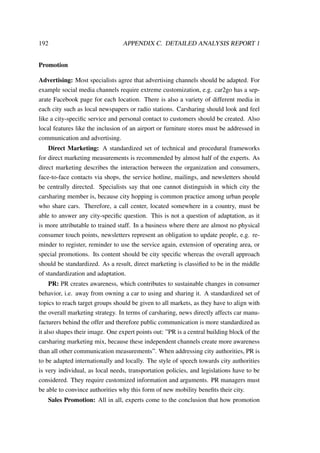


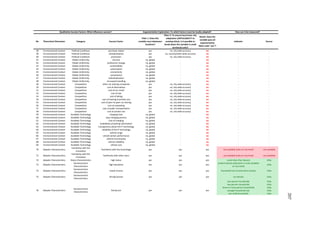
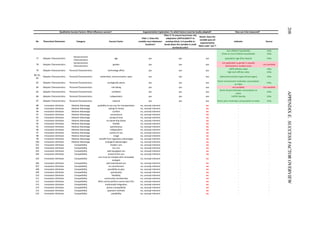
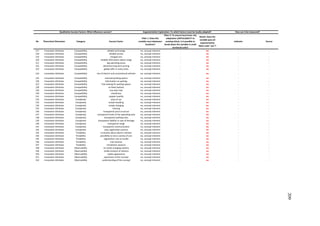

![R² = 0.1104
0
5,000
10,000
15,000
20,000
25,000
30,000
35,000
40,000
0 5,000 10,000 15,000 20,000 25,000 30,000 35,000 40,000 45,000 50,000
BookingDensity[km²]
Population Density [km²]
Berlin
München
Linear (Combined)
R² = 0.0118
0
5,000
10,000
15,000
20,000
25,000
30,000
35,000
40,000
0 500 1,000 1,500 2,000 2,500 3,000 3,500
BookingDensity[km²]
Absolute Population [per tract]
Berlin
München
Linear (Combined)
R² = 0.2004
0
5,000
10,000
15,000
20,000
25,000
30,000
35,000
40,000
0 2,000 4,000 6,000 8,000 10,000 12,000 14,000
BookingDensity[km²]
Company Density [km²]
Berlin
München
Linear (Combined)
211](https://image.slidesharecdn.com/6e07fbad-1fc9-4865-930b-b3b2597817b7-150708184002-lva1-app6891/85/Seign_Dissertation-227-320.jpg)
![R² = 0.0004
0
5,000
10,000
15,000
20,000
25,000
30,000
35,000
40,000
0 5,000 10,000 15,000 20,000 25,000 30,000 35,000 40,000 45,000
BookingDensity[km²]
Centrality Index [100 = German Average]
Berlin
München
Linear (Combined)
R² = 0.1437
0
5,000
10,000
15,000
20,000
25,000
30,000
35,000
40,000
0% 50% 100% 150% 200% 250%
BookingDensity[km²]
Rent Index [100 = City Average]
Berlin
München
Linear (Combined)
R² = 0.0012
0
5,000
10,000
15,000
20,000
25,000
30,000
35,000
40,000
0 20 40 60 80 100 120 140 160 180 200
BookingDensity[km²]
Station Density (U-/S-Bahn) [km²]
Berlin
München
Linear (Combined)
212 APPENDIX F. SCATTER PLOTS](https://image.slidesharecdn.com/6e07fbad-1fc9-4865-930b-b3b2597817b7-150708184002-lva1-app6891/85/Seign_Dissertation-228-320.jpg)
![R² = 0.1123
0
5,000
10,000
15,000
20,000
25,000
30,000
35,000
40,000
0 2 4 6 8 10 12 14
BookingDensity[km²]
Distance to an ICE train station [km]
Berlin
München
Linear (Combined)
R² = 0.0097
0
5,000
10,000
15,000
20,000
25,000
30,000
35,000
40,000
100 200 300 400
BookingDensity[km²]
Location Index [100 = city centre, 200 = city, 300 = city boundary, 400 = city outskirts]]
Berlin
München
Linear (Combined)
R² = 0.1578
0
5,000
10,000
15,000
20,000
25,000
30,000
35,000
40,000
0 2,000 4,000 6,000 8,000 10,000 12,000 14,000
BookingDensity[km²]
Distance to Town Hall [m]
Berlin
München
Linear (Combined)
213](https://image.slidesharecdn.com/6e07fbad-1fc9-4865-930b-b3b2597817b7-150708184002-lva1-app6891/85/Seign_Dissertation-229-320.jpg)
![R² = 0.0096
0
5,000
10,000
15,000
20,000
25,000
30,000
35,000
40,000
0 20 40 60 80 100 120 140 160 180
BookingDensity[km²]
Frequent Car User Index [100 = German Average]
Berlin
München
Linear (Combined)
R² = 0.1782
0
5,000
10,000
15,000
20,000
25,000
30,000
35,000
40,000
0 200 400 600 800 1,000 1,200
BookingDensity[km²]
Restaurant and Hotel Density [km²]
Berlin
München
Linear (Combined)
R² = 0.0011
0
5,000
10,000
15,000
20,000
25,000
30,000
35,000
40,000
0 20 40 60 80 100 120 140 160 180 200
BookingDensity[km²]
Affinity for Leasing Index [German Average = 100]
Berlin
München
Linear (Combined)
214 APPENDIX F. SCATTER PLOTS](https://image.slidesharecdn.com/6e07fbad-1fc9-4865-930b-b3b2597817b7-150708184002-lva1-app6891/85/Seign_Dissertation-230-320.jpg)
![R² = 0.0089
0
5,000
10,000
15,000
20,000
25,000
30,000
35,000
40,000
0 20 40 60 80 100 120 140 160 180
BookingDensity[km²]
Used Car Ownership Index [German Average = 100]
Berlin
München
Linear (Combined)
R² = 0.0139
0
5,000
10,000
15,000
20,000
25,000
30,000
35,000
40,000
0 20 40 60 80 100 120 140 160 180 200
BookingDensity[km²]
Environmental Affinity Index [German Average = 100]
Berlin
München
Linear (Combined)
R² = 0.0701
0
5,000
10,000
15,000
20,000
25,000
30,000
35,000
40,000
0 20 40 60 80 100 120 140 160 180 200
BookingDensity[km²]
Natural Gas Vehicle Affinity Index [German Average = 100]
Berlin
München
Linear
(Combined)
215](https://image.slidesharecdn.com/6e07fbad-1fc9-4865-930b-b3b2597817b7-150708184002-lva1-app6891/85/Seign_Dissertation-231-320.jpg)
![R² = 0.0214
0
5,000
10,000
15,000
20,000
25,000
30,000
35,000
40,000
0 20 40 60 80 100 120 140 160
BookingDensity[km²]
Factor Innovation Motivates Consumption as Index [German Average = 100]
Berlin
München
Linear
(Combined)
R² = 0.0016
0
5,000
10,000
15,000
20,000
25,000
30,000
35,000
40,000
0% 10% 20% 30% 40% 50% 60%
BookingDensity[km²]
Lifestyle: Share of Active Middle (AM) [% of households per tract]
Berlin
München
Linear
(Combined)
R² = 0.0462
0
5,000
10,000
15,000
20,000
25,000
30,000
35,000
40,000
0% 20% 40% 60% 80% 100% 120%
BookingDensity[km²]
Lifestyle: Share of Down-to-Earth (B) [% of households per tract]
Berlin
München
Linear
(Combined)
216 APPENDIX F. SCATTER PLOTS](https://image.slidesharecdn.com/6e07fbad-1fc9-4865-930b-b3b2597817b7-150708184002-lva1-app6891/85/Seign_Dissertation-232-320.jpg)
![R² = 1E-05
0
5,000
10,000
15,000
20,000
25,000
30,000
35,000
40,000
0% 20% 40% 60% 80% 100% 120%
BookingDensity[km²]
Lifestyle: Share of Innovative Climbers (IA) [% of households per tract]
Berlin
München
Linear
(Combined)
R² = 0.0014
0
5,000
10,000
15,000
20,000
25,000
30,000
35,000
40,000
0% 10% 20% 30% 40% 50% 60% 70% 80% 90% 100%
BookingDensity[km²]
Lifestyle: Share of Consume Novices (K) [% of households per tract]
Berlin
München
Linear
(Combined)
R² = 0.0531
0
5,000
10,000
15,000
20,000
25,000
30,000
35,000
40,000
0% 10% 20% 30% 40% 50% 60% 70% 80% 90% 100%
BookingDensity[km²]
Lifestyle: Share of Materialistic Oriented (MO) [% of households per tract]
Berlin
München
217](https://image.slidesharecdn.com/6e07fbad-1fc9-4865-930b-b3b2597817b7-150708184002-lva1-app6891/85/Seign_Dissertation-233-320.jpg)
![R² = 0.0229
0
5,000
10,000
15,000
20,000
25,000
30,000
35,000
40,000
0% 10% 20% 30% 40% 50% 60%
BookingDensity[km²]
Lifestyle: Share of Cosmopolitan Establishment (WE) [% of households per tract]
Berlin
München
Linear
(Combined)
R² = 0.0004
0
5,000
10,000
15,000
20,000
25,000
30,000
35,000
40,000
0 20 40 60 80 100 120 140 160 180 200
BookingDensity[km²]
Car Engine Power Index [German Average = 100]
Berlin
München
Linear
(Combined)
R² = 0.0197
0
5,000
10,000
15,000
20,000
25,000
30,000
35,000
40,000
0% 20% 40% 60% 80% 100% 120% 140% 160%
BookingDensity[km²]
Purchasing Power per Capita Index [100 = City Average]
Berlin
München
Linear
(Combined)
218 APPENDIX F. SCATTER PLOTS](https://image.slidesharecdn.com/6e07fbad-1fc9-4865-930b-b3b2597817b7-150708184002-lva1-app6891/85/Seign_Dissertation-234-320.jpg)
![R² = 0.0027
0
5,000
10,000
15,000
20,000
25,000
30,000
35,000
40,000
0% 10% 20% 30% 40% 50% 60%
BookingDensity[km²]
Residential Area: Share of Very Good (WL1) Buildings [%]
Berlin
München
Linear
(Combined)
R² = 0.0267
0
5,000
10,000
15,000
20,000
25,000
30,000
35,000
40,000
0% 10% 20% 30% 40% 50% 60% 70% 80% 90% 100%
BookingDensity[km²]
Residential Area: Share of Good (WL2) Buildings [%]
Berlin
München
Linear
(Combined)
R² = 0.0137
0
5,000
10,000
15,000
20,000
25,000
30,000
35,000
40,000
0% 20% 40% 60% 80% 100% 120%
BookingDensity[km²]
Residential Area: Share of Satisfactory (WL3) Buildings [%]
Berlin
München
Linear
(Combined)
219](https://image.slidesharecdn.com/6e07fbad-1fc9-4865-930b-b3b2597817b7-150708184002-lva1-app6891/85/Seign_Dissertation-235-320.jpg)
![R² = 0.0056
0
5,000
10,000
15,000
20,000
25,000
30,000
35,000
40,000
0% 20% 40% 60% 80% 100% 120%
BookingDensity[km²]
Residential Area: Share of Sufficient (WL4) Buildings [%]
Berlin
München
Linear
(Combined)
R² = 0.0233
0
5,000
10,000
15,000
20,000
25,000
30,000
35,000
40,000
0% 20% 40% 60% 80% 100% 120%
BookingDensity[km²]
Residential Area: Share of Unsatisfactory (WL5) Buildings [%]
Berlin
München
Linear
(Combined)
R² = 0.0002
0
5,000
10,000
15,000
20,000
25,000
30,000
35,000
40,000
0% 5% 10% 15% 20% 25% 30% 35% 40% 45% 50%
BookingDensity[km²]
Residential Area: Share of Very Unsatisfactory (WL6) Buildings [%]
Berlin
München
Linear
(Combined)
220 APPENDIX F. SCATTER PLOTS](https://image.slidesharecdn.com/6e07fbad-1fc9-4865-930b-b3b2597817b7-150708184002-lva1-app6891/85/Seign_Dissertation-236-320.jpg)
![R² = 0.0012
0
5,000
10,000
15,000
20,000
25,000
30,000
35,000
40,000
0% 20% 40% 60% 80% 100% 120%
BookingDensity[km²]
Social Class: Upper Class (S1) [% per tract]
Berlin
München
Linear
(Combined)
R² = 0.0045
0
5,000
10,000
15,000
20,000
25,000
30,000
35,000
40,000
0% 10% 20% 30% 40% 50% 60% 70% 80% 90%
BookingDensity[km²]
Social Class: Upper Middle Class (S2) [% per tract]
Berlin
München
Linear
(Combined)
R² = 7E-06
0
5,000
10,000
15,000
20,000
25,000
30,000
35,000
40,000
0% 20% 40% 60% 80% 100% 120%
BookingDensity[km²]
Social Class: Middle Class (S3) [% per tract]
Berlin
München
Linear
(Combined)
221](https://image.slidesharecdn.com/6e07fbad-1fc9-4865-930b-b3b2597817b7-150708184002-lva1-app6891/85/Seign_Dissertation-237-320.jpg)
![R² = 0.0014
0
5,000
10,000
15,000
20,000
25,000
30,000
35,000
40,000
0% 20% 40% 60% 80% 100% 120%
BookingDensity[km²]
Social Class: Lower Middle Class (S4) [% per tract]
Berlin
München
Linear
(Combined)
R² = 0.0008
0
5,000
10,000
15,000
20,000
25,000
30,000
35,000
40,000
0% 10% 20% 30% 40% 50% 60% 70% 80% 90%
BookingDensity[km²]
Social Class: Lower Class (S5) [% per tract]
Berlin
München
Linear
(Combined)
R² = 3E-05
0
5,000
10,000
15,000
20,000
25,000
30,000
35,000
40,000
0% 1% 2% 3% 4% 5% 6% 7% 8% 9%
BookingDensity[km²]
Student Density [% per tract]
Berlin
München
Linear
(Combined)
222 APPENDIX F. SCATTER PLOTS](https://image.slidesharecdn.com/6e07fbad-1fc9-4865-930b-b3b2597817b7-150708184002-lva1-app6891/85/Seign_Dissertation-238-320.jpg)
![R² = 0.0002
0
5,000
10,000
15,000
20,000
25,000
30,000
35,000
40,000
0% 5% 10% 15% 20% 25% 30% 35%
BookingDensity[km²]
Household Net Income 0-900€ [% households per tract]
Berlin
München
Linear
(Combined)
R² = 0.0004
0
5,000
10,000
15,000
20,000
25,000
30,000
35,000
40,000
0% 5% 10% 15% 20% 25% 30% 35%
BookingDensity[km²]
Household Net Income 900-1500€ [% households per tract]
Berlin
München
Linear
(Combined)
R² = 0.0048
0
5,000
10,000
15,000
20,000
25,000
30,000
35,000
40,000
0% 5% 10% 15% 20% 25% 30% 35% 40%
BookingDensity[km²]
Household Net Income 1500-2600€ [% households per tract]
Berlin
München
Linear
(Combined)
223](https://image.slidesharecdn.com/6e07fbad-1fc9-4865-930b-b3b2597817b7-150708184002-lva1-app6891/85/Seign_Dissertation-239-320.jpg)
![R² = 0.0005
0
5,000
10,000
15,000
20,000
25,000
30,000
35,000
40,000
0% 5% 10% 15% 20% 25% 30% 35%
BookingDensity[km²]
Household Net Income 2600-3600€ [% households per tract]
Berlin
München
Linear
(Combined)
R² = 0.002
0
5,000
10,000
15,000
20,000
25,000
30,000
35,000
40,000
0% 5% 10% 15% 20% 25% 30% 35% 40%
BookingDensity[km²]
Household Net Income 3600-5000€ [% households per tract]
Berlin
München
Linear
(Combined)
R² = 0.002
0
5,000
10,000
15,000
20,000
25,000
30,000
35,000
40,000
0% 5% 10% 15% 20% 25% 30% 35% 40%
BookingDensity[km²]
Household Net Income over 5000€ [% households per tract]
Berlin
München
Linear
(Combined)
224 APPENDIX F. SCATTER PLOTS](https://image.slidesharecdn.com/6e07fbad-1fc9-4865-930b-b3b2597817b7-150708184002-lva1-app6891/85/Seign_Dissertation-240-320.jpg)
![R² = 0.1049
0
5,000
10,000
15,000
20,000
25,000
30,000
35,000
40,000
0 5,000 10,000 15,000 20,000 25,000
BookingDensity[km²]
Car Density [km²]
Berlin
München
Linear
(Combined)
R² = 0.05
0
5,000
10,000
15,000
20,000
25,000
30,000
35,000
40,000
0% 10% 20% 30% 40% 50% 60% 70% 80%
BookingDensity[km²]
One Person Households [% per tract]
Berlin
München
Linear
(Combined)
R² = 0.0369
0
5,000
10,000
15,000
20,000
25,000
30,000
35,000
40,000
0% 5% 10% 15% 20% 25% 30% 35% 40% 45% 50%
BookingDensity[km²]
Two Person Households [% per tract]
Berlin
München
Linear
(Combined)
225](https://image.slidesharecdn.com/6e07fbad-1fc9-4865-930b-b3b2597817b7-150708184002-lva1-app6891/85/Seign_Dissertation-241-320.jpg)
![R² = 0.0249
0
5,000
10,000
15,000
20,000
25,000
30,000
35,000
40,000
0% 5% 10% 15% 20% 25% 30% 35%
BookingDensity[km²]
Three (or more) Person Households [% per tract]
Berlin
München
Linear
(Combined)
R² = 0.0228
0
5,000
10,000
15,000
20,000
25,000
30,000
35,000
40,000
0.0 0.5 1.0 1.5 2.0 2.5 3.0 3.5 4.0 4.5
BookingDensity[km²]
Average Household Size [per tract]
Berlin
München
Linear
(Combined)
R² = 0.022
0
5,000
10,000
15,000
20,000
25,000
30,000
35,000
40,000
0% 10% 20% 30% 40% 50% 60% 70%
BookingDensity[km²]
One Child Households [% per tract]
Berlin
München
Linear
(Combined)
226 APPENDIX F. SCATTER PLOTS](https://image.slidesharecdn.com/6e07fbad-1fc9-4865-930b-b3b2597817b7-150708184002-lva1-app6891/85/Seign_Dissertation-242-320.jpg)
![R² = 0.009
0
5,000
10,000
15,000
20,000
25,000
30,000
35,000
40,000
0% 2% 4% 6% 8% 10% 12% 14% 16% 18%
BookingDensity[km²]
Two Child Households [% per tract]
Berlin
München
Linear
(Combined)
R² = 0.001
0
5,000
10,000
15,000
20,000
25,000
30,000
35,000
40,000
0.0% 0.5% 1.0% 1.5% 2.0% 2.5% 3.0% 3.5% 4.0% 4.5%
BookingDensity[km²]
Three or More Child Households [% per tract]
Berlin
München
Linear
(Combined)
R² = 0.005
0
5,000
10,000
15,000
20,000
25,000
30,000
35,000
40,000
0.0% 5.0% 10.0% 15.0% 20.0% 25.0% 30.0%
BookingDensity[km²]
Age: Share of 0-19 Year Old Population [% per tract]
Berlin
München
Linear
(Combined)
227](https://image.slidesharecdn.com/6e07fbad-1fc9-4865-930b-b3b2597817b7-150708184002-lva1-app6891/85/Seign_Dissertation-243-320.jpg)
![R² = 0.0002
0
5,000
10,000
15,000
20,000
25,000
30,000
35,000
40,000
0.0% 5.0% 10.0% 15.0% 20.0% 25.0% 30.0%
BookingDensity[km²]
Age: Share of 20-29 Year Old Population [% per tract]
Berlin
München
Linear
(Combined)
R² = 0.0306
0
5,000
10,000
15,000
20,000
25,000
30,000
35,000
40,000
0.0% 5.0% 10.0% 15.0% 20.0% 25.0% 30.0%
BookingDensity[km²]
Age: Share of 30-39 Year Old Population [% per tract]
Berlin
München
Linear
(Combined)
R² = 0.1546
0
5,000
10,000
15,000
20,000
25,000
30,000
35,000
40,000
0.0% 5.0% 10.0% 15.0% 20.0% 25.0% 30.0%
BookingDensity[km²]
Age: Share of 40-49 Year Old Population [% per tract]
Berlin
München
Linear
(Combined)
228 APPENDIX F. SCATTER PLOTS](https://image.slidesharecdn.com/6e07fbad-1fc9-4865-930b-b3b2597817b7-150708184002-lva1-app6891/85/Seign_Dissertation-244-320.jpg)
![R² = 0.07
0
5,000
10,000
15,000
20,000
25,000
30,000
35,000
40,000
0.0% 20.0% 40.0% 60.0% 80.0% 100.0% 120.0%
BookingDensity[km²]
Age: Share of 50 or More Year Old Population [% per tract]
Berlin
München
Linear
(Combined)
R² = 0.1271
0
5,000
10,000
15,000
20,000
25,000
30,000
35,000
40,000
0 20 40 60 80 100 120 140 160
BookingDensity[km²]
UMTS-Affinity Index [German Average = 100]
Berlin
München
Linear
(Combined)
R² = 0.113
0
5,000
10,000
15,000
20,000
25,000
30,000
35,000
40,000
0 20 40 60 80 100 120 140 160
BookingDensity[km²]
HighTech Affinity Index [German Average = 100]
Berlin
München
Linear
(Combined)
229](https://image.slidesharecdn.com/6e07fbad-1fc9-4865-930b-b3b2597817b7-150708184002-lva1-app6891/85/Seign_Dissertation-245-320.jpg)
![R² = 0.0221
0
5,000
10,000
15,000
20,000
25,000
30,000
35,000
40,000
0 50 100 150 200 250
BookingDensity[km²]
Telecommunication Type "Multi-Media-Professional" Index [German Average = 100]
Berlin
München
Linear
(Combined)
R² = 5E-05
0
5,000
10,000
15,000
20,000
25,000
30,000
35,000
40,000
0 20 40 60 80 100 120 140
BookingDensity[km²]
Telecommunication Type "Open Communication Type" Index [German Average = 100]
Berlin
München
Linear
(Combined)
R² = 0.0606
0
5,000
10,000
15,000
20,000
25,000
30,000
35,000
40,000
0 20 40 60 80 100 120 140
BookingDensity[km²]
Telecommunication Type "Traditional Landline User" Index [German Average = 100]
Berlin
München
Linear
(Combined)
230 APPENDIX F. SCATTER PLOTS](https://image.slidesharecdn.com/6e07fbad-1fc9-4865-930b-b3b2597817b7-150708184002-lva1-app6891/85/Seign_Dissertation-246-320.jpg)
![R² = 0.0011
0
5,000
10,000
15,000
20,000
25,000
30,000
35,000
40,000
0 20 40 60 80 100 120 140 160 180
BookingDensity[km²]
Factor Environment Motivates Consumption as Index [German Average = 100]
Berlin
München
Linear
(Combined)
R² = 0.0566
0
5,000
10,000
15,000
20,000
25,000
30,000
35,000
40,000
0 20 40 60 80 100 120 140 160
BookingDensity[km²]
Factor Brand Motivates Consumption as Index [German Average = 100]
Berlin
München
Linear
(Combined)
R² = 0.0011
0
5,000
10,000
15,000
20,000
25,000
30,000
35,000
40,000
0 2 4 6 8 10 12 14 16 18 20
BookingDensity[km²]
YUPPIE Density [% of households]
Berlin
München
Linear
(Combined)
231](https://image.slidesharecdn.com/6e07fbad-1fc9-4865-930b-b3b2597817b7-150708184002-lva1-app6891/85/Seign_Dissertation-247-320.jpg)
![R² = 0.0119
0
5,000
10,000
15,000
20,000
25,000
30,000
35,000
40,000
0 20 40 60 80 100 120 140 160 180 200
BookingDensity[km²]
Factor Price Motivates Consumption as Index [German Average = 100]
Berlin
München
Linear
(Combined)
232 APPENDIX F. SCATTER PLOTS](https://image.slidesharecdn.com/6e07fbad-1fc9-4865-930b-b3b2597817b7-150708184002-lva1-app6891/85/Seign_Dissertation-248-320.jpg)