Download to read offline
![International Journal of Engineering Research and Development
e-ISSN: 2278-067X, p-ISSN: 2278-800X, www.ijerd.com
Volume 10, Issue 11 (November 2014), PP.30-36
30
Traffic Safety Risks from Digital Advertising Billboards in
Alabama
Virginia P. Sisiopiku1
, Md Mozahidul Islam2
, Andrew Sullivan3
1
Associate Professor, Department of Civil, Construction and Environmental Engineering, University of
Alabama at Birmingham, 1075 13th
St S, Birmingham, Alabama 35294, USA
2
Graduate Research Assistant, Department of Civil, Construction and Environmental Engineering,
University of Alabama at Birmingham, 1075 13th St S, Birmingham, Alabama 35294, USA
3
Assistant Professor, Department of Civil, Construction and Environmental Engineering,
University of Alabama at Birmingham, 1075 13th St S, Birmingham, Alabama 35294, USA
Abstract:- Increase in the number and sophistication of digital advertising billboard signs raises safety concerns
over potential contribution of such signs to traffic crashes. This paper describes a study that analysed 5 years of
historical crash records from Alabama to examine potential correlations between crash locations and their
proximity to digital advertising billboards. First, the research team identified locations of digital advertising
billboards along major limited-access facilities in Alabama and selected eight suitable sites for analysis. Eight
sites immediately downstream of the digital billboard locations were also considered as control sites. Then,
historical crash data were retrieved for all study sites and crash rates were calculated for digital advertising
billboards influence zones and adjacent control sites. Statistical analysis was employed to determine if
correlations can be established between crash occurrence and digital advertising billboard presence. The crash
data analyses revealed that the presence of digital billboards increased the overall crash rates at digital
advertising billboard influence zones by 29% compared to the study control sites. Moreover, sideswipe and
rear-end crashes were found to be overrepresented at digital advertising billboard influence zones compared to
control sites.
Keywords:- Digital advertising billboards, traffic safety, driver distraction, crash rates, crash analysis.
I. INTRODUCTION
According to the Outdoor Advertising Association of America (OAAA), there were over 365,000
unique billboard faces in the United States in 2013 [1]. The majority of roadside advertising billboards in the
US are static. Static billboards show the same message for an extended period of time (typically days). Digital
billboards (DBBs) were introduced in the recent years and utilize light-emitting diode (LED) technology to
display multiple messages that are updated using computer input. Because DBBs flash images every four to ten
seconds [2], a single board can advertise to far more clients than a traditional static billboard, making them an
attractive advertisement option [1].
The increased number and sophistication of DBBs raises questions about their potential impact on
traffic safety. As an advertising medium, DBBs purposely encourage drivers to shift their attention away from
the driving task. Moreover, their brightness can be especially problematic at night and may affect drivers‟ ability
to observe changes in the surrounding environment such as brake lights or signal changes. Also, frequently
changing images may compel more glances, and sequential messages may hold drivers‟ gazes longer until the
entire message is read. Lastly, targeted messages that engage drivers are particularly troublesome as they create
driver distractions [3].
Earlier studies sponsored by billboard advertising companies stated that the presence of digital
advertising billboards does not cause a change in driver performance in terms of visual behaviour, speed
maintenance, or lane keeping [4]. In the past, some studies showed that drivers‟ diminished attention could
result in more crashes in the vicinity of such billboards; however, because of methodological problems of these
studies, the conclusions are deemed not reliable [5]. Due to the growing debate on this issue, an evaluation is
needed to determine if the presence of digital advertising billboards really distracts drivers, and whether or not
the distraction may be linked to an increase in traffic crash risk in the vicinity of digital advertising billboards.
II. LITERATURE REVIEW
Crash studies typically involve statistical analyses of historical crash databases and provide fast and
easy-to-obtain results. However, often the final conclusions can be limited in scope due to the highly variable
and confined nature of crash data. In the case of advertising billboards, many of the crash studies reported in the
literature were funded by the outdoor advertising industry, thus raising some concerns related to objectivity and](https://image.slidesharecdn.com/e10113036-150115032321-conversion-gate01/85/Traffic-Safety-Risks-from-Digital-Advertising-Billboards-in-Alabama-1-320.jpg)
![International Journal of Engineering Research and Development
e-ISSN: 2278-067X, p-ISSN: 2278-800X, www.ijerd.com
Volume 10, Issue 11 (November 2014), PP.30-36
30
Traffic Safety Risks from Digital Advertising Billboards in
Alabama
Virginia P. Sisiopiku1
, Md Mozahidul Islam2
, Andrew Sullivan3
1
Associate Professor, Department of Civil, Construction and Environmental Engineering, University of
Alabama at Birmingham, 1075 13th
St S, Birmingham, Alabama 35294, USA
2
Graduate Research Assistant, Department of Civil, Construction and Environmental Engineering,
University of Alabama at Birmingham, 1075 13th St S, Birmingham, Alabama 35294, USA
3
Assistant Professor, Department of Civil, Construction and Environmental Engineering,
University of Alabama at Birmingham, 1075 13th St S, Birmingham, Alabama 35294, USA
Abstract:- Increase in the number and sophistication of digital advertising billboard signs raises safety concerns
over potential contribution of such signs to traffic crashes. This paper describes a study that analysed 5 years of
historical crash records from Alabama to examine potential correlations between crash locations and their
proximity to digital advertising billboards. First, the research team identified locations of digital advertising
billboards along major limited-access facilities in Alabama and selected eight suitable sites for analysis. Eight
sites immediately downstream of the digital billboard locations were also considered as control sites. Then,
historical crash data were retrieved for all study sites and crash rates were calculated for digital advertising
billboards influence zones and adjacent control sites. Statistical analysis was employed to determine if
correlations can be established between crash occurrence and digital advertising billboard presence. The crash
data analyses revealed that the presence of digital billboards increased the overall crash rates at digital
advertising billboard influence zones by 29% compared to the study control sites. Moreover, sideswipe and
rear-end crashes were found to be overrepresented at digital advertising billboard influence zones compared to
control sites.
Keywords:- Digital advertising billboards, traffic safety, driver distraction, crash rates, crash analysis.
I. INTRODUCTION
According to the Outdoor Advertising Association of America (OAAA), there were over 365,000
unique billboard faces in the United States in 2013 [1]. The majority of roadside advertising billboards in the
US are static. Static billboards show the same message for an extended period of time (typically days). Digital
billboards (DBBs) were introduced in the recent years and utilize light-emitting diode (LED) technology to
display multiple messages that are updated using computer input. Because DBBs flash images every four to ten
seconds [2], a single board can advertise to far more clients than a traditional static billboard, making them an
attractive advertisement option [1].
The increased number and sophistication of DBBs raises questions about their potential impact on
traffic safety. As an advertising medium, DBBs purposely encourage drivers to shift their attention away from
the driving task. Moreover, their brightness can be especially problematic at night and may affect drivers‟ ability
to observe changes in the surrounding environment such as brake lights or signal changes. Also, frequently
changing images may compel more glances, and sequential messages may hold drivers‟ gazes longer until the
entire message is read. Lastly, targeted messages that engage drivers are particularly troublesome as they create
driver distractions [3].
Earlier studies sponsored by billboard advertising companies stated that the presence of digital
advertising billboards does not cause a change in driver performance in terms of visual behaviour, speed
maintenance, or lane keeping [4]. In the past, some studies showed that drivers‟ diminished attention could
result in more crashes in the vicinity of such billboards; however, because of methodological problems of these
studies, the conclusions are deemed not reliable [5]. Due to the growing debate on this issue, an evaluation is
needed to determine if the presence of digital advertising billboards really distracts drivers, and whether or not
the distraction may be linked to an increase in traffic crash risk in the vicinity of digital advertising billboards.
II. LITERATURE REVIEW
Crash studies typically involve statistical analyses of historical crash databases and provide fast and
easy-to-obtain results. However, often the final conclusions can be limited in scope due to the highly variable
and confined nature of crash data. In the case of advertising billboards, many of the crash studies reported in the
literature were funded by the outdoor advertising industry, thus raising some concerns related to objectivity and](https://image.slidesharecdn.com/e10113036-150115032321-conversion-gate01/75/Traffic-Safety-Risks-from-Digital-Advertising-Billboards-in-Alabama-1-2048.jpg)
![Traffic Safety Risks from Digital Advertising Billboards in Alabama
31
motive. Nevertheless, a brief summary of the literature is important to establish a foundation for future studies.
An extended synthesis of the literature on this topic is available at reference [6].
In a 2010 report, Tantala and Tantala [7] examined the statistical relationship between digital billboards
and traffic safety in Albuquerque, New Mexico. Analysis of traffic and crash data was conducted for a 7-year
period on local roads near 17 DBBs. Each billboard contained one digital plane that was converted from
traditional signage between 2006 and 2007. The researchers reviewed the frequency of crashes near the
billboards before and after the conversion from static to digital. The study analysed crashes within 0.2, 0.4, 0.6,
0.8, and 1.0 miles both upstream and downstream of each sign. Also, time of day and age of driver dynamics
were factored into the study. The researchers also performed a spatial analysis to investigate the potential
correlation between the locations of billboards and crashes. The results of the study indicated that the 17 digital
billboards in Albuquerque have no significant relationship with crash occurrence. Specifically, crash rates near
the digital boards showed a 0.3% decrease in crash rate within 0.6 miles of the signs over a period of six years.
Furthermore, the spatial component of the study found no significant clustering of crashes in the vicinity of
billboard sites [7].
In another study, Tantala and Tantala [8] examined the statistical correlation between digital billboards
and crash data in Henrico County and Richmond, Virginia. The study analysed crash data in the vicinity of 14
digital billboards at 10 study locations. Data sources included municipal police departments, Henrico County,
and the Virginia Department of Transportation (VDOT). The analysis approach was similar to the Albuquerque
study; 7 years of crash data were examined at sites near the selected billboards, which were converted from
conventional to digital faces between 2006 and 2009. Once again, temporal and spatial components were
investigated within ranges of a half mile upstream and downstream of the billboards. An Empirical Bayes
Method (EBM) analysis was utilized to calculate the number of crashes that could be expected in the absence of
signs. Results indicated that digital billboards in the Richmond area had no statistically significant relationship
with crash occurrence. The EBM analysis showed that the actual number of crashes at each location was
consistent with what would be expected with or without the installation of digital billboards [8].
In 2012, Yannis and colleagues [9] conducted a statistical analysis on road sites in Athens, Greece
metropolitan area. The goal of the research was to investigate the relationship between the placement and
removal of advertising signs and the related occurrence of crashes. Crash data from the test sites were obtained
from the Hellenic Statistical Authority database and analysed. The analysis showed no correlation between
crashes and advertising signs at any of the nine sites examined [9].
In another research effort, the city of Toronto requested an investigation of the effects of billboards and
safety on three downtown intersections and one expressway. The latter indicated that there was no substantial
increase in crashes near signed approaches [10].
Epidemiological and other studies that investigated traffic safety aspects of roadside advertising
generally agree that the relationship between digital billboards, driver distraction, and traffic safety is quite
complex. Consequently, given the dynamic state of the industry and the fact that many related studies are
currently outdated, new research on traffic safety risks from digital billboards is needed that takes under
consideration local conditions and common practices.
III. METHODOLOGY
A. Objective
The objective of this study was to examine potential correlation between presence of the digital
billboards and traffic safety along limited-access facilities (i.e., interstates and expressways) in Alabama.
Historical crash records for the period 2008-2012 were retrieved and analysed to allow comparisons of crash
rates in areas of potential influence of digital advertising billboards to crash rates in control segments
downstream of digital billboard locations.
B. Approach
Digital advertising billboard locations along limited-access roadway facilities in the state of Alabama
were identified from existing databases, on-site visits, and Google Earth‟s Street View. The Google‟s Street
View, within the Google Earth environment, provided a user-friendly measuring tool to measure distances. An
example of a study location is shown in Fig. 1.](https://image.slidesharecdn.com/e10113036-150115032321-conversion-gate01/85/Traffic-Safety-Risks-from-Digital-Advertising-Billboards-in-Alabama-2-320.jpg)
![Traffic Safety Risks from Digital Advertising Billboards in Alabama
33
Table I: List of Digital Billboard Study Locations
ID City County Route Direction
of Travel
Road
Side
Land
Use
Length (miles)1
DBB
Site
Control
Site
1 Mobile Mobile I-65 SB Right Urban 0.453 0.453
2 Mobile Mobile I-65 NB Right Urban 0.467 0.237
3 Montgomery Montgomery I-85 SW (West
Bound)
Right Suburban 0.396 0.396
4 Madison Madison I-565 NE (East
Bound)
Right Urban 0.373 0.373
5 Huntsville Madison I-565 NE (East
Bound)
Right Urban 0.353 0.353
6 Huntsville Madison I-565 SW (West
Bound)
Left Urban 0.486 0.207
7 Bessemer Jefferson I-459 NW (West
Bound)
Right Urban 0.505 0.505
8 Bessemer Jefferson I-20/59 SB Right Suburban 0.497 0.497
1
DBB influence zone length includes 0.05 (±0.02) miles downstream of digital billboard; control site length
minimum 0.15 miles
IV. DATA ANALYSIS PROCEDURE
To meet the study objectives, crash records for the locations of interest were obtained from the Critical
Analysis Reporting Environment (CARE) crash database for a 5-year span ranging from 2008 through 2012 [11].
CARE is a data analysis software package developed by the staff of the Center for Advanced Public Safety at
the University of Alabama that summarizes historical crash records based on police reports. Then crash rates per
million vehicle miles travelled at the DBB influence zones (U/S) and control segments (D/S) were determined
and comparisons were made to establish if there exists any relationship between presence of digital billboard
and crash occurrence.
More specifically, the crash rate (in crashes per million vehicle miles (MVM) per year) was calculated
for each segment as shown below. Note that the AADT in the dominator was multiplied by 0.5 to calculate the
crash rate for the affected roadway direction assuming a 50/50 directional split.
𝐶𝑅 =
𝐶𝑟𝑎𝑠ℎ 𝐶𝑜𝑢𝑛𝑡 ∗ 106
0.5 ∗ 𝐴𝐴𝐷𝑇 ∗ 365 ∗ 𝐿 ∗ 𝑁
Where:
Crash Count = count of crashes at each segment,
AADT = annual average daily traffic for both directions in vehicles/day,
L = segment length in miles, and
N = number of study years (N=5, i.e., 2008-2012)
The crash rates were determined for both the DBB influence zones and control sites. The crashes were
counted based on the direction of the vehicles approaching the digital face of the billboard (U/S) and the
vehicles that passed the digital face (D/S).
The combined VMT (of 5 years) was used to calculate average annual crash rates at each location. The
number of crashes in each year for a particular location was small, and therefore, the total number of crashes for
five years was used to calculate the crash rates. Overall, a total of 77 crashes were included in the safety
assessment.
V. RESULTS
A. Crash Analysis Results
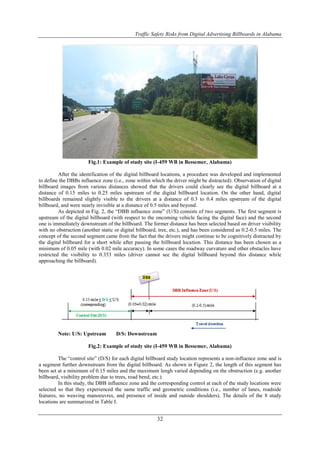
1) Crash Analysis by Location: Table II shows the summary statistics of crash rates at the eight study sites
(both for the DBB influence and control sites). As far as the number of crashes is concerned, the majority of the
sites experienced more crashes in the DBB influence zone than the control sites.](https://image.slidesharecdn.com/e10113036-150115032321-conversion-gate01/85/Traffic-Safety-Risks-from-Digital-Advertising-Billboards-in-Alabama-4-320.jpg)
![Traffic Safety Risks from Digital Advertising Billboards in Alabama
35
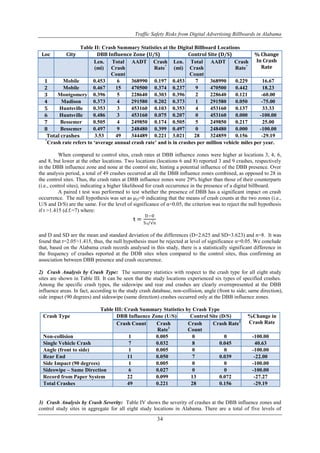
specific crash severity considered. A total of three fatalities (two along I-65 in Mobile in 2011 and 2008, one
along I-565 at Huntsville in 2009) have observed during the analysis period, two of which occurred at DBB
areas of influence. It should be noted that the number of crashes is small and does not allow for in depth
analysis. Still, the data show that a higher number of more severe crashes occur at DBB influence zones,
compared to control sites, once again suggesting a link between driver distraction from DBB presence and crash
severity.
Table IV: Summary Statistics by Crash Severity
Crash Severity DBB Influence Zone (U/S) Control Site (D/S) % Change
in Crash
Rate
Crash Count Crash Rate1
Crash Count Crash Rate1
Fatal Injury 2 0.009 1 0.006 -33.33
Incapacitating Injury 6 0.027 1 0.006 -77.78
Non-incapacitating Injury 0 0.000 2 0.011 ---
Possible Injury 4 0.018 1 0.006 -66.67
Property Damage Only
(PDO)
35 0.158 22 0.123 -22.15
Unknown 2 0.009 1 0.006 -33.33
Total Crashes 49 0.221 28 0.156 -29.19
VI. CONCLUSIONS
The impact of digital billboard on traffic safety on high-speed, limited-access facilities was explored at
eight sites in Alabama. The methodology of crash investigation in both states relied on comparing the crash rate
statistics upstream and downstream of each billboard location. The upstream and downstream segments were
selected such that they experienced similar traffic and geometric conditions, i.e., number of lanes, roadside
features, no weaving manoeuvres, etc.
The crash data analysis revealed that the presence of digital billboards increased the overall crash rates
in areas of billboard influence compared to control areas downstream of the digital billboard locations by 29%
in Alabama. This increase was statistically significant, thus implying that digital billboard presences shows a
positive correlation with increased crash frequency. Individual site data showed mixed results with crash rates
decreases at half of the study locations. The analysis by crash type revealed that sideswipe and rear end crashes
(often related to driver distraction) were clearly overrepresented at the DBB influence zones in Alabama.
Furthermore, consideration of crash severity provided some evidence of overrepresentation of severe crashes at
DBB influence zones; however, the sample size is small to allow for a detailed statistical analysis or
generalization of the findings.
This study offers an important contribution to the state of practice as it provides evidence of links
between DBB presence and increased crash risk. However, it should be noted that the findings from the crash
analysis in Alabama were based on a relatively small sample of locations and relatively short segment lengths. It
is recommended to validate the results of the crash analysis using larger sample sizes and longer segments.
Future research should extend to analysis of crash records at other states to determine how the impact of digital
billboard on traffic safety varies across states. The scope of the present study was restricted to limited-access
roadway facilities. Crash analysis on arterial streets can also be conducted to evaluate the potential safety
impacts of DBB on such facilities.
ACKNOWLEDGMENT
Funding for this study was provided by US DOT/RITA through the National Center for Transportation
Systems Productivity and Management (NCTSPM), and the Alabama Department of Transportation (ALDOT).
The support of the study sponsors is greatly appreciated. The authors would also like to thank Drs. A. Gan, K.
Haleem, and P. Alluri for their contributions to the research effort.
REFERENCES
[1]. Outdoor Advertising Association of America [OAAA].Out of home media formats: (2013), October 14,
2013. http://www.oaaa.org/OutofHomeAdvertising/OOHMediaFormats/OOHMediaFormats.aspx.
[2]. Copeland, L. More Communities Banning „Television on a Stick.‟ USA Today; March 23, 2010.
[3]. Sisiopiku, V.P., D. Hester, A. Gan, D. Stavrinos, and A. Sullivan. Roadside Advertising and Traffic
Safety.3rdAnnual International Conference on Civil Engineering, Athens, Greece, 2013.](https://image.slidesharecdn.com/e10113036-150115032321-conversion-gate01/85/Traffic-Safety-Risks-from-Digital-Advertising-Billboards-in-Alabama-6-320.jpg)
![Traffic Safety Risks from Digital Advertising Billboards in Alabama
36
[4]. Lee, S., M. McElheny, and R. Gibbons. Driving Performance and Digital Billboards. Prepared for
Foundation for Outdoor Advertising Research and Education by the Virginia Tech Transportation
Institute (VTTI), Center for Automotive Safety Research, 2007.
[5]. Institute for Road Safety Research, Roadside Advertising and Information, 2013.
http://www.swov.nl/rapport/Factsheets/UK/FS_Advertising.pdf
[6]. Sisiopiku, V.P., Hester, D., Gan, A., Stavrinos, D., and Sullivan, A. “Roadside Advertising and Traffic
Safety”, 3rd Annual International Conference on Civil Engineering, ATINER‟s Conference Paper
Series, No: CIV2013-0489, Athens, Greece, 2013.
[7]. Tantala, M., and A. Tantala. A Study of the Relationship between Digital Billboards and Traffic Safety
in Albuquerque, New Mexico.Submitted to the Foundation for Outdoor Advertising Research and
Education (FOARE), March 2010.
[8]. Tantala, M., and A. Tantala. A Study of the Relationship between Digital Billboards and Traffic Safety
in Henrico County and Richmond, Virginia. Submitted to the Foundation for Outdoor Advertising
Research and Education (FOARE), November 2010.
[9]. Yannis, G., E. Papadimitriou, P. Papantoniou, and C. Voulgari. A Statistical Analysis of the Impact of
Advertising Signs on Road Safety. Department of Transportation Planning and Engineering, School of
Civil Engineering, National Technical University of Athens, Athens, Greece, May 2012.
[10]. Smiley, A., B. Persaud, G. Bahar, C. Mollett, C. Lyon, T. Smahel, and W. Kelman. Traffic Safety
Evaluation of Video Advertising Signs. In Transportation Research Record: Journal of the
Transportation Research Board, No. 1937, Transportation Research Board of the National Academies,
Washington, D.C., 2005, pp. 105-112.
[11]. CARE 9.0.0, Critical Analysis Reporting Environment. User Manual. CARE Research & Development
Laboratory. Computer Science Department. The University of Alabama (UA), 2007.](https://image.slidesharecdn.com/e10113036-150115032321-conversion-gate01/85/Traffic-Safety-Risks-from-Digital-Advertising-Billboards-in-Alabama-7-320.jpg)

The study investigates the impact of digital advertising billboards on traffic safety in Alabama, analyzing historical crash data from 2008 to 2012. Results indicate a 29% increase in crash rates at locations near digital billboards compared to control sites, with sideswipe and rear-end crashes being notably higher. This research underscores concerns regarding driver distraction from digital billboards, suggesting a significant correlation between their presence and increased crash risk.