
Recommended
More Related Content
What's hot
What's hot (18)
Viewers also liked
Similar to 82904
Similar to 82904 (20)
More from Stéphane BARBUSSE
More from Stéphane BARBUSSE (18)
Recently uploaded
Recently uploaded (20)
82904
- 1. Toward a Systematic Approach to the Design and Evaluation of Automated Mobility-on-Demand Systems: A Case Study in Singapore Citation Spieser, Kevin, Kyle Ballantyne, Treleaven, Rick Zhang, Emilio Frazzoli, Daniel Morton, Marco Pavone. "Toward a Systematic Approach to the Design and Evaluation of Automated Mobility- on-Demand Systems A Case Study in Singapore." Forthcoming in Road Vehicle Automation, Springer Lecture Notes in Mobility series As Published Publisher Springer Version Author's final manuscript Accessed Fri Mar 28 07:07:26 EDT 2014 Citable Link http://hdl.handle.net/1721.1/82904 Terms of Use Creative Commons Attribution-Noncommercial-Share Alike 3.0 Detailed Terms http://creativecommons.org/licenses/by-nc-sa/3.0/ The MIT Faculty has made this article openly available. Please share how this access benefits you. Your story matters.
- 2. Toward a Systematic Approach to the Design and Evaluation of Automated Mobility-on-Demand Systems A Case Study in Singapore Kevin Spieser, Kyle Treleaven, Rick Zhang, Emilio Frazzoli, Daniel Morton, and Marco Pavone Abstract The objective of this work is to provide analytical guidelines and financial justification for the design of shared-vehicle mobility-on-demand systems. Specifi- cally, we consider the fundamental issue of determining the appropriate number of vehicles to field in the fleet, and estimate the financial benefits of several models of car sharing. As a case study, we consider replacing all modes of personal transporta- tion in a city such as Singapore with a fleet of shared automated vehicles, able to drive themselves, e.g., to move to a customer’s location. Using actual transportation data, our analysis suggests a shared-vehicle mobility solution can meet the personal mobility needs of the entire population with a fleet whose size is approximately 1/3 of the total number of passenger vehicles currently in operation. 1 Introduction In light of ongoing urbanization trends, cities face the challenge of maintaining the services and infrastructure necessary to keep pace with the transportation demands of a growing population. When the returns from investment in existing technologies, e.g., road expansion, added bus service, new subway lines, etc., begin to diminish, it is appropriate, perhaps even necessary, to consider new and potentially transfor- mative transportation solutions. A responsible approach to address the merits of a proposed solution is to conduct a systematic analysis of its key operational compo- Kevin Spieser, Kyle Treleaven, and Emilio Frazzoli Massachusetts Institute of Technology, Cambridge, MA, e-mail: {kspieser,ktreleav, frazzoli}@mit.edu Rick Zhang and Marco Pavone Stanford University, Palo Alto, CA, e-mail: {rickz,pavone}@stanford.edu Daniel Morton Singapore-MIT Alliance for Research and Technology, Singapore, e-mail: daniel.morton@ smart.mit.edu 1
- 3. 2 K. Spieser, K. Treleaven, et al. nents, thereby providing an informed foundation from which to gauge feasibility. It is in this spirit that this paper examines a new solution to personal mobility; namely, that of replacing all modes of personal transport in a city with a fleet of shared au- tonomous vehicles, i.e., vehicle that are able to drive themselves in traffic, to safely and reliably pick up passengers and deliver them at their intended destination. Research on autonomous vehicles is currently very active [1, 2]. Proponents of this technology typically point out as the main benefits (i) increased safety, as the automation reduces the effects of human errors, well known to be the leading cause of traffic accidents, (ii) increased convenience and productivity, as humans are ab- solved from the more burdensome aspects of driving, (iii) increased traffic efficiency and lower congestion, as automated vehicles can precisely monitor one another’s position and coordinate their motion to an extent impossible for human drivers, and (iv) reduced environmental impact, as velocity profiles can be carefully tuned to minimize emissions and noise. For the sake of this article, though, we will concentrate on yet another po- tential major benefit, i.e., (v) autonomous vehicles as an enabling technology for widespread car sharing. It is well known that most private cars are used less than 10% of the time [3], so car sharing is a clear path towards sustainability—especially if cars do not need a driver to move. Car-sharing services are growing worldwide, but typically do not offer one-way rental options, or if they do they often suffer from limited car availability. If shared cars were able to return to a parking or charging station, or drive to pick up the next customer by themselves, sharing would indeed provide a similar level of convenience as private cars, while providing the sustain- ability of public transport. Financially, car sharing distributes the cost of purchasing, maintaining, and insuring vehicles across a large user-base, leveraging economies of scale to reduce the cost of personal mobility. While automated vehicle technology continues to surge forward, less attention has been devoted to the logistics of effectively managing a fleet of potentially thou- sands of such vehicles. Among those works that do exist, many are of a conceptual nature. Although they raise a number of interesting ideas and suggest novel opera- tional paradigms, they frequently lack the rigor necessary to justify the feasibility of their claims. Those works that do take a design-oriented approach frequently rely heavily on simulations and unrealistic transportation demand models. Consequently, these techniques prove difficult to generalize and neglect salient features that have a fundamental impact on key performance metrics. Recognizing these shortcom- ings, this work provides some preliminary insights toward a systematic approach to size a fleet of shared vehicles given actual mobility patterns. These results are then applied, using actual transportation and traffic statistics, to the problem of fleet siz- ing for a shared-mobility system in Singapore. Financial estimates for a variety of car-sharing systems are provided to assess their financial feasibility. While the main motivation of this paper is provided by automated shared-vehicle systems, the results are applicable to more general cases, including, e.g., a fleet of shared vehicles, each with a human driver, coordinating with other drivers in such a way to maximize the quality of service provided to the customers (as opposed to their own interests, as is the case with current models of taxi services).
- 4. Automated Mobility-on-Demand Systems 3 2 Shared-mobility systems The efficiency gains that shared-vehicle systems can, in theory, offer to both the individual user and society as a whole have been well documented [3]. For select cities, including Singapore, lists of these advantages have even been specifically compiled [4]. To date, the majority of car-sharing programs feature a roundtrip ve- hicle rental model. In these systems, vehicles must be returned to the same station they were rented from. Zipcar’s current rental service, for example, is based on this approach. Eager to capitalize on emerging markets and better serve existing ones, considerable effort has been devoted to characterizing the demand for shared- vehicle mobility in different markets [5]. Naturally, demographic factors, e.g., [5] and [6], and geographic considerations, e.g., [7] and [8], affect demand. However, researchers have also been quick to note the important role quality of service plays in establishing a clientele [9]. For example, by fielding larger vehicle fleets, compa- nies make it easier for patrons to rent a vehicle from a nearby station. This, in turn, draws new members to the program [10]. As this effect takes hold, yet more vehicles are required to maintain the high level of service that initially attracted users. Noting the limitations in the roundtrip rental model, one-way car-sharing ser- vices, such as car2go, have emerged. These services offer the added convenience of being able to return a vehicle to any one of multiple stations throughout the city [9]. However, left unchecked, asymmetries in travel patterns would, in general, create a surplus of vehicles at select stations, while leaving other stations underserved. Rebalancing mechanisms are therefore required to realign the supply of vehicles with the demand. Moreover, how effectively vehicles are shuffled between stations strongly affects vehicle availability, which, in turn, impacts demand for the service. Simulation-based approaches have been used to infer the viability of various re- balancing schemes and, in turn, gauge consumer demand for one-way car-sharing, e.g., [11–15]. Initial findings suggest that one-way services are ideally suited for densely-populated urban centers. Unfortunately, the lack of insight in the presence of a large number of relevant but uncertain parameters has been noted as a limitation of predominantly simulation-driven methods [9]. A more theoretical direction has been pursued in a number of recent works aimed at understanding optimal rebalanc- ing strategies, and the fundamental limits of stability and performance in car sharing systems, either considering automated or human-driven vehicles [16–18]. Each of the works referenced thus far focus on one or more important aspects of car-sharing systems. However, none of them tackle the more holistic problem of rigorously sizing the fleet for an Automated Mobility-on-Demand (AMoD) ser- vice to meet the transportation demand of an actual city. In this regard, [19], similar to this work, is noteworthy; it takes a design-oriented approach to fleet-sizing for hypothetical shared-vehicle systems at three sites across the United States (US). The approach used therein is heavily simulation-based and the spatial component of the demand model was not derived from real-world data. In contrast, we provide guidelines to size an AMoD system for Singapore based on measurable travel char- acteristics and, to the extent possible given the current technical literature, rigorous theoretical arguments.
- 5. 4 K. Spieser, K. Treleaven, et al. 3 Fleet Sizing for Automated Mobility-on-Demand Systems In this section, we present the two key technical problems considered in the paper. The problem statements are straightforward, but they are posed in terms of formal mathematical models of the physical environment and transportation demand. 3.1 Problem Formulation Consider a compact planar region (environment) Q ⊂ R2. The i-th transportation demand in a random sequence {(ti,oi,di)}i∈N poses the requirement to travel from an origin point oi ∈ Q to a destination point di ∈ Q. The demand, however, is only revealed after time ti. Trip requests are to be serviced by vehicles that may transport at most one demand at a time. The average speed of the vehicles v is assumed to be periodically time-varying. A significant challenge to trip scheduling stems from un- certainty in the travel demand, which we will model probabilistically. Transportation demands arrive according to a non-stationary, (separably) spatio-temporal Poisson process (λ, f), where λ is the arrival rate function, and f is a probability distribution function called the demand distribution; both are periodically time-varying. The in- dividual trip data are all statistically independent, and the i-th O-D pair (oi,di) is conditionally distributed according to f(·;ti). The expected number of demands re- vealed within a time interval [t1,t2], and with oi ∈ Q1 and di ∈ Q2, for any time t and regions Q1,Q2 ⊂ Q, is t2 t1 Q2 Q1 λ(t)f(p,q,t) dpdqdt. The problems of interest are the following: 1. Minimum fleet sizing: What is the minimum number of vehicles, mmin, neces- sary to keep the number of outstanding demands uniformly bounded? 2. Performance-driven fleet sizing: How many vehicles, mper, should be used to ensure that the quality of the service provided to the customer (e.g., vehicle avail- ability, or waiting time) is no less than a given threshold? The second problem acknowledges an intuitive trade-off between the fleet size and the user experience (beyond the bare minimum). In the following, we provide techniques to address the fleet sizing problems in the case of Singapore. Interested readers may refer to, e.g., [17] and [18] for similar problems defined with regard to a system of stations embedded in a road network, instead of a compact region in the Euclidean plane. 3.2 Minimum fleet sizing As mentioned in Section 3.1, the problems of interest pertain to fleet sizing for a pickup-and-delivery system. A detailed theoretical treatment stressing the stochastic and queue-theoretic nature of the problem can be found in [16].
- 6. Automated Mobility-on-Demand Systems 5 A fleet of m vehicles is said to stabilize the workload if there exists a service (routing) policy π(m) that ensures the expected number of outstanding demands is uniformly bounded. Stability therefore implies that the fleet, as a whole, must be able to cover distance at least as quickly on average as the rate at which service distance accumulates. Given a sequence of points p1,..., pn ∈ Q, let D(p1,..., pn) denote the length of the shortest path through each point in the order specified by the sequence. The average distance that a vehicle must travel in service per demand is dtrip := limsupi→+∞ E{D(dpre(i),oi,di)}, where pre(i) is the index of the demand served immediately before the demand i. If the temporal variation of travel demand is discretized into, e.g., hourly temporal bins, the rate at which work enters the sys- tem is ∑k(λk · d trip k ), where the subscript k indicates the bin index, and d trip k := limsupi→+∞ E{D(dpre(i),oi,di) : ti in bin k}. A fleet of m vehicles, each capable of traveling at average speed vk during the k-th bin, is able to cover distance at a daily rate of m∑k vk. Therefore, a necessary condition for system stability is m > ∑ k λk ·d trip k /∑ k vk. (1) Dropping the subscript k for simplicity, the average trip length can be decom- posed as dtrip = dOD + dE, where dOD = E[D(oi,di)], and dE depends on the or- dering of demands served, and clearly depends on the routing policy π(m). In [16], rigorous arguments are used to prove that dE is bounded below by a computable quantity that depends on the mobility demand, and that the bound is approachable in practice. Letting fo and fd denote the first and second factors of f—i.e., the marginal distributions associated with origins and destinations, respectively—then dE ≥ EMD(fd, fo), where EMD is a function often called the Earth mover’s dis- tance, and will be defined shortly. Given the above, condition (1) becomes m > ∑ k λk(dOD k +EMD(fd k , fo k )) /∑ k vk. (2) Formally, the Earth mover’s distance EMD(fo, fd) is a measure of distance be- tween distributions fo and fd; in mathematical terms, given the ground metric (Q,D), the EMD is the first Wasserstein distance [20], usually written as EMD(f1, f2) = inf γ∈Γ (f1,f2) Q×Q D(p1, p2)dγ(p1, p2), (3) where Γ (f1, f2) is the set of all measures with marginals f1 and f2 on the first and second factor, respectively. If distributions f1 and f2 are imagined as describing two piles each consisting of a unit of “dirt” (i.e., earth), then EMD(f1, f2) is intuitively the minimum work (dirt × distance) required to reshape f1 into f2. Although some existing works are keen to emphasize the relationship between dOD and mmin, they often fail to recognize the contribution of dE ≥ EMD(fo, fd). This is an unfortunate omission as EMD(fo, fd) represents the minimum distance,
- 7. 6 K. Spieser, K. Treleaven, et al. on average, a vehicle must travel to realign itself with an asymmetrical travel de- mand, and is a fundamental contributor to system workload. It is justifiable to ig- nore EMD(fo, fd) only when fo = fd, because in this case EMD = 0. However, in most real cases, including Singapore, fo and fd are different on the time scales over which trips must be completed. 3.3 Performance-driven fleet sizing The analysis in the previous section provides crucial information about absolute minimum fleet sizes to ensure user demand can (in principle) be met. These results help to answer whether a particular fleet size is “large enough.” However, another important question which is left unanswered is how the size of the fleet impacts the user experience, e.g., by decreasing user wait times or by increasing vehicle availability. It may be quite valuable to quantify more accurately such trade-offs. In this work, we study performance in terms of vehicle availability. To this pur- pose, we model an autonomous MOD system as a closed queueing network of m vehicles and N disjoint regions Q1,Q2,...,QN ⊂ Q. Idle vehicles are parked at the median of each region. When a customer arrives in region Qi, destined for Qj, a free vehicle in Qi is sent to pick up and drop off the customer before parking at the median of Qj. Customers arrive in each region Qi ⊂ Q according to a Poisson process with rate λi and take vehicles to region Qj with probability pij. To maintain tractability for analytical results, we consider a simple model where if a region is empty of available vehicles, the customer immediately leaves the system (this model is usually referred to as loss model, which models well customer impatience). The performance criterion is then the availability of vehicles in each region, or the prob- ability that a customer will be able to book a vehicle in his/her region. This model of a MOD system can be analyzed as a closed Jackson network with respect to the vehicles. Jackson networks are a special case of a class of queue- ing networks known as BCMP networks [21], which, remarkably, admit station- ary probability distributions in product form. In our case, regions are mapped into single-server nodes, while routes between each pair of regions are mapped into infinite-server nodes (note that we are not modeling congestion effects). Thanks to the product form of the probability distributions, the availability of vehicles in each region can be efficiently computed using mean value analysis (see, e.g., [22]). Previous work such as [22] used this model to generate guidelines for system design and perform profit-based fleet sizing. However, their analysis shows that without re- balancing the majority of regions can only achieve an availability strictly less than one even if m tends to infinity. To take into account the possibility of vehicle re- balancing offered by autonomous vehicles, we model the rebalancing process as an arrival process of “virtual passengers” with Poisson rate ψi and routing probability αij, independent of the real passenger arrival process. As with real passengers, the virtual passengers are lost if no vehicles are available in the booking region upon arrival. We can then optimize the availability with respect to ψi and αij to achieve a
- 8. Automated Mobility-on-Demand Systems 7 balanced system so that availability approaches one as m tends to infinity, for all re- gions. The approach is similar to that developed in [17], and allows us to determine performance curves in terms of m and vehicle availability. Also, it provides baseline policies that would guide the development of real-time closed-loop vehicle routing policies as in [17]. 4 Data sources In order to apply our analytical results to estimate fleet size for a real-world scenario, we chose to consider Singapore as a case study. Singapore is a fitting venue for at least two reasons: First, we have access to a rich collection of data pertaining to the country, from which to gather the statistics that drive our analytics. Second, despite Singapore’s sophisticated and well-subsidized public transportation system, the rate of private vehicle ownership, and correspondingly traffic congestion, continues to increase. Given the island’s diminutive size and high population density, officials are limited in the extent to which traditional measures, e.g., roadway expansion, can alleviate rising congestion. In this regard, Singapore is a promising candidate for replacing existing modes of land transport with shared vehicles for personal mobility, i.e., an AMoD system. To support the analysis of such scenario, three complementary data sources are used, as described below. The Household Interview Travel Survey— The Household Interview Travel Survey, or simply HITS, is a comprehensive survey conducted periodically by the Land Transport Authority (LTA) for the purpose of gathering an overview of high- level transportation patterns within Singapore [23]. This work employed the 2008 HITS survey in which 10,840 of the then 1,144,400 households in Singapore were selected to participate in the survey. The HITS database, which summarizes the sur- vey, is structured as follows. For each household surveyed, each resident reported specific details of each trip taken on a recent weekday of interest. In general, each trip is comprised of several stages with a new stage introduced each time the partic- ipant switched their mode of transport, e.g., transferred from the subway to bus as part of the same trip. For each trip, the resident reported the trip’s origin point, des- tination point, start time, end time, and the mode of transport, e.g., car, bus, subway, etc., used in each substage. Singapore Taxi Data—To gather ground truth traffic characteristics, we rely on a database of taxi records collected over the course of a week in Singapore in 2012. The data chronicles the movement and activities of approximately 60% of all active taxis by recording each vehicle’s GPS coordinates, speed, and passenger status, e.g., “passenger-on-board,” “vacant,” “responding to call,” etc. Owing to the high rate at which recordings are taken, approximately every 30 seconds to 1 minute per vehicle, and the large number of taxis contributing to the database (approximately 15,000), the fleet, collectively, serves as a distributed, mobile, embedded traffic sensor which may be queried to provide an estimate of traffic conditions throughout the city.
- 9. 8 K. Spieser, K. Treleaven, et al. Singapore Road Network— A graph-based representation of Singapore’s road network is used to determine the most efficient routes automated vehicles should take from point to point in Singapore (whether carrying a passenger or moving to fetch one). When the analysis method required simpler distance evaluations, the average ratio of trip length over Euclidean distance was estimated from the taxi data as a factor β = 1.38. 5 Sizing an AMoD solution for Singapore Having acquired both the necessary analytical tools, and the transportation data, we are now able to compute estimates for the AMoD fleet sizing problem in Singapore. 5.1 Minimum fleet sizing This section describes the methodology used to estimate the quantities appearing in (2). Results are summarized in Figure 1. Arrival Rate (λ)— Let λHITS k represent the average rate at which trips in hour k ∈ {0,1,...,23} arrive based solely on the HITS survey. The overall arrival rate, in hour k, is evaluated as λk = αλHITS k , where α = 1,144,400/10,840 ≈ 105.57 is the scaling factor that, inversely, reflects the fraction of the households that took part in the HITS survey. From the HITS data, 56,839 trips were extracted. After eliminating trips for which the GPS coordinates of o, d, or both were unavailable, 56,673 trips remained. Average O-D Distance (dOD)— For each O-D pair in the HITS database, we assume the trip takes place on the shortest path (as measured by distance) connecting o and d. Shortest path algorithms, e.g., Dijkstra’s algorithm, are computationally efficient, allowing calculations to be run on a detailed roadmap of Singapore. On an hourly basis, dOD k ranges from a minimum of 6.47km to a maximum of 13.31km. Mobility Demand Distribution ( f)— The road network of Singapore was di- vided into road segments, each of length no greater than 6km. Each pair of such segments was treated as a bin, and a trip was assigned to bin (a,b) if its origin was on segment a and its destination was on segment b. The demand distribution estimate f is taken as the distribution whose sampling procedure is: (i) choose a bin (a,b) with probability proportional to the number of trips, then (ii) produce O- D pair (o,d), with o and d independent and uniformly distributed, over a and b, respectively. Earth Mover’s Distance — To estimate EMD, Singapore was partitioned into regions R1,...,RN. Origin and destination points of trips were assigned to the cor- responding regions, thus defining pick-up and drop-off bins. The EMD is computed using a linear program that minimizes the amount of work, i.e., the cumulative dis- tance traveled by all points in the pick-up bins, required to transform the distribution
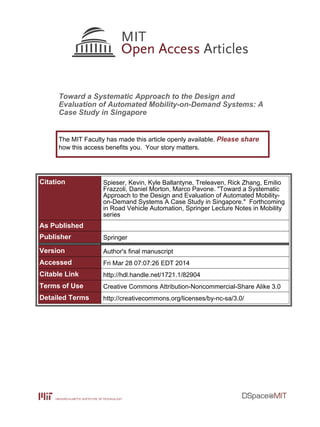
- 10. Automated Mobility-on-Demand Systems 9 of origin points into the distribution of destination points. The distances involved in this calculation are inherently Euclidean; the previously described scaling factor β = 1.38 was used to approximate the distance on the underlying road network. See also [24] for a more accurate method to estimate EMD on road networks. Average Velocity (v)— Taxi data was used to determine a conservative estimate of the average speed at which occupied taxis move about the city in the current traffic conditions. This value is then used as an estimate for v in (2). Note that this does not take into account potential decreases in congestion due to vehicle sharing. To determine how fast, on average, an individual taxi travels, the total distance trav- eled by the taxi, with a passenger on board, was divided by the total associated time during each hour of the day over the course of a typical week in Singapore. Minimum fleet size—Given the aforementioned quantities, (2) yields that at least 92,693 automated vehicles are required to ensure the transportation demand remains uniformly bounded. Note however, that this should only be seen as a lower bound on the fleet size, since customer waiting times would be unacceptably high. Fig. 1 Summary of the data necessary for the evaluation of the minimum fleet size. According to Eq. (2) the min- imum fleet size to serve all of Singapore’s mobility demand is 92,693 shared vehicles. To gain an appreciation for the level of vehicle sharing possible in an AMoD sys- tem of this size, consider that at 1,144,400 households in Singapore, there would be roughly one shared car every 12.3 households. 0 5 10 15 20 0 10 20 30 40 50 60 70 80 90 Hour of day d od [km] dod +EMD [km] v [km/h] λ ⋅ 10 −4 5.2 Performance-driven fleet sizing Finally, we consider how much the fleet size should be increased in order to reduce the waiting times of customers to acceptable levels. We use the technique described in Section 3.3. To apply the approach to Singapore, the HITS data is first used to partition the city’s road network into N = 100 regions using k-means clustering. This number of regions corresponds to an average driving time from booking to pickup of 2.3 minutes. The system parameters λi, pij, and Tij are estimated using trip data between regions. Vehicle availability was analyzed in two representative cases. The first was cho- sen as the 2-3pm bin, since it is the one that is the closest to the “average” traffic
- 11. 10 K. Spieser, K. Treleaven, et al. 0 2 4 6 8 10 x 10 5 0 0.1 0.2 0.3 0.4 0.5 0.6 0.7 0.8 0.9 1 m (Number of vehicles) Vehicleavailability Average demand Peak demand 0 5 10 15 20 25 0 10 20 30 40 50 60 70 Time of day (hours) Expectedwaittime(min) 200,000 Vehicles 250,000 Vehicles 300,000 Vehicles Fig. 2 (Left) Performance curve with 100 regions, showing the availability of vehicles vs. the size of the system for both average demand (2-3pm) and peak demand (7-8am). (Right) Average wait times over the course of a day, for systems of different sizes. condition. The second case considers the 7-8am rush-hour peak. Results are sum- marized in Figure 2 (left). With about 200,000 vehicles availability is about 90% on average, but drops to about 50% at peak times. With 300,000 vehicles in the fleet, availability is about 95% on average and about 72% at peak times. In a real MoD system passengers would typically wait for the next available vehicle rather than leave the system immediately if no vehicles are available upon booking. Thus, it is important to characterize how the availability criterion relates to customer waiting times in a practical system. We characterize the customer waiting times through simulation, using a closed-loop rebalancing policy inspired by the loss model, where rebalancing is performed every 30 minutes by minimizing the distance travelled by rebalancing vehicles while evenly distributing the free vehicles across all the stations. For the average-demand case, a fleet of 200,000 vehicles corresponds to expected booking times of less than a minute, to which one must add the pickup driving time, for a total of about 3 minutes between booking and pickup. Figure 2 (right) shows simulations results of average wait times over the course of a day. For 250,000 vehicles, the maximum wait times during peak hours is around 30 minutes, which is comparable with typical congestion delays during rush hour. With 300,000 vehicles, peak wait times are reduced to less than 15 minutes. To put these numbers into perspective, in 2011 there were 779,890 passenger vehicles operating in Singapore [25]. 6 Financial Analysis Other benefits notwithstanding, financial considerations will undoubtedly factor in to if and when cities switch to an AMoD system. To understand the costs associ- ated with such a move, we consider the total mobility cost (TMC) for users in two competing transportation models. In each case, we consider not only the explicit costs to access mobility, but also hidden costs attributed to the time invested in var-
- 12. Automated Mobility-on-Demand Systems 11 ious mobility-related activities. Within this framework, our analysis indicates that an AMoD system is a financially viable alternative to private vehicle ownership in Singapore. Moreover, to gain an appreciation for the financial benefits of installing AMoD systems in other markets, we provide similar estimates for a typical city in the US. Throughout, all costs are reported in US dollars, with an assumed exchange rate of 1.25 SGD/USD. The competing transportation models will be referred to as Systems 1 and 2. In System 1, users access personal-mobility by purchasing (or leasing) a private vehicle. Vehicles in System 1 must be operated by a human driver and are referred to as human-driven cars (HDCs). In this way, System 1 represents personal mobility as we know it today. Conversely, in System 2, users access personal mobility by subscribing to a shared AMoD fleet of vehicles. Vehicles in System 2 are referred to as shared self-driving cars (SSDCs). Based on the findings in Section 5.2, estimates for an AMoD fleet size in Singa- pore correspond to a sharing ratio of approximately 3.5–4.5. For simplicity, we will assume that, on average, 4 people effectively share a single SSDC. 6.1 The explicit cost of mobility For System i, the cost of service (COSi) is defined to be the sum of all explicit costs associated with accessing mobility. For example, in System 1, COS1 reflects, among other expenditures, the costs to individually purchase, service, park, insure, and fuel a private vehicle. In Singapore, the estimated annual cost to own a mid-sized car, including parking expenses, is approximately $18,162/year [26]. In the US, assum- ing an annual mileage of 21,580 km/year, and factoring in the $1,992/year spent on parking [27], the equivalent figure is $11,315/year [28]. The disparity between Singaporean and US numbers is due primarily to hefty ownership taxes and traffic tolls within Singapore. In System 2, fielding a fleet of SSDCs will, initially, require retrofitting pro- duction vehicles with the sensors, actuators, and computational power required for automated driving. While still relatively expensive, it is expected that with techno- logical advancement, the needed components and customizations will become more affordable. Assuming some economies of scale for large fleets, we estimate the nec- essary retrofit of a mid-sized car can be completed for a one-time fee of $15,000. Automated capabilities will gradually be incorporated into production cycles, with fully automated vehicles eventually rolling off assembly lines. Cost savings associ- ated with mass production suggest these figures have the potential to be significantly smaller in coming years and as AMoD systems become more prevalent. From the fleet-sizing arguments of Section 5.2, one SSDC in System 2 can ef- fectively serve the role of 3.5–4.5 HDCs in System 1. However, this reduction in vehicles on the road requires a typical SSDC to drive much farther, per day, than an HDC in System 1. Consequently, a typical SSDC in System 2 will depreciate at a faster rate than an HDC in System 1. Accounting for both usage-driven and age-
- 13. 12 K. Spieser, K. Treleaven, et al. related depreciation, we conservatively estimate that a SSDC will have an average lifespan of 2.5 years [29]. Moreover, these high utilization rates and the shared na- ture of SSDCs will require significant maintenance and cleaning budgets to uphold high levels of customer safety and satisfaction. The routine of a typical SSDC consists of dropping off one passenger and im- mediately departing to pick up a new passenger. A positive side-effect of this func- tionality is a drastic reduction, as compared to System 1, in the demand for parking spaces on high-value land. Moreover, should an overabundance of SSDCs develop, e.g., in the hours after the morning rush to work, surplus SSDCs can park them- selves in structures or on lots occupying low-valued land (or even earn extra revenue providing a solution for logistics, e.g., shipping parcels and goods within the city). With respect to fuel usage, the central authority that manages System 2 may ne- gotiate bulk fuel deliveries and benefit from discounted rates. Additionally, SSDCs may be programmed to drive in fuel-efficient ways, e.g., by employing gradual ac- celeration and proactive breaking techniques to realize further savings. Tallying the aforementioned costs on a fleet-wide scale and distributing the sum evenly among the intended user base (i.e., the entire population) gives a COS2 of $12,563/year in Singapore and $9,728/year in the US. According to COS values, it is more affordable to access mobility in System 2 than System 1. However, the analysis thus far does not reflect the value of the time saved in System 2 by avoiding the more burdensome mobility-related obligations in System 1. For example, users in System 2 not only avoid paying for parking, as reflected in COS2, they also spare themselves the hassle of searching for park- ing spaces. As the following discussion attests, accounting for these factors further substantiates the financial advantages of AMoD technology. 6.2 The hidden cost of mobility Following an approach first pioneered to explore the hidden costs of owning a per- sonal computer in the 1980s [30], we define the value of time (VOT) to be the monetary valuation of the total time invested in mobility related activities. For ex- ample, in System 1, VOT1 reflects, among other commitments, the time spent tak- ing a car to get a tuneup, paying (or contesting) traffic tickets, renewing license plates, and driving the car. The total mobility cost of System i is then given by TMCi = COSi +VOTi, i = 1,2. The American National Household Travel Survey estimates that an individual spends 465 hours/year in their car [31]. In addition, drivers begin and end each trip by spending an estimated 4 minutes traveling to or from their parked vehicle [32], or, at an average of 3.8 trips per day [33], 175 hours/year. Factoring in the time re- quired to renew license plates, pay tickets, tow a broken-down vehicle, wait while the vehicle is serviced etc., we estimate the total time spent on vehicle ownership and operation related activities in System 1 to be 885 hours/year in the US. Sim- ilar studies are not yet available for Singapore. However, given an average travel
- 14. Automated Mobility-on-Demand Systems 13 distance of 19,000 km/year [25], and the average driving speed on roads, private vehicle owners in Singapore spend, on average, 458 hours/year driving in their car. Factoring in the time parking and other related activities brings this total to 747 hours/year. To monetize the preceding values, we use the Value of Travel Time Savings (VTTS) numbers laid out by the Department of Transportation (DOT) for perform- ing a Cost Benefit Analysis (CBA) of transportation scenarios in the US [34], [35]. The CBA is used by governments to decide whether or not to proceed with major traffic-related projects, e.g., bridge construction or highway expansion. For various trip scenarios, the VTTS is expressed as a fraction of the median income based on the level of comfort for various in-car trips; less comfortable scenarios incur higher costs. For example, in free-flowing traffic, personal trips on local roads are priced at 50% of the median wage ($10.80/hour in Singapore and $12/hour in the US) [36]. Business trips on local roads are valued at 100% of the median wage [37]. Personal trips between cities are considered a greater inconvenience; as such, they are priced slightly higher, at 75% of the median wage. Traveling on heavily congested traffic increases the VTTS to 150% of the median wage [38]. Similar values are available for pricing other-driving related activities, e.g., parking a car. Applying the appropriate VTTS values based on actual driving patterns gives VOT1 = $14,460/year in Singapore and $18,295/year in the US. Adding in the as- sociated COS gives an annual TMC1 of $32,622/year or $1.72/km in Singapore and $29,610/year or $1.37/km in the US. The latter value is significantly higher than the $0.49/km reported by AAA for travel in the US [39]. Furthermore, for all the media attention paid to gasoline prices, fuel costs comprise only six percent of TMC1. To compute VOT2, we take a closer look at the activity breakdown associated with taking a trip in an AMoD system. This includes the time spent requesting, waiting for, entering, traveling in, and exiting an SSDC. Given the capabilities of an SSDC, users in System 2 spend no time parking and limited time walking to and from the vehicle. We assume that requesting an SSDC would take no more than 1 minute, and that the fleet is sized such that users wait, on average, no more than 5.5 minutes for a requested vehicle to show up. Given AMoD systems do not yet exist, there are no published VTTS value for the time spent traveling in a SSDC. We price sitting comfortably in an SSDC while being able to work, read, or simply relax at 20% of the median wage. This is significantly lower than the average of 67% of the median wage rate used to compute VOT1. Working from the figures above, VOT2 is $4,959/year in Singapore and $5,527 in the US/year, approximately one third of the corresponding VOT1. For an individual who is a high wage earner or spends an above average amount of time traveling by car, the gains are even greater.
- 15. 14 K. Spieser, K. Treleaven, et al. Table 1 Summary of the financial analysis of the mobility-related cost for the mobility models discussed in the text. (The average Singaporean drives 18,997 km in a year, the average American drives 21,581 km in a year.) Cost [USD/km] Yearly cost [USD/year] Singapore United States Singapore United States COT VOT TMC COT VOT TMC COT VOT TMC COT VOT TMC HDC 0.96 0.76 1.72 0.52 0.85 1.37 18,162 14,460 32,622 11,315 18,295 29,610 SSDC 0.66 0.26 0.92 0.45 0.26 0.71 12,563 4,959 17,522 9,728 5,527 15,256 SDMC 0.66 0.51 1.17 0.45 0.50 0.95 12,563 9,683 22,246 9,728 10,835 20,563 PSDC 1.09 0.22 1.31 0.62 0.21 0.83 20,712 4,160 24,872 13,408 4,567 17,976 Taxi 1.06 0.26 1.32 — —- — 20,169 4,959 25,128 — —- — 6.3 Alternate mobility models To further illustrate how the shared and automated nature of System 2 reduces the TMC for the average user, we briefly consider three additional systems. System 3 consists of Shared Dual-Mode Cars (SDMCs). An SDMC is driven by a human when one or more passengers is onboard, but drives autonomously when vacant. SDMCs therefore have the ability to rebalance themselves in order to meet the travel demand. System 4 is comprised of Personal Self-Driving Cars (PSDCs), each func- tionally equivalent to an SSDC, but owned and operated by a single individual. Finally, System 5 models a world in which human-driven taxis provide personal mobility (in place of private cars) for the population. For each system, we used sim- ilar techniques to estimate the TMC for installations in both Singapore and the US. (The taxi model was only evaluated in Singapore, due to the central role played by taxis in Singapore’s transportation system, and to the numerous different ways taxi services are operated throughout the US.) 6.4 Discussion A summary of the COS, VOT, and TMC of the five systems is provided in Table 1. Remarkably, combining COS and VOT figures, the TMC for SSDCs is roughly half of that for HDCs in both Singapore and the US. To put this into perspective, these savings represent about one third of GDP per capita. On a relative basis, the savings afforded by AMoD technology in Singapore stem largely from the ability to split the hefty cost of car ownership. In the US, the savings are predominantly the result of being able to travel more comfortably and eliminate parking activities. From the preceding arguments, the true cost to access mobility includes not only an explicit financial investment, but also a significant investment of valuable time. These factors combined, our analysis reveals it is much more affordable to access mobility in an AMoD system compared to traditional mobility models based on private vehicle ownership.
- 16. Automated Mobility-on-Demand Systems 15 7 Conclusions and Future Directions This paper has provided analytical guidelines for rigorously sizing Automated Mobility-on-Demand (AMoD) systems based on transportation data. Namely, bounds were provided for the minimum number of vehicles required to (i) meet the trans- portation demand in Singapore and (ii) keep the waiting times below an acceptable threshold. Results suggest that an AMoD solution could meet the personal mobility need of the entire population of Singapore with a fleet whose size is approximately 1/3 of the total number of passenger vehicles currently in operation. Moreover, a financial analysis indicates AMoD systems are a financially viable alternative to more-traditional means of accessing personal mobility. Given the multifaceted nature of AMoD systems, the results reported herein sug- gest a number of natural extensions. For example, it remains to thoroughly quantify the extent to which traffic congestion can be alleviated via an automated shared- vehicle solution. In other words, although our solution requires far fewer vehicles than are currently on the road, it mandates the total distance traveled be greater, due to empty vehicles realigning themselves with the demand distribution. Given these competing forces, it remains to certify the net effect is indeed a reduction in travel times and congestion levels. Acknowledgements This work was partially supported by the Singapore National Research Foun- dation, under the Future Urban Mobility SMART IRG program. The authors are grateful to the Land Transport Authority of Singapore for providing access to the HITS data. References 1. M. Buehler, K. Iagnemma, and S. Singh, editors. The DARPA Urban Challenge: Autonomous Vehicles in City Traffic. Number 56 in Springer Tracts in Advanced Robotics. Springer, 2009. 2. A. Eskandarian, editor. Handbook of Intelligent Vehicles. Springer, 2012. 3. W.J. Mitchell, C.E. Borroni-Bird, and L.D. Burns. Reinventing the automobile: personal urban mobility for the 21st century. MIT Press, 2010. 4. B. Edelman. Towards improvement in Singapore’s transportation efficiency and environmental impact. submission to the National Climate Change Secretariat of Singapore, 2011. 5. C. Costain, C. Ardon, and K. Habib. Synopsis of users behavior of a carsharing program: a case study in Toronto. Proc. of Transportation Research Board Annual Meeting, 2012. 6. D. Brook. Carsharing: startup issues and new operational models. Proc. Transportation Re- search Board Annual Meeting, 2004. 7. R. Cervero. City CarShare: First-year travel demand impacts. Transportation Research Record, 2003. 8. T. Stillwater, P. Mokhtarian, and S. Shaheen. Carsharing and the built environment: A GIS- based study of one U.S. operator. Institute of Transportation Studies, University of California, 2008. 9. D. Jorge and G. Correia. Carsharing systems demand estimation and defined operations: a literature review. European Journal of Transportation Infrastructure Research, 2013. 10. A Lorimier and El-Geneidy. Understanding the factors affecting vehicle usage and availabil- ity in carsharing networks: a case study of Communauto carsharing from Montreal, Canada. International Journal of Sustainable Transportation, 2011.
- 17. 16 K. Spieser, K. Treleaven, et al. 11. D. Papanikolaou. A new system dynamics framework for modelling behavior of vehicle shar- ing systems. Proc. of Symposium on Simulation for Architecture and urban design, 2011. 12. J. Barrios. On the performance of flexible carsharing: a simulation-based approach. j, 2012. 13. M. Barth and M. Todd. Simulation model performance analysis of a multiple shared vehicle system. Transportation Research Record, 1999. 14. A. Kek, R. Cheu, and M. Chor. Relocation simulation model for multiple-station shared-use vehicle systems. Transportation Research Record, 2006. 15. D. Efthymiou, C. Antoniou, and Y. Tyrinopoulos. Spatially aware model for optimal site selection: method and application in a greek mobility center. Transportation Research Record, 2012. 16. K. Treleaven, M. Pavone, and E. Frazzoli. Asymptotically optimal algorithms for one-to- one pickup and delivery problems with applications to transportation systems. IEEE Trans. Automatic Control, (9):2261–2276. 17. M. Pavone, S. L. Smith, E. Frazzoli, and D. Rus. Int. Journal of Robotics Research. 18. S.L. Smith, M. Pavone, M. Schwager, E. Frazzoli, and D. Rus. Rebalancing the rebalancers: Optimally routing vehicles and drivers in mobility-on-demand systems. In American Control Conference, 2013. 19. L. D. Burns, W.C. Jordan, and B. A. Scarborough. Transforming personal mobility. The Earth Institute, 2013. 20. L. Ruschendorf. The Wasserstein distance and approximation theorems. Probability Theory and Related Fields, 70:117–129, 1985. 21. Forest Baskett, K. Mani Chandy, Richard R. Muntz, and Fernando G. Palacios. Open, closed, and mixed networks of queues with different classes of customers. J. ACM, 22(2):248–260, April 1975. 22. David K George and Cathy H Xia. Fleet-sizing and service availability for a vehicle rental sys- tem via closed queueing networks. European Journal of Operational Research, 211(1):198– 207, 2011. 23. Singapore Land Transport Authority. 2008 household interview travel survey background information. 2008. 24. K. Treleaven and E. Frazzoli. An Explicit Formulation of the Earth Movers Distance with Continuous Road Map Distances. ArXiv e-prints, September 2013. 25. Land Transport Authority. Singapore land transit statistics in brief. 2012. 26. R. Ong. Ride or drive?: The cost of car ownership vs. public transport in Singapore. Mon- eySmart.sg, 2011. 27. Colliers International. 2012 parking rate survey. 2012. 28. American Automobile Association. Your driving costs. 2013. 29. Minnesota Department of Transportation. The per mile costs of operating automobiles and trucks, 2003. 30. L. M. Ellram. Total cost of ownership. In Handbuch Industrielles Beschaffungsmanagement, pages 659–671. Springer, 2002. 31. Department of Transportation. Summary of travel trends: 2009 national household travel survey. 2013. 32. TRB Transit Cooperative Highway Research Program. Transit capacity and quality of service manual. 33. U.S. Department of Transportation. Summary of travel trends: 2009 national household travel survey. 2009. 34. U.S. Department of Transportation. Revised departmental guidance on valuation of travel time in economic analysis. 2011. 35. HEATCO. Harmonized European approaches for transport costing and project assessment. 2006. 36. Singapore yearbook of manpower statistics. 2012. 37. U.S. Department of Transportation. Revised departmental guidance valuation of travel time economic analysis. 2011. 38. Victoria Transport Policy Institute. Transportation cost and benefit analysis II - travel time costs. 2013. 39. American Automobile Association. Your driving costs, 2013.