Download to read offline
![International Journal of Computer Science, Engineering and Applications (IJCSEA) Vol.2, No.3, June 2012
148
sputum samples are digitized using a digital microscope. The staining of the cellular materials
varies widely in conventional pap staining. The staining color varies from slide to slide depending
on various parameters like batch of stain prepared, age of cell, type of cell and also depends on
the person preparing the slide.
Various authors have tried several methods for segmentation of nuclear regions from cytological
images. Walker et al [1], Thiran et al [2] used morphological operations for segmentation, while
Schnorrenberg et al [3], Wu et al [4] used iterative methods. Sammouda et al [5] used Hopefield
Neural Network (HNN) on RGB and HSV color spaces to extract adenocarcinoma nuclei of lung,
Tanaka et al [6],Wittke et al [7] used thresholding for segmentation on grayscale images, Meas-
Yedid et al [8] used Markov Random Field (MRF) clustering on RGB color space, Begelman et al
[9] used fuzzy logic on CIELAB color space, Hu et al [10] used a variant of active contour on
grayscale image, Phukpattaranont et al [11] applied neural network on RGB image for
segmentation. Ko et al [12] used adaptive window based on local contrast on grayscale image,
Palacios et al [13] used discrete wavelet transform and K-means clustering on HSV, LUV and
YIQ color spaces. Taher et al [14] used HNN and FCM to segment lung cells on RGB image,
Plissiti et al [15] used grayscale morphological reconstruction and connected regional minima
along with FCM and SVM to detect nuclei in pap smear images. Wang et al [16] applied graph
cut followed by active contour for nuclear segmentation.
In RGB color space the color intensity values are highly correlated so in order to extract valuable
information it has to be decorrelated. So various authors have used different color spaces for
information retrieval Huang et al [17], Chen et al [18], Zhao et al [19],Yuzheng et al [20], Anari
et al [21] used HSV color space for segmentation. Combination of color spaces [22-28] also
yielded good results. Unsupervised learning of K-means clustering [29] and Fuzzy C-means [15]
were used for cell segmentation.
2. MATERIALS AND METHODS
2.1. Materials
The sputum cytology images used in this work were provided by Pathology department, Regional
Cancer Center Thiruvananthapuram, India. The nature of cells was confirmed by expert
cytopathologist. The images were captured by using a trinocular microscope fitted with a digital
camera. The images were captured at 40X magnification level. The images are of 24 bit color
depth with a spacial resolution of 3264x2448 pixels.
2.2. Clustering Methods
In the proposed algorithm, two clustering techniques such as K-means and Fuzzy C-means are
used for segmentation.
2.2.1. K-means Clustering
K-means is an unsupervised clustering technique in which m data points with n dimension is
grouped into k separate groups, [30]
(1)](https://image.slidesharecdn.com/2312ijcsea14-180912104808/75/SEGMENTATION-OF-LUNG-GLANDULAR-CELLS-USING-MULTIPLE-COLOR-SPACES-2-2048.jpg)
![International Journal of Computer Science, Engineering and Applications (IJCSEA) Vol.2, No.3, June 2012
149
The grouping is done by minimizing the distance between data point and the centroid of the
corresponding cluster to which it falls to. Xj the data point, µi the centroid of the ith
cluster, is
the l2 norm of a vector. The algorithm is run multiple times so that no more change to the data
point happens. For this paper, k=2 is chosen, one for foreground and the other for background.
2.2.2. Fuzzy C-means Clustering
The K-means clustering assigns distinctly one group to each data point. In many applications,
especially medical application, it may not be clear to which group a particular point belongs. In
fuzzy C-means a membership value is assigned to the data point for each cluster. A data point
near the center of cluster has a high membership value to that particular cluster than a point near
the edge of the cluster. The objective function is as
(2)
µij is the fuzzy membership of the data point xi, cj is the centroid, k is the constant defining
fuzzyness of the cluster. After each iteration the membership function and cluster centroid is
updated as
(3)
(4)
2.3. Color Space Conversion
The RGB image contains pixel values which are highly correlated, so processing it directly results
in redundant information processing. To uncorrelate this data we use other color spaces like HSV,
LUV, LAB and xyY.
2.3.1. RGB to HSV
The input RGB image is normalized before converting to HSV color space image using the
following method [31].
(5)
(6)
Let, (7)
Value is (8)
Saturation is (9)](https://image.slidesharecdn.com/2312ijcsea14-180912104808/75/SEGMENTATION-OF-LUNG-GLANDULAR-CELLS-USING-MULTIPLE-COLOR-SPACES-3-2048.jpg)
![International Journal of Computer Science, Engineering and Applications (IJCSEA) Vol.2, No.3, June 2012
150
Hue is (10)
Normalized hue is (11)
2.3.2. RGB to CIELAB
CIELAB color space is derived from CIEXYZ color space. In CIEXYZ all visible colors are
represented using only positive values. The color conversion matrix is as,
(12)
The CIELAB color components are given by
(13)
(14)
(15)
Where Xw , Yw and Zw are the white tristimulus values of a perfectly reflecting diffuser under
CIE standard D65 illumination [32].
2.3.3. XYZ to xyY
CIExyY is derived from CIEXYZ color space. The conversion is as follows
(16)
(17)
(18)
2.3.4. CIEXYZ to CIELUV
LUV color space is derived from XYZ color space. The conversion is as follows
(19)](https://image.slidesharecdn.com/2312ijcsea14-180912104808/75/SEGMENTATION-OF-LUNG-GLANDULAR-CELLS-USING-MULTIPLE-COLOR-SPACES-4-2048.jpg)
![International Journal of Computer Science, Engineering and Applications (IJCSEA) Vol.2, No.3, June 2012
151
(20)
(21)
(22)
(23)
3. CELL NUCLEI SEGMENTATION
The system architecture for the proposed method to classify the sputum cytology cells is shown in
Figure 1. It includes pre-processing of Pap stained sputum cytology images followed by
segmentation of cell nuclei.
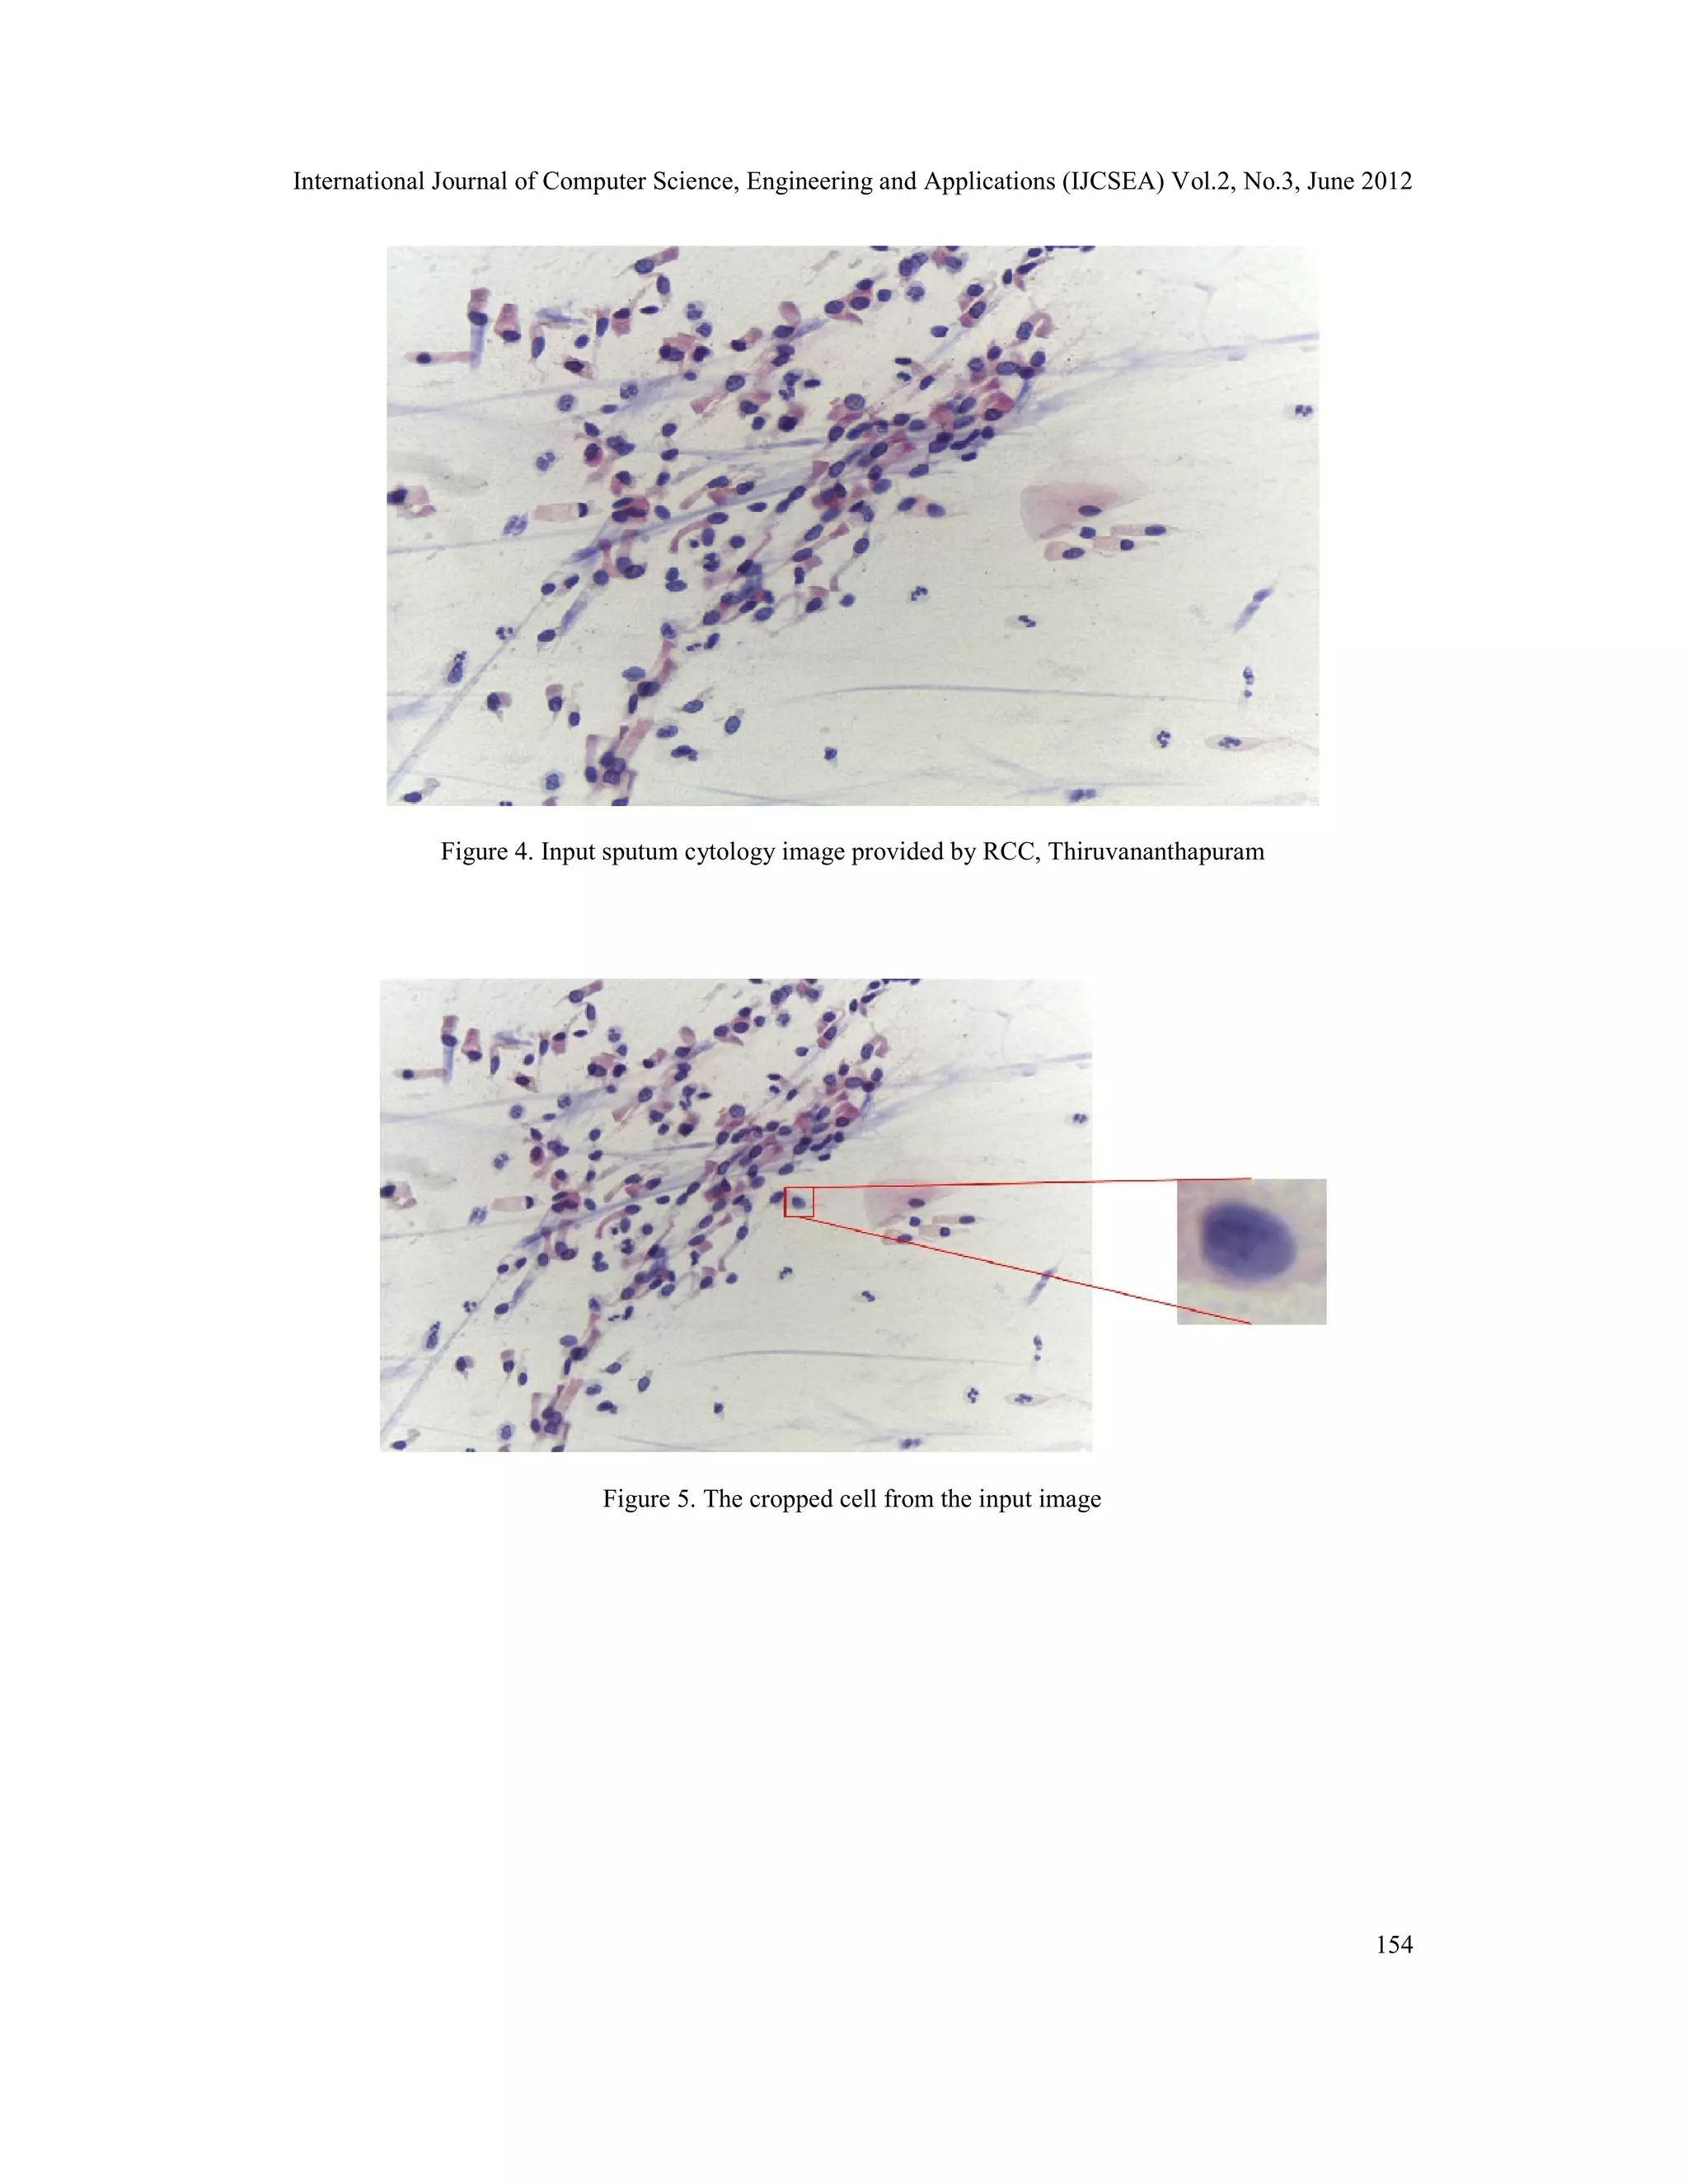
3.1. Input Image
The sputum samples taken by cytotechnologists are preserved so that the cellularity of the nuclei
is not lost. Then slides are prepared and stained using Pap stain. This is a differential stain in
which the nuclei and cytoplasm region gets stained in different color. Nuclei region being more
with dense materials will absorb more stain and appear much darker in color. The stained slide is
placed under a trinocular light microscope and images are taken. The digital camera produces a
high resolution image of 8 mega pixel (3264 X 2448) size. The slides are magnified at 40X zoom
level and images are taken. The images are stored on the workstation in RGB 24 bit color format.
Images of both malignant and benign slides are taken. The classification of the slides as benign
and malignant is done by experienced cytopathologists.
3.2. Pre Processing
The high resolution input image is very difficult to process as such so in this stage the image is
down sized to 1/8th
of the original size (408 X 306). Local minima are found on the smoothed
version of the image using Blom's method as used by Kuijper [33]. Once the local minima are
identified then the coordinate in the resized image is mapped on to the original image. This is
done by multiplying the x and y coordinates values with 8. Thus on the actual image coordinate a
128 X 128 sized image region is cropped out and is stored. The image region may contain region
without cellular material i.e., background region. This has to be eliminated for further analysis.
For this the average intensity value of the cropped region is calculated, if the value falls above
200 it is assumed to be background since nuclear region being darkly stained will have a low
Figure 1. Diagram of the proposed system](https://image.slidesharecdn.com/2312ijcsea14-180912104808/75/SEGMENTATION-OF-LUNG-GLANDULAR-CELLS-USING-MULTIPLE-COLOR-SPACES-5-2048.jpg)
![International Journal of Computer Science, Engineering and Applications (IJCSEA) Vol.2, No.3, June 2012
152
average intensity only. The sputum cytology images are infiltrated by patches of mucus which
also absorbs the stain. One more condition is given to filter out such region. The standard
deviation of the extracted region is calculated if it is above 30 then there is an adequate
distribution of dark and bright patches are present which is typical of nuclear region. All the
cropped patches are saved. The sputum sample contains a lot of artifacts like inflammatory cells,
leukocytes etc which is characteristic of the sputum sampling. These artifact regions are manually
removed so that the remaining dataset consists of only nuclear regions. The entire step of
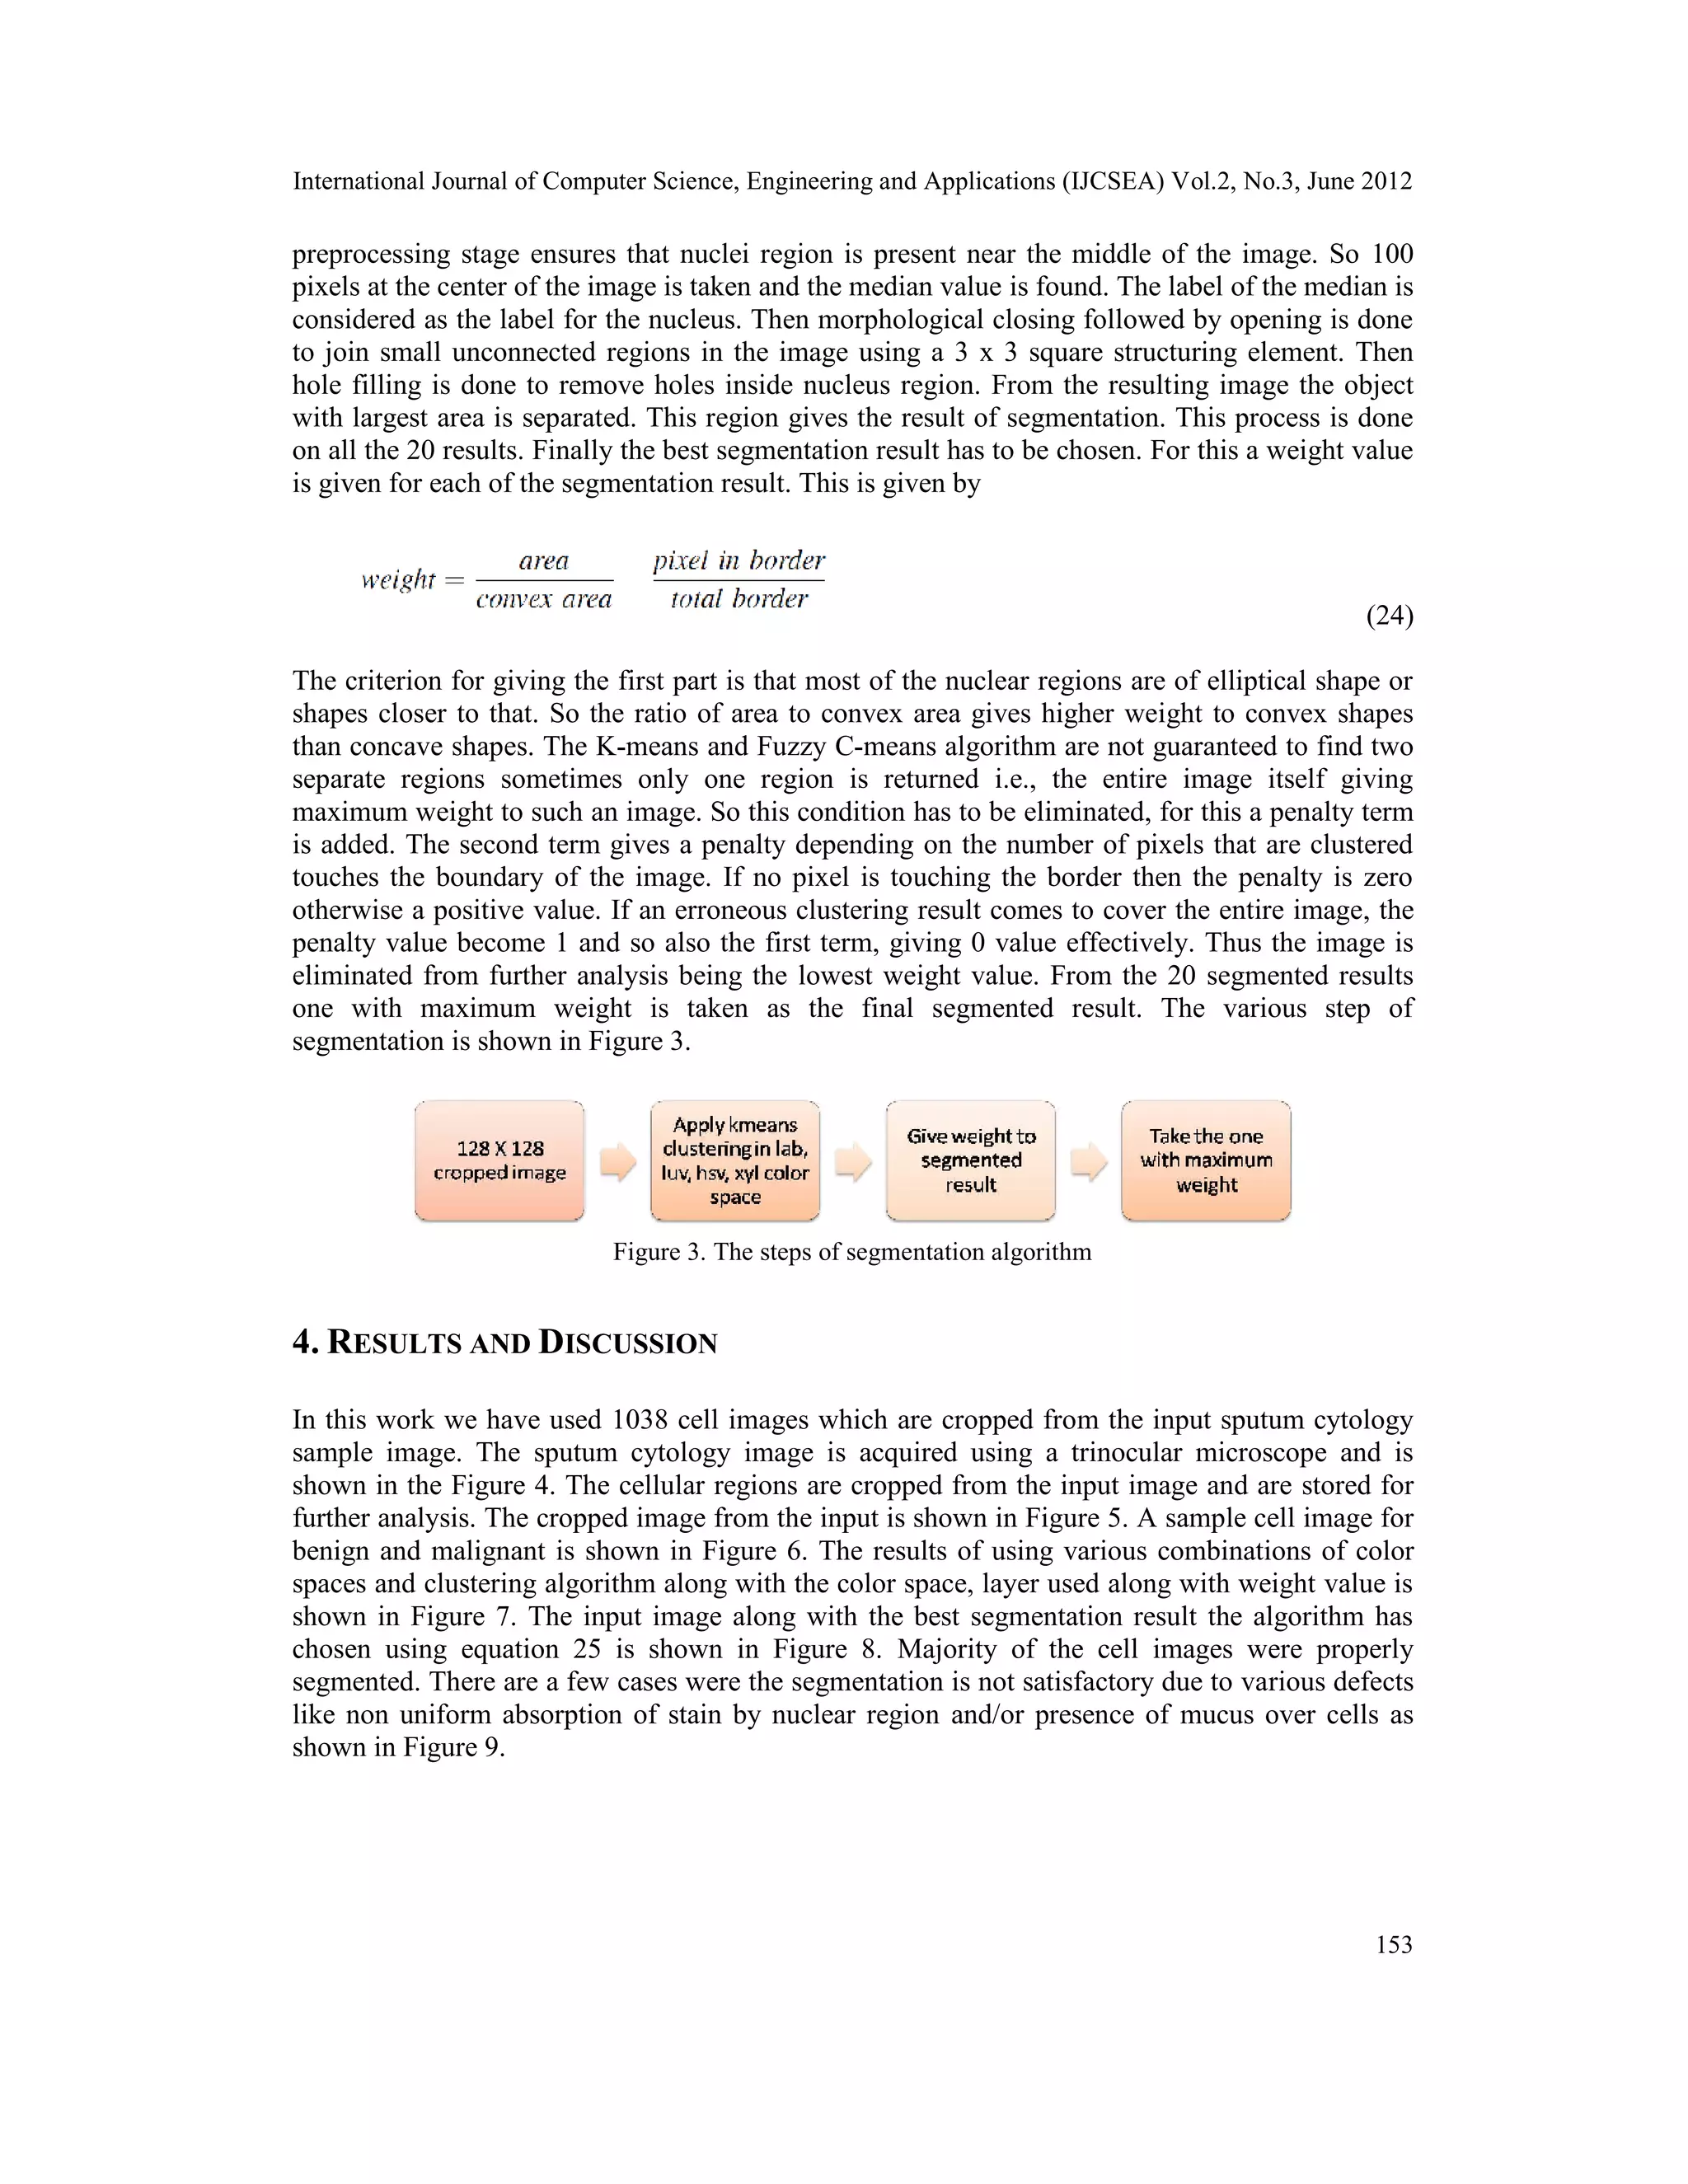
preprocessing is shown in Figure 2.
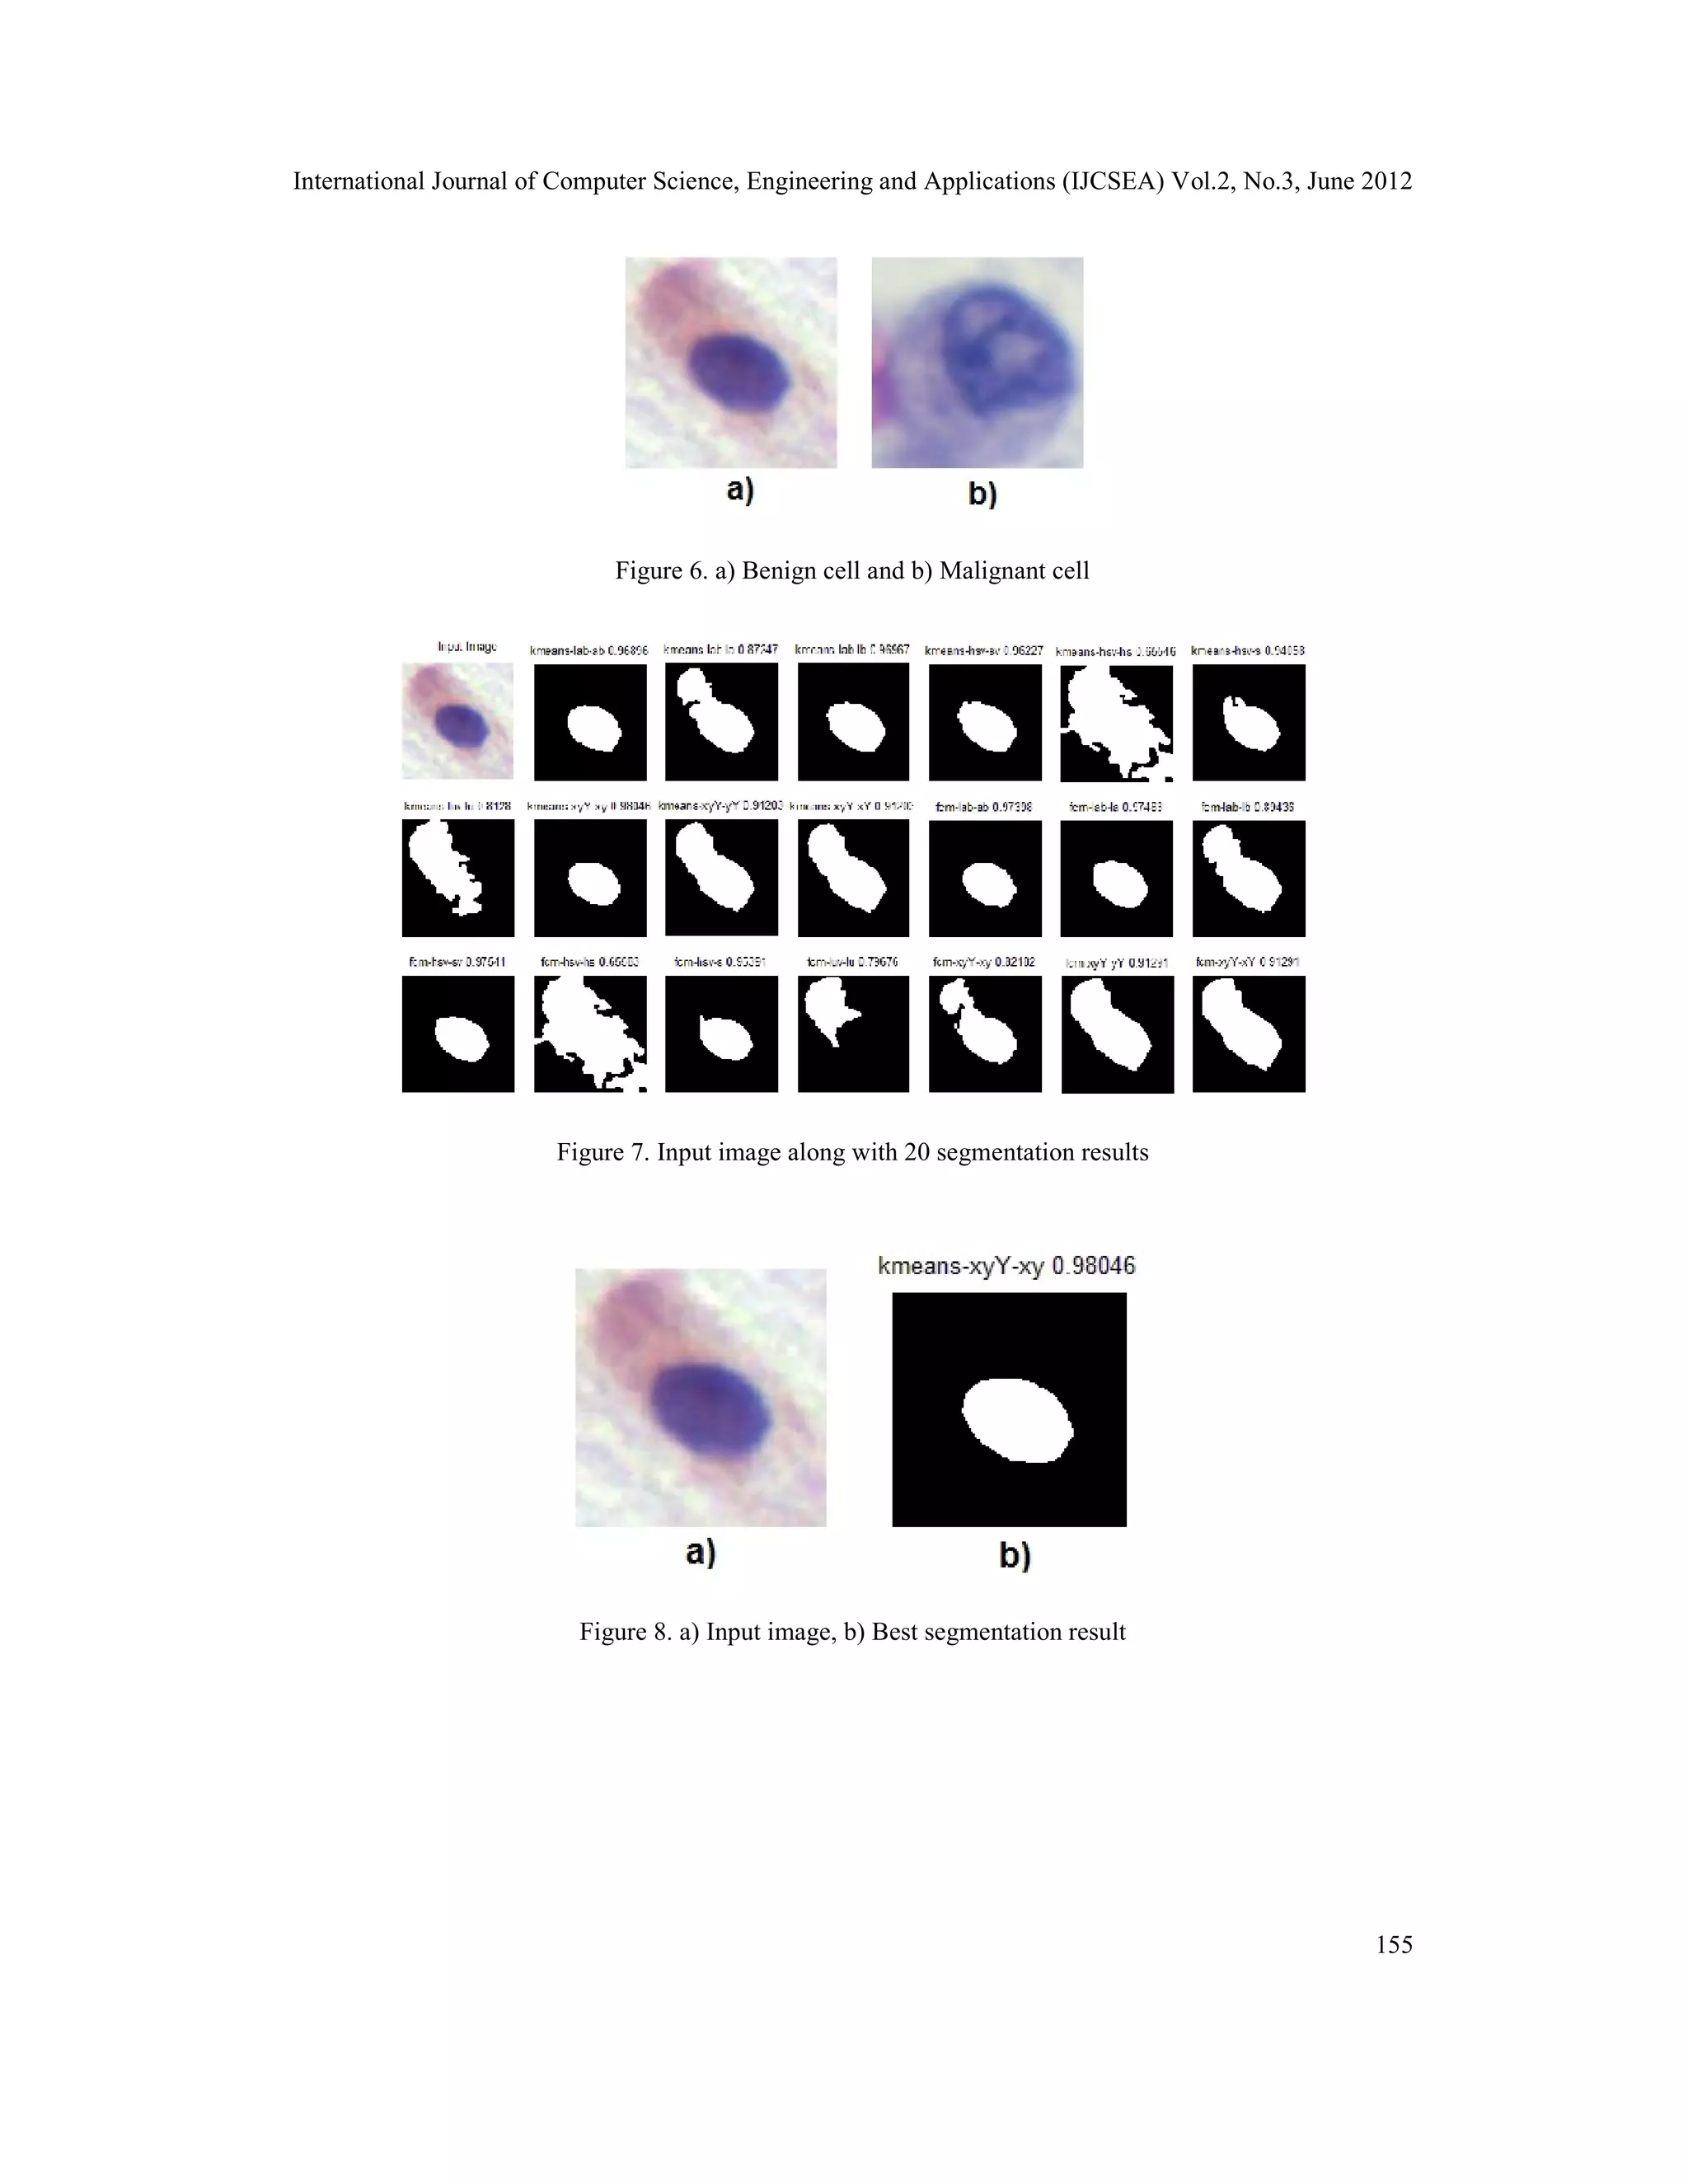
3.3. Segmentation
The identified nuclear regions are fed to the segmentation module. The staining of sputum
cytology images generally does not give uniform color distribution. So identifying nuclear region
based on one particular color may not give good segmentation result. The information content in
RGB color space is highly correlated and to uncorrelate it, various color spaces is used. Some
information may be discernable in one color space may not be quiet well distinguished in another
color space. A novel method of combining various color spaces is used in the segmentation
module. The technique is a generalization of the method used by Issac et al [31] where K-means
clustering is done on LAB color space. In this method the input image is converted to LAB, LUV,
HSV and xyY color spaces and various combination pair from each color space is taken and K-
means/FCM clustering is performed. The 20 combination consists of LAB layer L-A, LAB layer
A-B, LAB layer L-B, HSV layer H-S, HSV layer S-V, HSV layer H-V, xyY layer x-y, xyY layer
y-Y, xyY layer x-Y , LUV layer L-U and HSV layer S only. The different combination gives a
different result for the segmentation using K-means and FCM algorithm.
The K-means and FCM algorithms give different labels for nuclei region in different images. So
it is required to find the correct label for the nuclei region alone. The image cropping done in the
Figure 2. Steps of preprocessing stage](https://image.slidesharecdn.com/2312ijcsea14-180912104808/75/SEGMENTATION-OF-LUNG-GLANDULAR-CELLS-USING-MULTIPLE-COLOR-SPACES-6-2048.jpg)
![International Journal of Computer Science, Engineering and Applications (IJCSEA) Vol.2, No.3, June 2012
156
5. CONCLUSION
In this work, lung glandular cell nuclei detection and segmentation were done as the first step
towards classification of slides as benign or malignant. In our method we used multiple color
spaces and clustering algorithms such as K-means and Fuzzy C-means. The algorithm was tested
on 1038 cell images. As a part of our future work we plan to include other methods so that the
segmentation can be improved.
ACKNOWLEDGEMENTS
The authors would like to thank Dr. C Shunmuga Velayutham , Dept. of Computer Science and
Engineering, Amrita Viswa Vidyapeetham, Coimbatore, India for his valuable help and
guidance. We would also like to extend our thanks to Nimi G K of Pathology lab, Regional
Cancer Center, Thiruvananthapuram, India for helping us in gathering the dataset.
REFERENCES
[1] R. F. Walker, P. Jackway, B. Lovell, & I. D. Longstaff, (1994)“Classification of cervical cell nuclei
using morphological segmentation and textural feature extraction”, in Proceedings of the 1994 Second
Australian and New Zealand Conference on Intelligent Information Systems, pp 297-301.
[2] J. P. Thiran & B. Macq, (1996) “Morphological feature extraction for the classification of digital
images of cancerous tissues”, IEEE Transactions on Biomedical Engineering, Vol. 43, pp 1011-1020
[3] F. Schnorrenberg, C. S. Pattichis, K. C. Kyriacou, & C. N. Schizas, (1997) “Computer-aided detection
of breast cancer nuclei”, IEEE Transactions on Information Technology in Biomedicine, Vol. 1, pp
128-140.
[4] H. Wu, J. Gil, & J. Barba, (1998)“Optimal segmentation of cell images”, IEE Proceedings - Vision,
Image, and Signal Processing, Vol. 145, No. 1, pp 50-56.
[5] M. Sammouda, N. Niki, T. Niki, & N. Yamaguchi, (2000)“Analysis of color images of tissues derived
from patients with adenocarcinoma of the lung”, in IEEE Proceedings of 2000 International
Conference on Image Processing, Vol. 1, pp192-195.
[6] T. Tanaka, T. Joke, & T. Oka, (2001)“Cell nucleus segmentation of skin tumor using image
processing”, in Proceedings of the 23rd Annual International Conference of the IEEE Engineering in
Medicine and Biology Society,Vol. 3, pp 2716- 2719.
Figure 9. a) Input image and b) improper segmentation result](https://image.slidesharecdn.com/2312ijcsea14-180912104808/75/SEGMENTATION-OF-LUNG-GLANDULAR-CELLS-USING-MULTIPLE-COLOR-SPACES-10-2048.jpg)
![International Journal of Computer Science, Engineering and Applications (IJCSEA) Vol.2, No.3, June 2012
157
[7] C. Wittke, J. Mayer, & F. Schweiggert, (2007)“On the classification of prostate carcinoma with
methods from spatial statistics”, IEEE Transactions on Information Technology in Biomedicine, Vol.
11, pp 406-414.
[8] V. Meas-Yedid, S. Tilie, & J. C. Olivo-Marin, (2002)“Color image segmentation based on markov
random field clustering for histological image analysis”, in Proceedings 16th International Conference
on Pattern Recognition, Vol. 1, pp 796-799.
[9] G. Begelman, E. Gur, E. Rivlin, M. Rudzsky, & Z. Zalevsky, (2004)“Cell nuclei segmentation using
fuzzy logic engine”, in IEEE International Conference on Image Processing, Vol. 5, pp 2937- 2940.
[10] M. Hu, X. Ping, & Y. Ding, (2004)“Automated cell nucleus segmentation using improved snake”, in
International Conference on Image Processing, Vol. 4, pp 2737- 2740.
[11] P. Phukpattaranont & P. Boonyaphiphat, (2006)“Segmentation of cancer cells in microscopic images
using neural network and mathematical morphology”, in IEEE International Joint Conference SICE-
ICASE, pp 2312–2315.
[12] B. Ko, M. Seo, & J. Nam, (2007)“Microscopic image segmentation for the clinical support system”,
in IEEE Computer Graphics, Imaging and Visualisation, pp 489-494.
[13] G. Palacios & J. R. Beltran, (2007)“Cell nuclei segmentation combining multiresolution analysis,
clustering methods and colour spaces”, in IEEE International Conference on Machine Vision and
Image Processing, pp 91-97.
[14] F. Taher & R. Sammouda, (2011)“Lung cancer detection by using artificial neural network and fuzzy
clustering methods” in IEEE GCC conference and Exhibition, pp 295-298.
[15] M. E. Plissiti, C. Nikou, & A. Charchanti, (2011)“Automated detection of cell nuclei in pap smear
images using morphological reconstruction and clustering”, IEEE Transactions on Information
Technology in Biomedicine, Vol. 15, pp 233-241.
[16] W. Wang, J. A. Ozolek, D. Slepcev, A. B. Lee, C. Chen, & G. K. Rohde, (2011)“An optimal
transportation approach for nuclear Structure-Based pathology”, IEEE Transactions on Medical
Imaging, Vol. 30, pp621-631.
[17] Z. Huang & D. Liu, (2007)“Segmentation of color image using EM algorithm in HSV color space”, in
IEEE International Conference on Information Acquisition, pp 316–319.
[18] T. Chen, Y. Chen, & S. Chien, (2008)“Fast image segmentation based on KMeans clustering with
histograms in HSV color space”, in IEEE 10th Workshop on Multimedia Signal Processing, pp 322-
325.
[19] G. Zhao, S. Wang, T. Wang, & J. Chen, (2008)“HSV color space and face detection based
objectionable image detecting”, in Second International Conference on Future Generation
Communication and Networking Symposia, Vol. 3, pp 107-110.
[20] Y. Lu, W. Gao, & J. Liu, (2010)“Color matching for colored fiber blends based on the fuzzy c-mean
cluster in HSV color space”, in Seventh IEEE International Conference on Fuzzy Systems and
Knowledge Discovery, Vol. 1, pp 452-455.
[21] V. Anari, P. Mahzouni, & R. Amirfattahi, (2010)“Automatic extraction of positive cells in pathology
images of meningioma based on the maximal entropy principle and HSV color space”, in 6th Iranian
conference on Machine Vision and Image Processing, pp 1-4.
[22] M. H. Asmare, V. S. Asirvadam, & L. Iznita, (2009)“Color space selection for color image
enhancement applications”, in IEEE International Conference on Signal Acquisition and Processing,
pp 208-212.
[23] H. Rami, M. Hamri, & L. Masmoudi, (2009)“Hybrid color space and support vector machines for
classification”, in IEEE International Conference on Multimedia Computing and Systems, pp 484-
487.
[24] N. M. Kwok, Q. P. Ha, & G. Fang, (2009)“Effect of color space on color image segmentation”, in 2nd
IEEE International Congress on Image and Signal Processing, pp 1-5.
[25] Y. Pu, X. Wei, Y. Su, Z. Zhao, W. Qian, & D. Xu, (2010)“Implementation and research of multi-
method color transfer algorithms in different color spaces”, in IEEE 2010 International Conference on](https://image.slidesharecdn.com/2312ijcsea14-180912104808/75/SEGMENTATION-OF-LUNG-GLANDULAR-CELLS-USING-MULTIPLE-COLOR-SPACES-11-2048.jpg)
![International Journal of Computer Science, Engineering and Applications (IJCSEA) Vol.2, No.3, June 2012
158
Machine Vision and Human-Machine Interface , pp 713-717.
[26] Z. Yux, W. Yuhua, & L. Haibo, (2010)“A fuzzy c-means clustering based on hybrid color space”, in
IEEE International Conference on Electrical and Control Engineering, pp 4605-4607.
[27] D. Hang & L. Xi, (2010)“The color components’ computing on different color spaces for image
segmentation of hematocyte”, in IEEE International Symposium on Intelligence Information
Processing and Trusted Computing, pp 75–78.
[28] S. Chen & C. Liu, (2011)“Fast eye detection using different color spaces”, in IEEE International
Conference on Systems, Man, and Cybernetics, pp 521-526.
[29] L. Bradbury & J. W. Wan, (2010)“A spectral k-means approach to brightfield cell image
segmentation”, in Annual International Conference of the IEEE Engineering in Medicine and
Biology Society, pp 4748–4751.
[30] J. Macqueen, (1967)“Some methods of classification and analysis of multivariate observations”, in
Proceedings of the Fifth Berkeley Symposium on Mathematical Statistics and Probability, pp 281–
297.
[31] S. Issac Niwas, P. Palanisamy, R. Chibbar, & W. J. Zhang, (2011)“An expert support system for
breast cancer diagnosis using color wavelet features”, Journal of Medical Systems, pp 1-12.
[32] R. C. Gonzalez & R. E. Woods (2007) Digital Image Processing. Prentice Hall.
[33] A. Kuijper, (2004)“On detecting all saddle points in 2D images”, Pattern Recognition Letters, Vol.
25, pp 1665-1672.](https://image.slidesharecdn.com/2312ijcsea14-180912104808/75/SEGMENTATION-OF-LUNG-GLANDULAR-CELLS-USING-MULTIPLE-COLOR-SPACES-12-2048.jpg)

The paper presents a novel technique for the segmentation of lung glandular cells using multiple color spaces and unsupervised clustering algorithms like k-means and fuzzy c-means. This method is aimed at improving early detection of lung cancer by accurately differentiating malignant from benign cells in sputum cytology images. Experimental results indicated the effectiveness of the algorithm on a dataset of 1038 cell images, with plans for future enhancements to improve segmentation accuracy.