Download to read offline
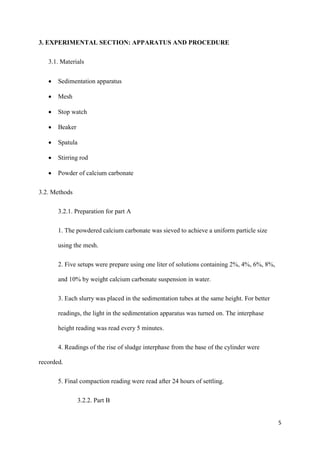
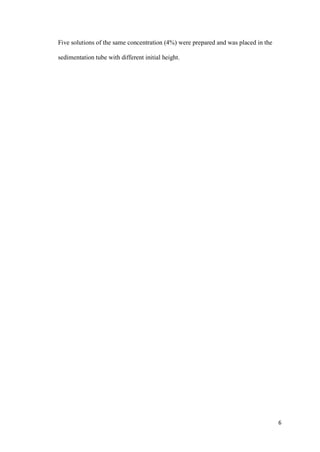
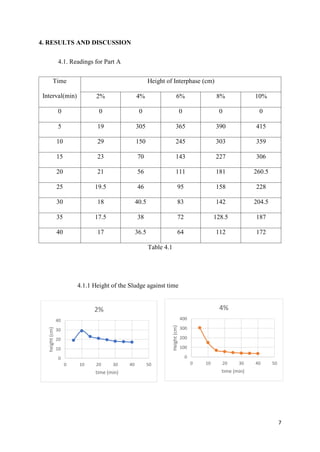
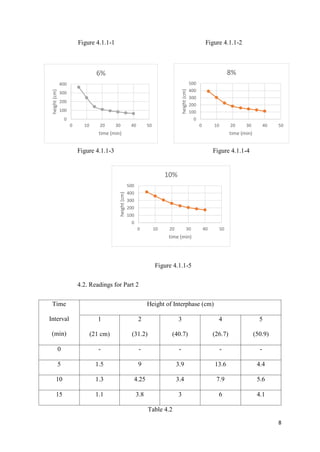
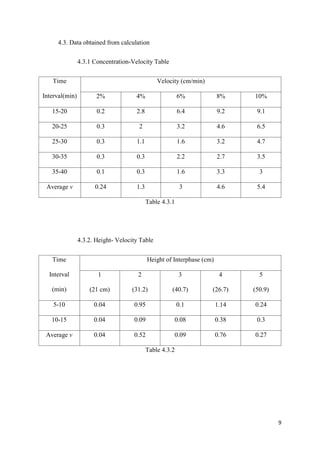
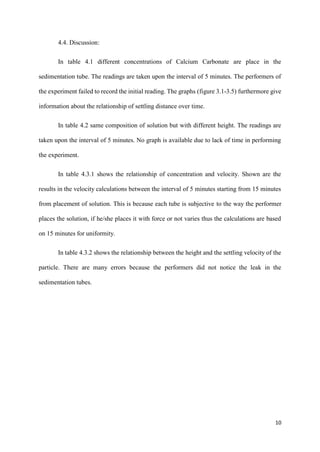


Sedimentation is the process where particles in suspension settle out of the fluid they are entrained in, due to forces like gravity, centrifugal force, and drag. It is widely used in industries like food, water treatment, and wastewater treatment. The document discusses the principles and mechanisms of sedimentation through equations of motion and graphical representations of particle settling. An experiment is described that examines the relationship between calcium carbonate concentration, initial suspension height, and settling velocity, though it has some errors. The results show higher concentrations and lower initial heights increase settling velocity. Recommendations to improve experimental control and reduce errors are provided.


