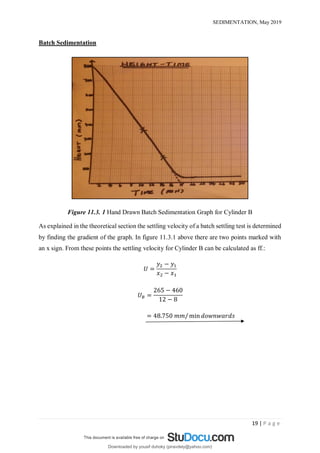
+971581248768>> SAFE AND ORIGINAL ABORTION PILLS FOR SALE IN DUBAI AND ABUDHA...
Β
sedimentation-report-s3-pdf.pdf
1. StuDocu is not sponsored or endorsed by any college or university
Sedimentation report s3 pdf
Chemical Engineering Lab Practicals III (Mangosuthu University of Technology)
StuDocu is not sponsored or endorsed by any college or university
Sedimentation report s3 pdf
Chemical Engineering Lab Practicals III (Mangosuthu University of Technology)
Downloaded by yousif duhoky (piravdely@yahoo.com)
lOMoARcPSD|4334469
2. SEDIMENTATION
PRACTICAL
GROUP B1
Shezi S 21706059
Khusi M 21733534
Mgobhozi S 21810139
Cele P 21732286
Mthiyane A.N 21814149
Downloaded by yousif duhoky (piravdely@yahoo.com)
lOMoARcPSD|4334469
5. List of Tables and Figures
Table 3.1. 1 Nomenclature Symbols and units................................................................................... 3
Table 3.2. 1 Nomenclature Suffixes Used.......................................................................................... 3
Table 6. 1 The Continuous Sedimentation Apparatus ........................................................................ 9
Table 11.1. 1 Raw Data Obtained for the Continuous Sedimentation Test........................................ 17
Table 11.1. 2 Raw Data Obtained for the Batch Sedimentation Test ................................................ 17
Table 11.2. 1 The Table of Technical Data...................................................................................... 17
Figure 6. 1 Batch Settling Test Apparatus ......................................................................................... 8
Figure 6. 2 Sedimentation Zones....................................................................................................... 8
Figure 6. 3 Continuous Sedimentation Apparatus.............................................................................. 9
Figure 7.2. 1 Batch Sedimentation Graph for Cylinder A ................................................................ 11
Figure 7.2. 2 Batch Sedimentation Graph for Cylinder B................................................................. 11
Figure 7.2. 3 Batch Sedimentation Graph for Cylinder C................................................................ 12
Figure 7.2. 4 The Removal Efficiency Against Volumetric Flowrate Graph..................................... 12
Figure 7.2. 5 The Sedimentation Rate Against Volumetric Flowrate Graph ..................................... 13
Figure 11.3. 1 Hand Drawn Batch Sedimentation Graph for Cylinder B .......................................... 19
Downloaded by yousif duhoky (piravdely@yahoo.com)
lOMoARcPSD|4334469
6. SEDIMENTATION, May 2019
1 | P a g e
1. Abstract
In industrial plants separation processes are often undertaken to obtain the desired products in
the preferred purity and form. Separation processes can be grouped based on their properties
into: Diffusional separators, Membrane separators and Mechanical separators.
This report is focussed around an experiment on batch and continuous sedimentation.
Sedimentation is the process by which particles settle to the bottom of a liquid and form a
sediment due to gravitational pull. The main objective of this study is the determination of the
efficiency of sedimentation of calcium carbonate suspensions at various flowrates.
For the batch sedimentation process three pre-prepared sedimentation cylinders, containing
unknown masses of calcium carbonate in water were examined. They were shaken thoroughly
and allowed to settle. The heights obtained are graphically represented against time and used
to obtain the settling velocities of the particles. For the continuous sedimentation the volumetric
flowrate was increased to determine the removal efficiency. The rate of sedimentation was also
calculated. The results obtained are graphically represented against the volumetric flowrate.
The size and type of particle to be removed has a major effect on the settling rate. The solid
particles in the Cylinder A were larger. During the experiment the particles of the Cylinder A
settled faster and therefore had the highest settling velocity. Sedimentation is achieved by
decreasing the velocity of the mixture to a point which the solid particles will no longer remain
in suspension. From the results obtained for continuous sedimentation it can be seen that the
removal efficiency is decreasing with the increasing flowrate (and therefore increase in solid
particlesβ velocity), which means that lesser solids are settling. This proves that for
sedimentation to occur properly when the velocity, which also goes to say the volumetric
flowrate, must be kept minimal.
Downloaded by yousif duhoky (piravdely@yahoo.com)
lOMoARcPSD|4334469
7. SEDIMENTATION, May 2019
2 | P a g e
2. Introduction
In most industrial chemical processes the desired product formed is usually in a mixture with
other components. These components can be excess reactants, by-products, catalysts and
components of solvents or reaction media. To obtain the products in the desired purity and
form separation must be undertaken. The most common separation processes include
evaporation, distillation, absorption, crystallization, filtration, centrifugation, drying and
membrane processes. Separation processes are mainly based on physical and physio-chemical
means (Chapter 3 Separation Processes 2009).
Differences in physical properties allow components in a mixture to undergo separation. Based
on these properties various separation processes can be grouped into: Diffusional separators,
Membrane separators and Mechanical separators. In diffusional separators separations are
based on molecular movement towards a favourable phase. Membrane separators make use of
semi-permeable membranes to separate molecules with different sizes or other properties. In
mechanical separators separations are based on size and/or density differences of the
components in the mixture, for separation of solid from liquid (e.g. filtration, centrifugation,
etc.) (Chapter 3 Separation Processes 2009).
In heterogeneous mixtures, two or more phases combine but remain physically separate. They
can include mixtures of two liquids or suspensions (liquid and solid). Liquid-gas mixtures also
exist. Separation of such mixtures is achieved by using mechanical-physical forces. These
forces act on the particles, liquids or mixtures of particles and liquids themselves and not
necessarily on the individual molecule. Mechanical-physical forces include gravitational and
centrifugal, actual mechanical and kinetic forces arising from flow (Lotta & Marja 2015).
This paper is focussed around an experiment on batch and continuous sedimentation.
Sedimentation can be described as the process of letting suspended material settle by the force
of gravity (Sedimentation). The main objective of this study is the determination of the
efficiency of sedimentation of calcium carbonate suspensions at various flowrates. Settling
velocities were determined from the batch settling tests. Removal efficiencies and rates of
sedimentation of the continuous test were also calculated. Further details about how the
experiment was carried out and all of these calculations undertaken are included in this report.
The data and results obtained have been captured and presented using tables and figures of the
Microsoft Office applications
Downloaded by yousif duhoky (piravdely@yahoo.com)
lOMoARcPSD|4334469
8. SEDIMENTATION, May 2019
3 | P a g e
3. Nomenclature
3.1 Symbols and Units
Table 3.1. 1 Nomenclature Symbols and units
Quantity Symbol Units
Mass of solids in the
feed stream
ππΉ G
Mass of solids in the
overflow
π0 G
Removal efficiency % πΈ %
Sedimentation rate πΜπ π3
/πππ
Settling velocity U mm/min
Time interval for
batch settling t Min
Time taken to fill the
sedimentation tank
T Min
Volume of
sedimentation tank
V m3
3.2 Suffixes Used
Table 3.2. 1 Nomenclature Suffixes Used
Number Quantity
1 Overflow at 5 L/min
2 Overflow at 10 L/min
3 Overflow at 15 L/min
4 Overflow at 20 L/min
Downloaded by yousif duhoky (piravdely@yahoo.com)
lOMoARcPSD|4334469
9. SEDIMENTATION, May 2019
4 | P a g e
4. Theory
4.1 Principles of Sedimentation
As already explained, sedimentation is the process by which particles settle to the bottom of a
liquid and form a sediment. Particles that experience a force, either due to gravity or due to
centrifugal motion will tend to move in a uniform manner in the direction exerted by that force.
For gravity settling, this means that the particles will tend to fall to the bottom of the vessel,
forming a slurry at the vessel base. For settling particles, there are two main forces enacting
upon any particle. The primary force is an applied force, such as gravity, and a drag force that
is due to the motion of the particle through the fluid. The force applied is usually not affected
by the particleβs velocity, whereas the drag force is the function of the particle velocity. As the
particles increase in the velocity, eventually the forces will approximately equate, causing no
further change in the particleβs velocity. This velocity is known as the settling velocity
(Backhurst, Harker & Richardson 2002).
For each of the batch settling tests the settling velocity can be determined from the slope of the
height-time graph.
π =
π¦2βπ¦1
π₯2βπ₯1
(4.1.1)
The rate of sedimentation can be calculated as follows:
πΜπ =
π
π‘
(4.1.2)
The removal efficiency can be defined as the ratio of the amount of solid material that
settles/sediments per amount of solids fed. This ratio can also be expressed as a percentage as
follows:
% πΈ =
ππππππ πππ‘π‘πππ
ππππππ ππ πΉπππ
Γ 100 (4.1.3)
The solids settled can be expressed as the difference between the mass of solids fed and the
mass of solids in the overflow. Therefore equation 4.1.3 becomes:
% πΈ =
ππΉβπ0
ππΉ
(4.1.4)
Downloaded by yousif duhoky (piravdely@yahoo.com)
lOMoARcPSD|4334469
10. SEDIMENTATION, May 2019
5 | P a g e
4.2 Particle Properties
A batch settling test can supply all information for the design of the thickener for separation of
particles from a fluid. The height of the suspension doesnβt generally affect either the rate of
sedimentation or the consistency of sediment ultimately obtained. The suspensions of fine
particles tend to behave rather differently from coarse particles (Backhurst, Harker &
Richardson 2002) .
The size and type of particle to be removed have a significant effect on the settling rate. Sand
or silt tend to be more easily removed because of their density. On the contrary colloidal
material (small particles that stay in suspension and make the liquid seem cloudy), will not
settle until the material is coagulated and flocculated by adding a chemical. The particles shape
also has an effect on the rate of settling. Rounded particles settle more readily than irregular
shaped particles. All particles possess slight electrical charges. Particles with the same charge
repel one another in in doing so hinder settling (Sedimentation).
4.3 Principles of Momentum and Sedimentation
An objectβs momentum is the product of its mass and velocity. An object can have a large
momentum by having a large mass or a large velocity. It can have a large momentum by having
either a small mass but a large velocity or a small velocity but a large mass. The same principles
of momentum apply for the particles is suspension (Impulse and Momentum).
Sedimentation is achieved by decreasing the velocity of the mixture to a point which the solid
particles will no longer remain in suspension. When the velocity no longer supports the
particles, gravity will remove them from the fluid (Sedimentation).
.
Downloaded by yousif duhoky (piravdely@yahoo.com)
lOMoARcPSD|4334469
11. SEDIMENTATION, May 2019
6 | P a g e
5. Experimental Method
5.1 Process Descriptions
Batch Sedimentation
1. Three pre-prepared sedimentation cylinders, containing unknown masses and sample types
of calcium carbonate in water, were dislodged from the sedimentation apparatus and shaken
thoroughly. This was done until the mixture became homogenous.
2. The moment when they were put back onto the apparatus the timer was started and the
heights of the three suspensions were recorded.
3. After two minute intervals the heights of the suspension interfaces, the separation between
the zone of clear liquid and the zone of constant composition, were recorded each time.
4. After no further settling took place the tests were complete.
Continuous Sedimentation
1. The slurry of calcium carbonate suspension and water was prepared, it was stirred until it
became a homogenous mixture. The pump was also opened to ensure the thorough mixing
of the slurry. Once the slurry was thoroughly mixed, a sample of 250 ml was taken directly
out of the storage tank.
2. In the settling tank, a stopper was inserted to ensure that no fluid is passing out. The valve
was opened and the rotameter was adjusted to 5 litres/min and the stopwatch was started to
determine how much time is taken to fill the settling tank at that flowrate. Once the settling
tank was full, the stopwatch was stopped and the time was recorded. The sample of 250 ml
was taken when the settling tank overflows.
3. The valve was turned off and also the rotameter. The stopper was taken out to empty the
settling tank via the output tap.
4. The same procedure was repeated for the rotameter readings of 10, 15 and 20 L/min.
5. The filter papers and petri dishes were weighed and marked. The samples were filtered
using vacuum filter.
6. The filtered samples were placed in the oven for approximately 24 hours to ensure the
thorough evaporation
7. Finally the samples out of the oven were weighed and discarded.
Downloaded by yousif duhoky (piravdely@yahoo.com)
lOMoARcPSD|4334469
12. SEDIMENTATION, May 2019
7 | P a g e
5.2 Experimental Deviations
When the batch settling test was commenced already half of it had been pre-done. Supposedly,
50 g of calcium carbonate samples had been already weighed into the three sedimentation
cylinders. Had this been done during the actual experiment much more information couldβve
been drawn. Judging by the different settling patterns of the suspensions in the three cylinder
it can be seen that the solids weighed out are different. However since these solids were already
in water for quite some time it was difficult to see the physical differences.
The continuous sedimentation experimental procedure written on the laboratory manual is
exceptionally different compared to the one actually undertaken. One point that stands out is
that many samples were taken. These samples were not only different in quantity but also the
method with which they were taken. Apparatuses like Pipettes, which ensure more accuracy,
were used. Another point to notice is that the rotameter readings in manual were reduced but
as seen in the experimental procedure of this report this is the exact opposite.
5.3 Experimental Limitations and Constraints
As explained in the experimental procedure 2 minute intervals were measured for batch
sedimentation and time was also measured for the period taken to fill the sedimentation tank
for the continuous sedimentation. This was not done by the use of standard stopwatches, but
rather with cell phones. Cell phones have a relatively lower accuracy compared to standard
stopwatches.
Another major limitation was that the cylinders used for the batch sedimentation tests were not
properly cleaned. This problem was mostly experienced with Cylinder C. When this suspension
was shaken at the beginning of the experiment some mass of the sludge was stuck at the bottom
of the cylinder. All attempts to move it upwards were a failure. Taking height readings was
difficult. Compared to the other two cylinders this cylinder was the blurriest. The solid particles
had suck on the surface of the cylinder refusing to settle. It cannot be said that the results
obtained for it are accurate.
Downloaded by yousif duhoky (piravdely@yahoo.com)
lOMoARcPSD|4334469
13. SEDIMENTATION, May 2019
8 | P a g e
6. Experimental Devices
Figure 6. 1 Batch Settling Test Apparatus
Source: https://www.perrytecheducational.com/product/sedimentation-studies-apparatus/
Figure 6. 2 Sedimentation Zones
Source:
https://www.google.co.za/search?q=batch+sedimentation+zones+labeled+pdf&sa=X&tbm=isch&im
gil=9jlmdzonLFiHMM%253A%253Br-7UBfEd4TFqxM%253Bhttp%25253A%25252F%25252Fengrsl.
blogspot.com%25252F2012%25252F04%25252Fsedimentation.html&source=iu&pf=m&fir=9jlmdzon
LFiHMM%253A%252Cr-7UBfEd4TFqxM%252C_&usg=__qFVfGYoYxLPT2WPO23el9Y3lBi4%3D&biw
=1366&bih=613&ved=0ahUKEwi_qa7LjZDWAhXJBcAKHdYMBf8QyjcIMQ&ei=_qyvWb-
yE8mLgAbWmZT4Dw#imgrc=9jlmdzonLFiHMM:
Downloaded by yousif duhoky (piravdely@yahoo.com)
lOMoARcPSD|4334469
14. SEDIMENTATION, May 2019
9 | P a g e
Figure 6. 3 Continuous Sedimentation Apparatus
Table 6. 1 The Continuous Sedimentation Apparatus
Number Description
1 Flow Meter
2 Feed Stream
3 Pump
4 Recycle Stream
5 Storage Tank
6 Drain
7 Settling Tank
8 Overflow
1
4 6
7
5
2
3
8
Downloaded by yousif duhoky (piravdely@yahoo.com)
lOMoARcPSD|4334469
15. SEDIMENTATION, May 2019
10 | P a g e
7. Results
7.1 Tabulation of Results
Table 7.1. 1 Settling Velocities for the Batch Sedimentation Test
Cylinder Settling velocity (mm/min)
A -77.143
B -48.750
C -53.333
The table 7.1.1 above shows settling velocities obtained for the batch sedimentation tests.
These values were obtained using equation 4.1.1. All the velocities above are negative to show
the direction of the solid particle, which is downwards. A sample of how these values were
obtained can be found in the appendices of this report.
Table 7.1. 2 Results Obtained for the Continuous Sedimentation Test
Volumetric
Flowrate (l/min)
Removal efficiency
(%)
Rate of
sedimentation
(m3
/min)
5 73.78 0.0613
10 64.81 0.0755
15 56.19 0.1084
20 47.94 0.1377
The table 7.1.2 above shows results obtained for the continuous sedimentation test. The values
for the removal efficiency were determined using equation 4.1.4. The rate of sedimentation
values were obtained using equation 4.1.2. The sample demonstrating how these values can be
found in the appendices of this paper.
Downloaded by yousif duhoky (piravdely@yahoo.com)
lOMoARcPSD|4334469
16. SEDIMENTATION, May 2019
11 | P a g e
7.2 Graphical Representation of Results
Figure 7.2. 1 Batch Sedimentation Graph for Cylinder A
The figure above figure is a graphical representation of table 11.1.2 of raw data. Compared to
the other cylinders, cylinder Cβs suspension starts at a higher height. Since the first segment of
the graph is not perfectly straight is can be said there were errors during the experiment.
Figure 7.2. 2 Batch Sedimentation Graph for Cylinder B
The figure 7.2.2 above was also obtained from table 11.1.2 of raw data. It would seem that
these results are more accurate, compared those of Cylinder A and C, since the curve is
smoother.
0
200
400
600
800
1000
0 5 10 15 20 25
Height
(mm)
Time (min)
Height-Time
0
100
200
300
400
500
600
700
800
900
0 5 10 15 20 25 30
Height
(mm)
Time (min)
Height-Time
Downloaded by yousif duhoky (piravdely@yahoo.com)
lOMoARcPSD|4334469
17. SEDIMENTATION, May 2019
12 | P a g e
Figure 7.2. 3 Batch Sedimentation Graph for Cylinder C
It has already been explained that the results obtained for this Cylinder are likely the most
compromised. However it would seem that figure 7.2.3 is more similar to figure 7.2.2 than
figure 7.2.1.
Figure 7.2. 4 The Removal Efficiency against Volumetric Flowrate Graph
The Figure 7.2.4 shows the relationship between the removal efficiency and the volumetric
flowrate. As can be seen this relationship is linear. As the volumetric flowrate increases the
removal efficiency decreases.
0
100
200
300
400
500
600
700
800
900
0 5 10 15 20 25
Height
(mm)
Time (min)
Height-Time
0
10
20
30
40
50
60
70
80
0 5 10 15 20 25
Removal
Efficiency
(%)
VolumetricFlowrate (l/min)
Removal Efficiency-Volumetric Flowrate
Downloaded by yousif duhoky (piravdely@yahoo.com)
lOMoARcPSD|4334469
18. SEDIMENTATION, May 2019
13 | P a g e
Figure 7.2. 5 The Sedimentation Rate against Volumetric Flowrate Graph
The figure 7.2.5 above shows a relationship between the rate of sedimentation and the
volumetric flowrate. Again it can be seen that this relationship is linear. The rate of
sedimentation increases with the increase of volumetric flowrate.
0
0,02
0,04
0,06
0,08
0,1
0,12
0,14
0,16
0 5 10 15 20 25
Rate
of
Sedimentation
(m
3
/min)
VolumetricFlowrate (L/min)
Rate of Sedimentation-Volumetric Flowrate
Downloaded by yousif duhoky (piravdely@yahoo.com)
lOMoARcPSD|4334469
19. SEDIMENTATION, May 2019
14 | P a g e
8. Discussions
As explained in the experimental method section of this report, complications were experienced
during the conduction of the batch settling/sedimentation tests. The clearest information that
can be gathered from this experiment is that solid particles of Cylinder A settle much faster
than those of Cylinder B and C. It was also explained that the opportunity to evaluate the
properties of the calcium carbonate sample particles never presented itself. Nevertheless during
the experiment is could be easily seen that the solid particles in the Cylinder A were larger.
The grains of it were somewhat more visible than those of Cylinder B and C. According to the
theoretical analysis included in this report, larger particles tend to settle more easily. It can be
said that the results obtained correspond with the theory thus far.
Complications arise when trying to compare the results obtained for Cylinder B and C. Looking
at the table 11.1.2 of raw data it can be seen that these cylinders start off with nearly similar
values of height. Also looking at table 7.1.1 the settling velocities of the two cylinders in
question have an approximately six point difference between them. This is not much of a
difference. Upon this assessment it could be said that the solid particles in these two cylinders
have the same size. Had the integrity of the Cylinder C results not been compromised this
similarity couldβve been easily verified or falsified. Either way it could be easily seen that these
particles possess more of a colloidal nature, since both the suspensions were cloudier compared
to Cylinder A with particles visibly sticking to the walls of the cylinders. Again, it couldnβt be
said which was more cloudy because Cylinder C had not been properly cleaned before the
experiment.
The continuous sedimentation test presented lesser problems. Table 7.1.2 and figure 7.2.4 show
the removal efficiency decreasing with the increase of the volumetric flowrate. The removal
efficiency has been described as the ratio of the amount of solid material that settles per amount
of solids fed. If the removal efficiency is decreasing, it inevitably means that lesser solids are
settling. The reason behind this reduction can be attributed to momentum. As the volumetric
flowrate increases, the velocity of the solid particles increase thus increasing their momentum.
As the volumetric flowrate increases more solid particles gain momentum to go over to the
overflow and therefore decreasing the efficiency of sedimentation.
Downloaded by yousif duhoky (piravdely@yahoo.com)
lOMoARcPSD|4334469
20. SEDIMENTATION, May 2019
15 | P a g e
9. Conclusion
According to theoretical research particle size plays an important role in sedimentation. Larger
particles settle faster. This important fact has been witnessed with the settling velocity of the
particles of Cylinder A being greater than that of particles of Cylinder B and C.
Again according to the theory included in this report: Sedimentation is achieved by decreasing
the velocity of the mixture to a point which the solid particles will no longer remain in
suspension. When the velocity no longer supports the particles, gravity will remove them from
the fluid. For this experiment the opposite had been done during the continuous settling test.
The velocity was increased in order to determine what would happen to the efficiency of
sedimentation. Since the efficiency decreased the results obtained correspond with the theory.
Indeed sedimentation to occur properly when the velocity, which also goes to say the
volumetric flowrate, is be kept minimal.
To conclude, because the results obtained correspond with the theoretical analysis is can be
said that the experiment was conducted properly and that the sedimentation apparatuses operate
efficiently to some extent.
Downloaded by yousif duhoky (piravdely@yahoo.com)
lOMoARcPSD|4334469
21. SEDIMENTATION, May 2019
16 | P a g e
10. References
1. Sedimentation, Available from :
<https://www.mrwa.com/WaterWorksMnl/Chapter%2013%20Sedmentation.pdf>.
[29 August 2017].
2. Momentum and Impulse, Available from: <https://www.pearson.com/content/dam/one-
dot-com/one-dot-com/us/en/higher-ed/en/products-services/course-products/knight-
physics-4e-info/pdf/chapter11.pdf>. [29 August 2017].
3. Chapter 3 Separation Processes, Available from:
<http://www.polyu.edu.hk/edc/tdg/userfiles/file/490Q_ABCT/ICBPT_cht3Sep.pdf>[30
August 2017].
4. Lotta S., Marja N. 2015, Design and selection of separation processes, Available from:<
http://www.vtt.fi/inf/julkaisut/muut/2015/VTT-R-06143-15.pdf>. [30 August 2017].
5. Backhurst J. R., Harker J.H. & Richardson J. F 2002, Particle Technology and Separation
Processes, Butterworth-Heinemann, Oxford ,Amsterdam, Boston , London, New York,
Paris.
Downloaded by yousif duhoky (piravdely@yahoo.com)
lOMoARcPSD|4334469
22. SEDIMENTATION, May 2019
17 | P a g e
11. Appendices
11.1 Raw Data
Table 11.1. 1 Raw Data Obtained for the Continuous Sedimentation Test
Volumetric
Flowrate
(l/min)
Time (min)
Mass of petri
dish, filter
paper and
solids (g)
Mass of petri
dish and filter
paper (g)
Mass of solids
(g)
ππππ - 37.2969 33.6577 3.6392
5 9.30 34.7078 33.7536 0.9542
10 7.55 65.3351 64.0544 1.2807
15 5.26 40.1228 38.5285 1.5943
20 4.14 35.8917 33.9969 1.8948
Table 11.1. 2 Raw Data Obtained for the Batch Sedimentation Test
Time (min)
Cylinder A heights
(mm)
Cylinder B heights
(mm)
Cylinder C heights
(mm)
0 885 793 794
2 750 720 710
4 510 630 640
6 350 550 530
8 200 460 350
10 56 360 210
12 38 265 60
14 38 170 38
16 38 90 38
18 38 38 38
20 38 38 38
11.2 Technical Data
Table 11.2. 1 The Table of Technical Data
Quantity Amount
Volume of tank 0.6 x 0.5 x1.9 m
Pump Capacity 6 l/mm
Downloaded by yousif duhoky (piravdely@yahoo.com)
lOMoARcPSD|4334469
23. SEDIMENTATION, May 2019
18 | P a g e
11.3 Sample Calculations
Continuous Sedimentation
Mass of the Feed Stream
ππΉ = 37.2969 β 33.6577
= 3.6392 π
Overflow at Volumetric Flowrate of 5 L/min
π01 = 34.7078 β 33.7536
= 0.9542 π
% πΈ1 =
ππΉ β π01
ππΉ
Γ 100
=
3.6392 β 0.9542
3.6392
Γ 100
= 73.78 %
πΜπ 1 =
0.6 Γ 0.5 Γ 1.9
9.3
= 0.0613 π3
/πππ
Efficiency and sedimentation rate calculations were performed in the similar fashion for all the
other volumetric flowrates.
Downloaded by yousif duhoky (piravdely@yahoo.com)
lOMoARcPSD|4334469
24. SEDIMENTATION, May 2019
19 | P a g e
Batch Sedimentation
Figure 11.3. 1 Hand Drawn Batch Sedimentation Graph for Cylinder B
As explained in the theoretical section the settling velocity of a batch settling test is determined
by finding the gradient of the graph. In figure 11.3.1 above there are two points marked with
an x sign. From these points the settling velocity for Cylinder B can be calculated as ff.:
π =
π¦2 β π¦1
π₯2 β π₯1
ππ΅ =
265 β 460
12 β 8
= 48.750 ππ/min πππ€ππ€ππππ
Downloaded by yousif duhoky (piravdely@yahoo.com)
lOMoARcPSD|4334469