Download to read offline

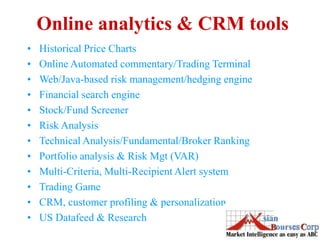
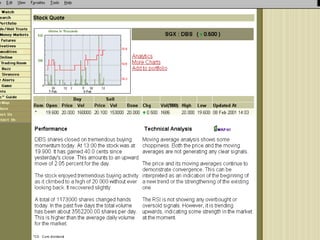
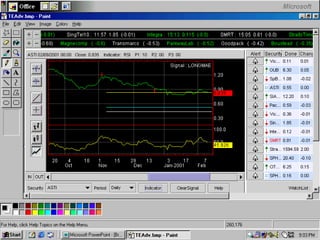
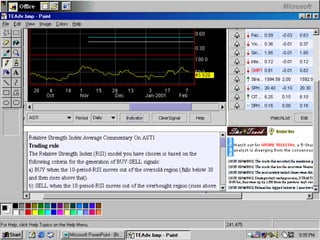
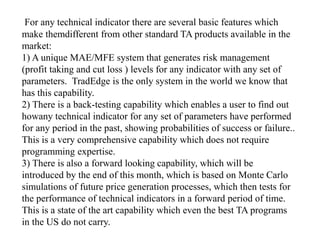
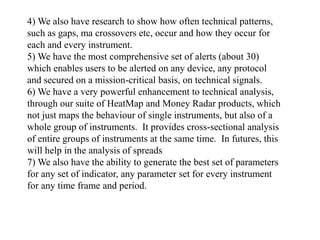
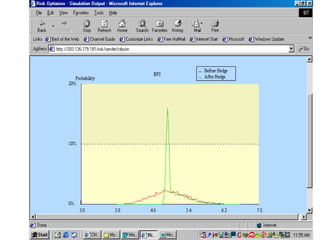
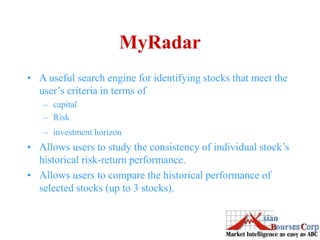
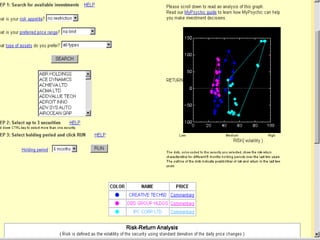
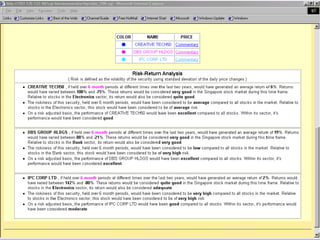
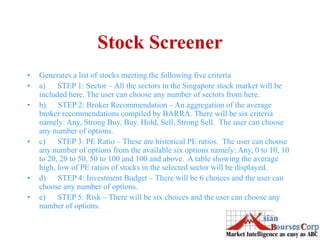
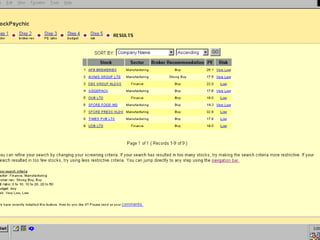
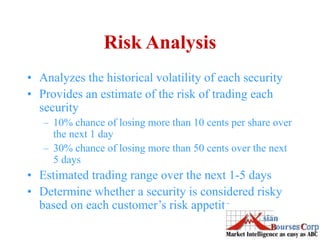
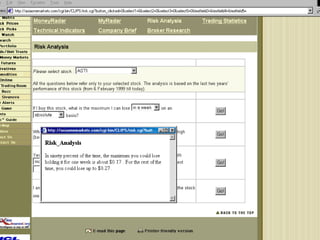
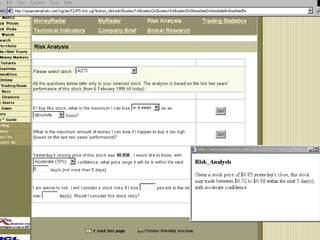
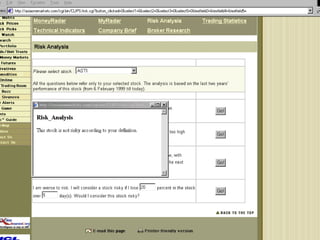
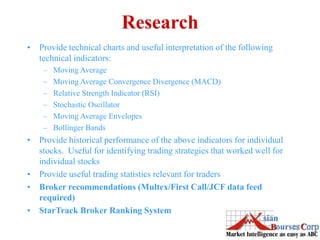
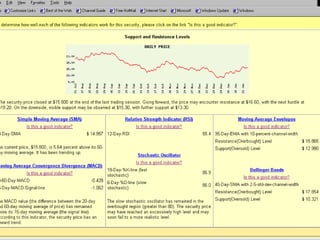
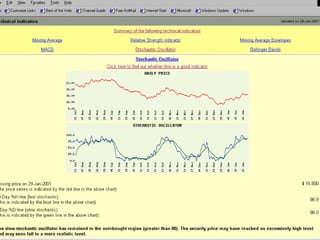
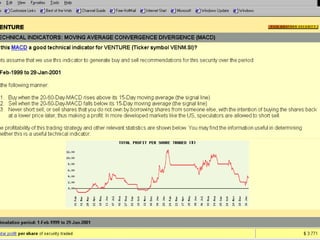

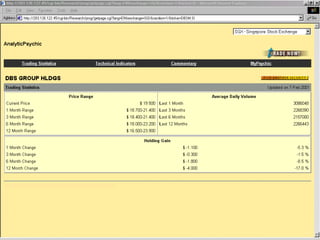
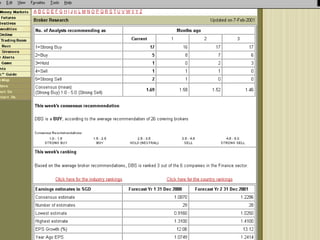
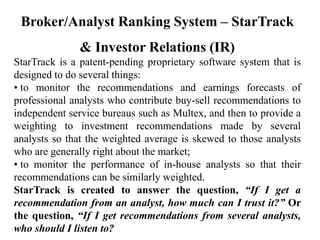
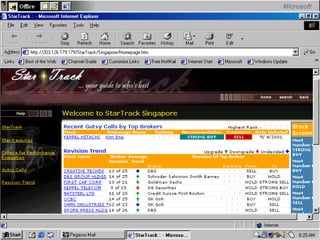
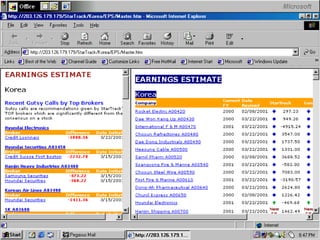
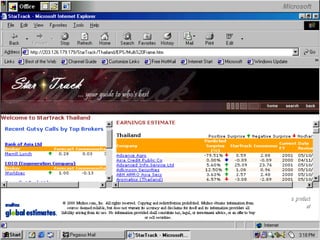
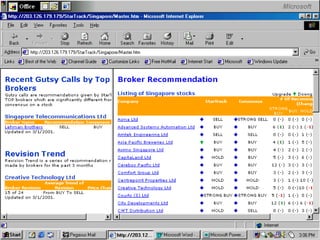
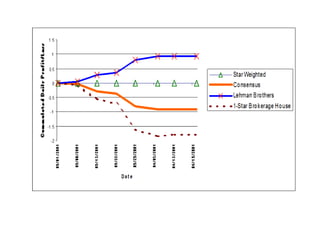
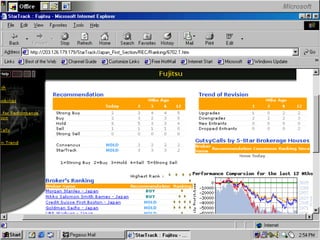
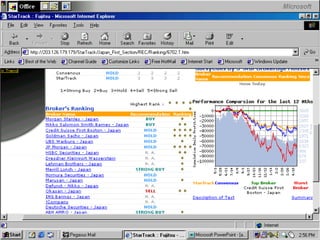
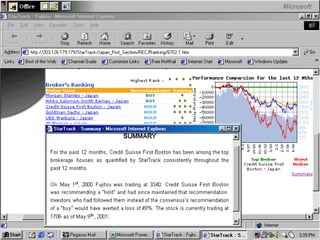
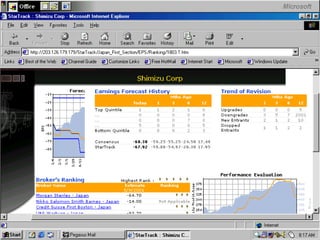
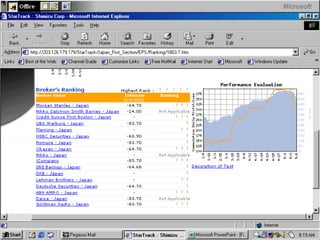
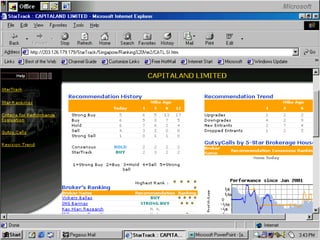
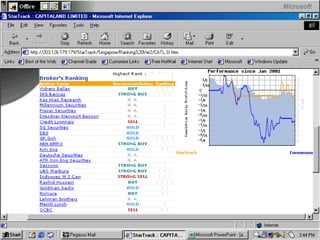
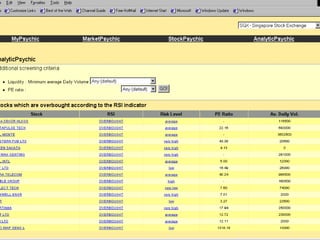
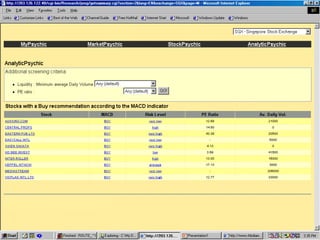
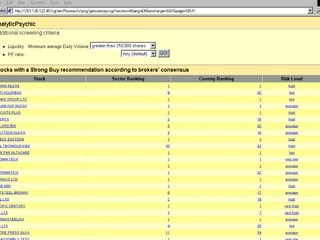
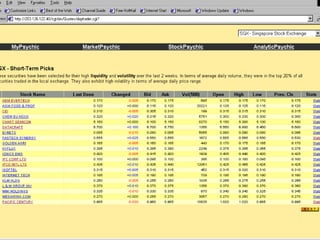
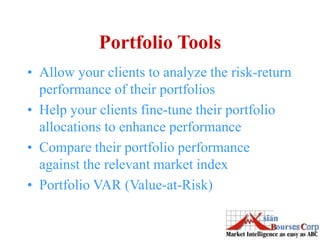
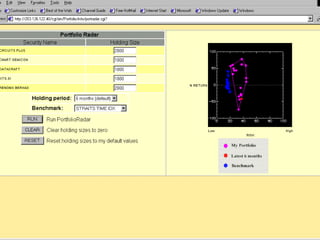
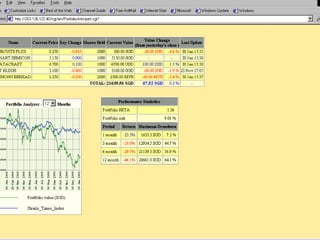
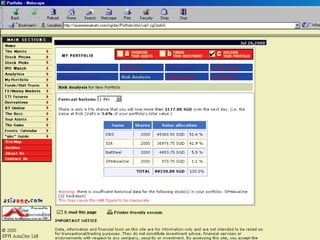
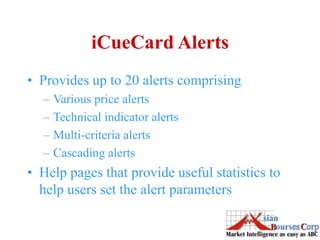
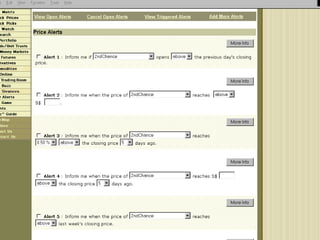
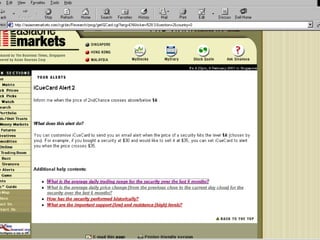
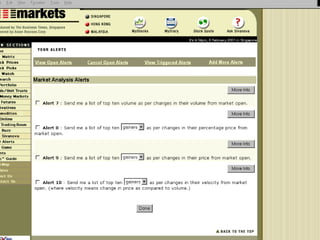
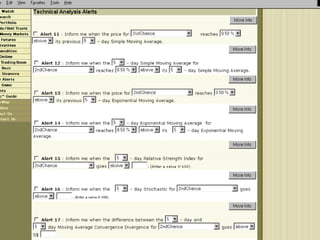
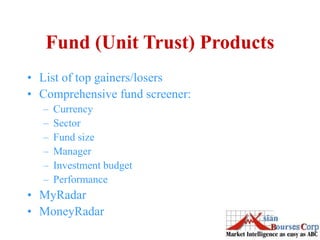
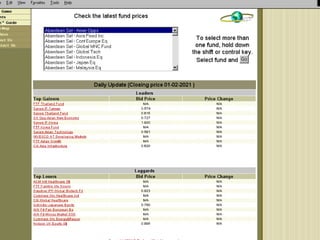
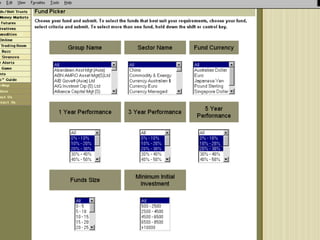
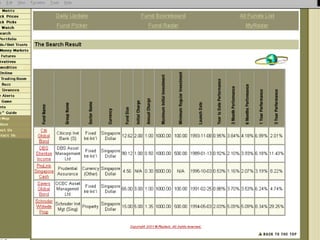
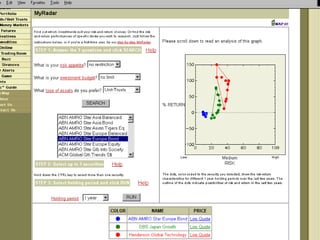
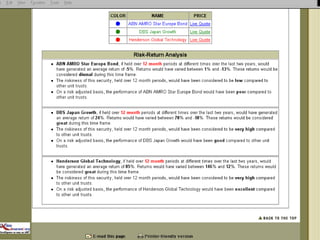
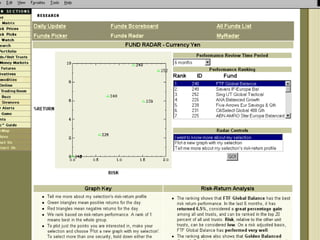
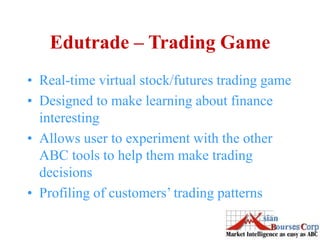
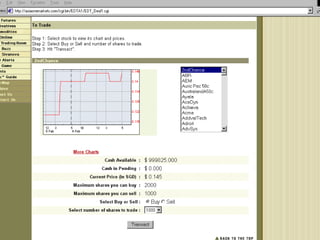
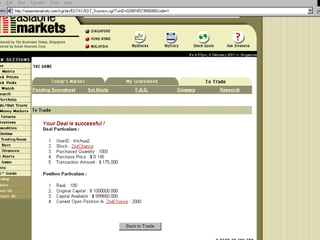
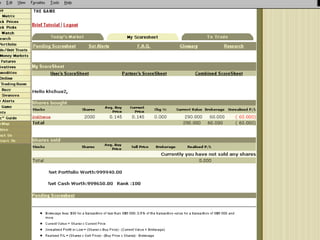
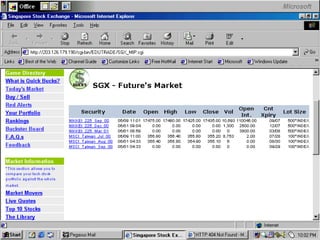
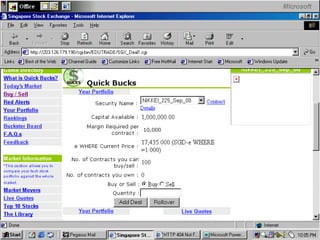
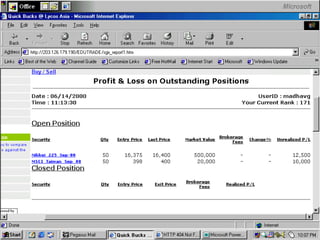
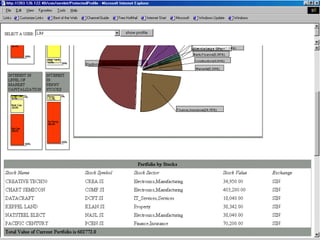
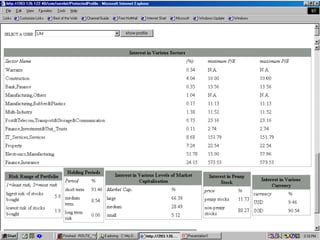
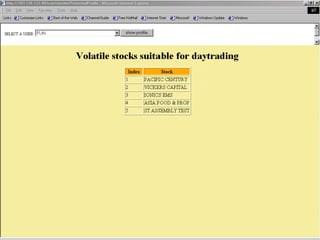

The document outlines a comprehensive suite of online analytics and CRM tools developed by GS Khoo, PhD, for clients involved in trading. Key features include unique risk management systems, back-testing capabilities, automated commentary, and extensive alert systems, aimed at enhancing trading decisions and risk analysis. The tools provide integrated technical and fundamental analysis, historical performance data, and educational resources for users seeking to improve their trading strategies.


![7.__Developing_a_Research_Proposal[1].pptx](https://cdn.slidesharecdn.com/ss_thumbnails/7-260131073037-df92dd7d-thumbnail.jpg?width=640&height=640&fit=bounds)


![제 23회 보아즈(BOAZ) 빅데이터 컨퍼런스 - [MBOAX] : ABSA를 활용한 소비자 반응 분석 기반 운영 효율화 대시보드 설계](https://cdn.slidesharecdn.com/ss_thumbnails/3-1boaz23rdconferencemboax-260203102709-9d519923-thumbnail.jpg?width=640&height=640&fit=bounds)
