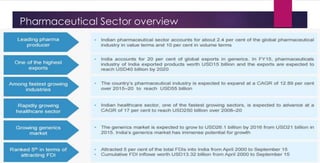
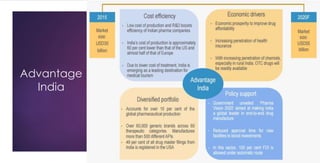
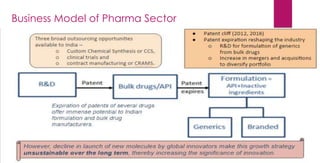
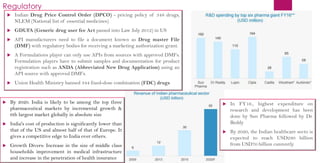
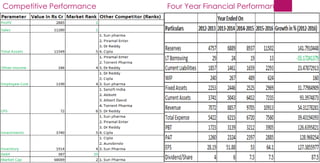
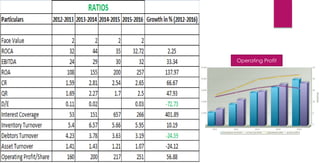
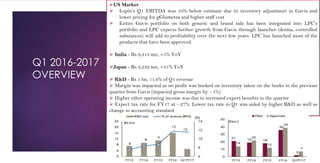
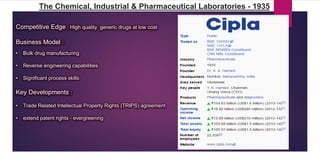
Pharmaceuticals
Industry Analysis
Pharmaceutical Sector overview
Advantage
India
Business Model of Pharma Sector
Regulatory
 Indian Drug Price Control Order (DPCO) - pricing policy of 348 drugs,
NLEM (National list of essential medicines)
 GDUFA (Generic drug user fee Act passed into Law July 2012) in US
 API manufacturers need to file a document known as Drug master File
(DMF) with regulatory bodies for receiving a marketing authorization grant.
 A Formulations player can only use APIs from sources with approved DMFs.
Formulation players have to submit samples and documentation for product
registration such as ANDA (Abbreviated New Drug Application) using an
API source with approved DMFs.
 Union Health Ministry banned 344 fixed-dose combination (FDC) drugs
 In FY16., highest expenditure on
research and development has been
done by Sun Pharma followed by Dr.
Reddy
 By 2020, the Indian healthcare secto is
expected to reach USD280 billion
from USD70 billion cunrently
 By 2020. India is likely to be among the top three
pharmaceutical markets by incremental growth &
6th largest market globally in absolute size
 India's cost of production is significantly lower than
that of the US and almost half of that of Europe. It
gives a competitive edge to India over others.
 Growth Divers: Increase in the size of middle class
households improvement in medical infrastructure
and increase in the penetration of health insurance
SUN PHARMA : Company Snapshot
 The Company’s global presence is supported by 49 manufacturing
facilities, spanning six continents,
 Post the merger with Ranbaxy, SPIL is the largest pharmaceutical company
in the domestic formulations market with a market share of 8.7% as of June
2016.
 Using acquisitions and partnering to bridge critical capability gaps
 Increasing contribution of specialty and complex products
 Key focus areas include dermatology, ophthalmic, oncology, controlled
substances, among others
 Sun Pharma remains one of our top picks due to its niche generic pipeline,
enhanced focus on specialty business, strong FCF generation and superior
execution track record
 The company's formulations are mainly sold in the United States and India,
which together contributed close to 74% of its revenues in 2015-16.
SUN PHARMA : Global Presence
92
1
1 1
API manufacturing sites
India
Australia
Israel
US
Sun Pharma also has four research centres - 3 in India
and 1 in Israel with over 900 scientists.
SUN PHARMA : Key Acquisitions
 Acquired Caraco in1998 to enter US markets
 2010 - Acquired Taro Pharmaceutical Industries
Ltd. - Israel - Enables entry into dermatology
segment. Enhances presence in US generic
market
 2013 - Acquired Dusa Pharma in US - Enabling
access to patented drug-device combination
useful for treating Actinic Keratosis, a
dermatology ailment
 2015 - Sun Pharma – Ranbaxy Merger – to further
strengthen Sun Pharma’s positioning as the 5th
largest Global Specialty Generic Pharma
Company and No. 1 Pharma Company in India
with strong positioning in emerging markets
 Entered into a joint venture with Intrexon
Corporation for developing gene-based
therapies for ocular diseases
 2016 - Acquired InSite Vision - Focuses on
developing new specialty ophthalmic products,
has three late stage programs
 Acquired 14 brands from Novartis for entering
Japanese markets in 2016 for a consideration of
US$ 293 million.
 In-licensed Tildrakizumab for treating chronic
plaque psoriasis. The preparations for submission
of a Biologics License Application for this product
to the US FDA are proceeding
SUN PHARMA : Recent Activities
 In 4Q, it is likely to register 26%YoY growth in revenues on the back of gGleevec sales under 180
days exclusivity.
 Keveyis sales halted voluntarily: Given the high costs and resources required to identify and
reach a limited number of viable patients, Taro has realized that it will be unable to sustain its
current level of investment in Keveyis.
 The US market (48%of overall revenue) witnessed a de-growth of ~1.5% due to regulatory issues
in Halol plant, customer consolidation and pricing constraints.
 In September 2015, Sun Pharma entered into an agreement to transfer two marketing divisions
of its India business, operating in the central nervous system (CNS), to Strides Arcolab Ltd. for a
consideration of ` 1,650 million.
SUN PHARMA : Financials
• Its emerging market (~20% of overall
revenue) performance has been adversely
impacted due to currency fluctuations and supply
constraints.
• In the domestic market (26% of overall
revenue), the company recorded a growth of
~9% due to strong presence in the chronic
segment.
• In 2015-16, SPIL's revenue grew by a marginal
~3% y-o-y, mainly on account of slowdown in the
US and emerging markets
• Operating margin improved by 40 bps in 2015-
16, because of a marginal reduction in
expenditure incurred for stocks.
• Net margin improved by 70 bps partly in line
with operating margin and due to a fall in tax,
depreciation and interest charges.
Lupin : Company
Analysis
Our Insight and
View ……
COMPANY SNAPSHOT
 Lupin, the second largest Indian pharma company in terms of market
capitalisation,
 Targets the generics opportunity in regulated markets.
 Currently, the chronic-therapy business contributes 66% of total
revenue in the domestic market, which makes Lupin a strong player in
the specialties segment.
 Lupin has emerged as a fully-integrated company, with manufacturing
capabilities in APIs and formulations and a direct marketing presence in
its target markets, including the US, Europe and Japan.
 In the US market, apart from being one of the fastest-growing
companies in the generic space, Lupin is also one of the few Indian
companies to have a strong presence in the branded generics segment as
well.
Acquisition
 The entire shareholding in Gavis Pharmaceuticals, LLC,
USA, Novel Laboratories, Inc., USA, VGS Holdings, Inc.,
USA, Edison Therapeutics, LLC, USA and Novel Clinical
Research (India) Private Limited, India (collectively referred
as Gavis), was acquired through Lupin Inc., USA, wholly-
owned subsidiary of the Company
 The entire shareholding in Medquimica Industria
Farmaceutica LTDA, Brazil (formerly known as Medquimica
Industria Farmaceutica S.A., Brazil) (Medquimica) was
acquired through Lupin Farmaceutica do Brasil LTDA, Brazil,
a wholly-owned subsidiary of the Company on June 24, 2015
Overview
Four Year Financial PerformanceCompetitive Performance
Operating Profit
•52 Week High Low : Rs 1280- Rs 2129
• P/E : 26.54
• Recommendation : BUY/HOLD
Net Sales
Net Worth
Market Watch
US Market
 Lupin’s Q1 EBITDA was 10% below estimate due to inventory adjustment in Gavis and
lower pricing for gGlumetza and higher staff cost
 Entire Gavis portfolio on both generic and brand side has been integrated into LPC’s
portfolio and LPC expects further growth from Gavis through launches (derma, controlled
substances) will add to profitability over the next few years. LPC has launched most of the
products that have been approved.
 India - Rs 9,313 mn, +5% YoY
Japan - Rs 4,232 mn, +31% YoY
 R&D - Rs 5 bn, 11.6% of Q1 revenue
 Margin was impacted as no profit was booked on inventory taken on the books in the previous
quarter from Gavis (impacted gross margin by ~1%)
 Higher other operating income was due to increased export benefits in the quarter
 Expect tax rate for FY17 at ~27%. Lower tax rate in Q1 was aided by higher R&D as well as
change in accounting standard
Q1 2016-2017
OVERVIEW
What to Expect
 Lupin expects 2HFY17 to be stronger for Gavis business led
by new launches and new capacity which is expected to
come online at Gavis’ existing plant by Sep-2016.
 Lupin expects to site-transfer all near-term critical products
from its Goa facility by Sep-2016.
 Lupin had received USFDA 483’s for Goa plants with 9
observations during March 2016. The company said it has
responded to these observations and awaits US Food and
Drug Administrator (USFDA) response.
 An FDA Form 483 is issued to firm management at the
conclusion of an inspection when an investigator(s) has
observed any conditions that in their judgement may
constitute violations of the Food Drug and Cosmetic (FD&C)
Act and related Acts.
 Two critical launches for Lupin in FY17 include Minastrin
(Lupin is FTF; launch in Mar-2017) and Epzicom (launch in the
later part of this fiscal).
 FY17 tax rate is expected to be 27%. Tax-rate will come
down this fiscal on account of higher R&D expenditure and
due to some adjustments under the Ind-AS reporting
standards
The Chemical, Industrial & Pharmaceutical Laboratories - 1935
Competitive Edge : High quality generic drugs at low cost
Business Model :
• Bulk drug manufacturing
• Reverse engineering capabilities
• Significant process skills
Key Developments :
• Trade Related Intellectual Property Rights (TRIPS) agreement
• extend patent rights - evergreening
• Cipla gets USFDA nod for overactive bladder treating drug
• Rs. 250 crores in a new R & D facility in Mumbai
• Cipla has formed Ciplagenpharm with an Australian company
• research alliance with Avesthagen, a Bangalore-based biotech
company
• strategic tie-ups :
1. AkomWatson – US
2. NeoLabs – UK
3. Medpro – South Africa
Cipla is rising up the value chain using Defensive Strategy
Stock price 577
52 week low 457
52 week high 704
Dividend 100%
EPS 17 rs
Aurobindo Pharma Business Overview
Consolidated revenues `138,960.8 million
#7 prescription supplier in the US
IMS total prescriptions dispensed as at March, 2016.
Among the top 15 generics companies in Europe by sales
(Market reports)
Revenue CAGR 33.4%
Between 2012-13 & 2015-16
Global presence : 150 countries across the globe
Consolidated revenues
International 87%
Domestic 13%
Manufacturing facilities (including wholly owned subsidiaries)
India 18
US 3
Brazil 1
Employee presence 15,000+ employees from over 30 countries
Product portfolio : Therapeutic/product areas encompassing neurosciences, cardiovasculars, gastroenterologicals, antibiotics, anti-
retrovirals, anti-diabetics and anti-allergics
Aurobindo Pharma
Company’s Strength
vertically integrating its active pharmaceutical ingredients (APIs)
To launch differentiated products including injectables,
ophthalmics, specialty products and controlled substances
Focus is on complex molecules, differentiated technology
platforms and specialty products.
New initiatives include gaining entry into complex R&D in new
businesses and differentiated technology platforms such as oncology,
hormones, enzymes, peptides, depot injections, inhalers, nasal and
dermatology products.
Plans are to expand penetration of OTC products
Well-entrenched US portfolio of 398 ANDAs filed, of which final
approvals received for 215 as at March, 2016.
Company Future Growth Plans
Major News: Boost in FY17 earnings and US &
Europe sales.
 Launch generics drug of multi-billion cholesterol-lowering
drug Rosuvastatin. The drug has an estimated market size of
$6.7 billion.
 Sales of $150-200 million from the product in the first six
months of launch.
 Stock gained 5.1 %
 Acquisition of Intellectual Property & Marketing Authorizations,
with TAD Italy, a generic company registered in Italy in 2014.
 OTC Mapooro and Carmiooro from TAD as a part of this deal.
 Acquisition of commercial operations in seven Western
European countries from Irish multinational drug
maker Actavis for €30 million.
 Sales of €320 million in 2013, but it is making
losses for the last several years.
 $1.5 billion to acquire certain products from
Israeli giant Teva in the UK, Ireland and a few
other European nations
 It isn't a bright idea for Aurobindo to go for any
acquisition. The company is yet to consolidate
its Actavis acquisition in Europe and investors
have been waiting to see the benefits of a
consolidation
 If deals is successful is will become the second-
largest Indian drug maker after Sun Pharma
Financial Analysis
Revenue growth drivers:
 US market (contributes to ~44% of overall revenue) grew by
27% due to new launches in the oral and injectable segment and
growth from the acquired Natrol Inc business
 The European market (22%) which grew by 375% in FY2015
due to the acquisition of West European operation of Actavis
witnessed a de-growth of ~2% in FY2016
 The API business (20%) registered a growth of ~7% whereas the
emerging markets (5%) grew by 22% y-o-y
 Operating margins increased by 170 bps because of a reduction
in traded goods purchased, other manufacturing expenses and
selling expenses.
 Net margin increased by 140 bps due to factors such as the firm
not incurring any extraordinary expenditure and realization of non-
operating income
52 weeks low/High
582.00 891.50
Today’s Price
Dr. Reddys Laboratories Business Overview
 Dr Reddy’s has the largest share (24.45 per cent) in the
Indian pharma market, with sales of USD1.66 billion during March 2015
In 2015, Dr. Reddy's Laboratories bought the established brands of Belgian
drugmaker UCB SA in South Asia for 8 billion rupees ($128.38 million)
USP- Strong vertically integrated portfolio of products, businesses & geographies
 Has a strong workforce of over 15,000 employees
Gross Profit Margin at 59.5%, improved by ~130 bps over last year. Research &
Development (R&D) spend at 4.1 billion. Continued focus on building complex
generics and differentiated products pipeline
Future prospects- firm will invest in new drugs such as complex generics,
biosimilars and proprietary products that offer higher margins besides exploring
new markets in Europe
Market Watch
Today’s Price
3122
Debt:Equity
0.3
Return on capital
employed
19.7
Return on equity
20.3
EPS
160
52 weeks low/High
4382.93 2750.00
R&D as % of
Revenue
11.5%
Dividend Yield
0.7
Dividend
Payout
17.6
Hold
Dr Reddy- Company Analysis
52 week
high
704
52 week
low
457
P/E ratio 41.66
Dividend
Payout
100%
Capital market Line
Depict the rates of return for efficient portfolios subject to the risk level (standard deviation)
for a market portfolio and the risk-free rate of return.
Rf, 0%, 7.10%
Lupin, 46.97%, 36.70%
Cipla, 38.78%, 15.75%
Sunpharma, 27.16%,
35.24%
Aurobindo, 130.00%,
79.56%
Dr. Reddy's Lab,
26.05%, 15%
Nifty, 15%, 6.79%
0.00%
5.00%
10.00%
15.00%
20.00%
25.00%
30.00%
35.00%
40.00%
45.00%
50.00%
55.00%
60.00%
65.00%
70.00%
75.00%
80.00%
85.00%
0% 10% 20% 30% 40% 50% 60% 70% 80% 90% 100% 110% 120% 130% 140%
Return
Risk
Capital Market Line
Q2: High risk, high
return
Q3: High risk, Low return
Q4: Low risk, Low
return
Q1:
Low
risk,
high
return
Security market Line
It displays the expected rate of return of an individual security as a function of systematic,
non-diversifiable risk .
Rf, 0%, 7.10%
Lupin, 5.412979, 36.70%
Cipla, 2.32, 15.75%
Sun pharma, 2.09,
35.24%
Aaurobindo, 5.4, 79.56%
Dr. Reddy's lab 1.24, 15%
Nifty, 1.00, 6.79%
0%
5%
10%
15%
20%
25%
30%
35%
40%
45%
50%
55%
60%
65%
70%
75%
80%
85%
0.00 0.50 1.00 1.50 2.00 2.50 3.00 3.50 4.00 4.50 5.00 5.50 6.00
RETURN
BETA
SECURITY MARKET LINE
Overpriced
Underpriced
Thank you

Study On Pharmaceuticals Companies

  • 1.
  • 2.
  • 3.
  • 4.
  • 5.
    Business Model ofPharma Sector
  • 6.
    Regulatory  Indian DrugPrice Control Order (DPCO) - pricing policy of 348 drugs, NLEM (National list of essential medicines)  GDUFA (Generic drug user fee Act passed into Law July 2012) in US  API manufacturers need to file a document known as Drug master File (DMF) with regulatory bodies for receiving a marketing authorization grant.  A Formulations player can only use APIs from sources with approved DMFs. Formulation players have to submit samples and documentation for product registration such as ANDA (Abbreviated New Drug Application) using an API source with approved DMFs.  Union Health Ministry banned 344 fixed-dose combination (FDC) drugs  In FY16., highest expenditure on research and development has been done by Sun Pharma followed by Dr. Reddy  By 2020, the Indian healthcare secto is expected to reach USD280 billion from USD70 billion cunrently  By 2020. India is likely to be among the top three pharmaceutical markets by incremental growth & 6th largest market globally in absolute size  India's cost of production is significantly lower than that of the US and almost half of that of Europe. It gives a competitive edge to India over others.  Growth Divers: Increase in the size of middle class households improvement in medical infrastructure and increase in the penetration of health insurance
  • 7.
    SUN PHARMA :Company Snapshot  The Company’s global presence is supported by 49 manufacturing facilities, spanning six continents,  Post the merger with Ranbaxy, SPIL is the largest pharmaceutical company in the domestic formulations market with a market share of 8.7% as of June 2016.  Using acquisitions and partnering to bridge critical capability gaps  Increasing contribution of specialty and complex products  Key focus areas include dermatology, ophthalmic, oncology, controlled substances, among others  Sun Pharma remains one of our top picks due to its niche generic pipeline, enhanced focus on specialty business, strong FCF generation and superior execution track record  The company's formulations are mainly sold in the United States and India, which together contributed close to 74% of its revenues in 2015-16.
  • 8.
    SUN PHARMA :Global Presence 92 1 1 1 API manufacturing sites India Australia Israel US Sun Pharma also has four research centres - 3 in India and 1 in Israel with over 900 scientists.
  • 9.
    SUN PHARMA :Key Acquisitions  Acquired Caraco in1998 to enter US markets  2010 - Acquired Taro Pharmaceutical Industries Ltd. - Israel - Enables entry into dermatology segment. Enhances presence in US generic market  2013 - Acquired Dusa Pharma in US - Enabling access to patented drug-device combination useful for treating Actinic Keratosis, a dermatology ailment  2015 - Sun Pharma – Ranbaxy Merger – to further strengthen Sun Pharma’s positioning as the 5th largest Global Specialty Generic Pharma Company and No. 1 Pharma Company in India with strong positioning in emerging markets  Entered into a joint venture with Intrexon Corporation for developing gene-based therapies for ocular diseases  2016 - Acquired InSite Vision - Focuses on developing new specialty ophthalmic products, has three late stage programs  Acquired 14 brands from Novartis for entering Japanese markets in 2016 for a consideration of US$ 293 million.  In-licensed Tildrakizumab for treating chronic plaque psoriasis. The preparations for submission of a Biologics License Application for this product to the US FDA are proceeding
  • 10.
    SUN PHARMA :Recent Activities  In 4Q, it is likely to register 26%YoY growth in revenues on the back of gGleevec sales under 180 days exclusivity.  Keveyis sales halted voluntarily: Given the high costs and resources required to identify and reach a limited number of viable patients, Taro has realized that it will be unable to sustain its current level of investment in Keveyis.  The US market (48%of overall revenue) witnessed a de-growth of ~1.5% due to regulatory issues in Halol plant, customer consolidation and pricing constraints.  In September 2015, Sun Pharma entered into an agreement to transfer two marketing divisions of its India business, operating in the central nervous system (CNS), to Strides Arcolab Ltd. for a consideration of ` 1,650 million.
  • 11.
    SUN PHARMA :Financials • Its emerging market (~20% of overall revenue) performance has been adversely impacted due to currency fluctuations and supply constraints. • In the domestic market (26% of overall revenue), the company recorded a growth of ~9% due to strong presence in the chronic segment. • In 2015-16, SPIL's revenue grew by a marginal ~3% y-o-y, mainly on account of slowdown in the US and emerging markets • Operating margin improved by 40 bps in 2015- 16, because of a marginal reduction in expenditure incurred for stocks. • Net margin improved by 70 bps partly in line with operating margin and due to a fall in tax, depreciation and interest charges.
  • 12.
    Lupin : Company Analysis OurInsight and View ……
  • 13.
    COMPANY SNAPSHOT  Lupin,the second largest Indian pharma company in terms of market capitalisation,  Targets the generics opportunity in regulated markets.  Currently, the chronic-therapy business contributes 66% of total revenue in the domestic market, which makes Lupin a strong player in the specialties segment.  Lupin has emerged as a fully-integrated company, with manufacturing capabilities in APIs and formulations and a direct marketing presence in its target markets, including the US, Europe and Japan.  In the US market, apart from being one of the fastest-growing companies in the generic space, Lupin is also one of the few Indian companies to have a strong presence in the branded generics segment as well. Acquisition  The entire shareholding in Gavis Pharmaceuticals, LLC, USA, Novel Laboratories, Inc., USA, VGS Holdings, Inc., USA, Edison Therapeutics, LLC, USA and Novel Clinical Research (India) Private Limited, India (collectively referred as Gavis), was acquired through Lupin Inc., USA, wholly- owned subsidiary of the Company  The entire shareholding in Medquimica Industria Farmaceutica LTDA, Brazil (formerly known as Medquimica Industria Farmaceutica S.A., Brazil) (Medquimica) was acquired through Lupin Farmaceutica do Brasil LTDA, Brazil, a wholly-owned subsidiary of the Company on June 24, 2015 Overview
  • 14.
    Four Year FinancialPerformanceCompetitive Performance
  • 15.
  • 16.
    •52 Week HighLow : Rs 1280- Rs 2129 • P/E : 26.54 • Recommendation : BUY/HOLD Net Sales Net Worth Market Watch
  • 17.
    US Market  Lupin’sQ1 EBITDA was 10% below estimate due to inventory adjustment in Gavis and lower pricing for gGlumetza and higher staff cost  Entire Gavis portfolio on both generic and brand side has been integrated into LPC’s portfolio and LPC expects further growth from Gavis through launches (derma, controlled substances) will add to profitability over the next few years. LPC has launched most of the products that have been approved.  India - Rs 9,313 mn, +5% YoY Japan - Rs 4,232 mn, +31% YoY  R&D - Rs 5 bn, 11.6% of Q1 revenue  Margin was impacted as no profit was booked on inventory taken on the books in the previous quarter from Gavis (impacted gross margin by ~1%)  Higher other operating income was due to increased export benefits in the quarter  Expect tax rate for FY17 at ~27%. Lower tax rate in Q1 was aided by higher R&D as well as change in accounting standard Q1 2016-2017 OVERVIEW
  • 18.
    What to Expect Lupin expects 2HFY17 to be stronger for Gavis business led by new launches and new capacity which is expected to come online at Gavis’ existing plant by Sep-2016.  Lupin expects to site-transfer all near-term critical products from its Goa facility by Sep-2016.  Lupin had received USFDA 483’s for Goa plants with 9 observations during March 2016. The company said it has responded to these observations and awaits US Food and Drug Administrator (USFDA) response.  An FDA Form 483 is issued to firm management at the conclusion of an inspection when an investigator(s) has observed any conditions that in their judgement may constitute violations of the Food Drug and Cosmetic (FD&C) Act and related Acts.  Two critical launches for Lupin in FY17 include Minastrin (Lupin is FTF; launch in Mar-2017) and Epzicom (launch in the later part of this fiscal).  FY17 tax rate is expected to be 27%. Tax-rate will come down this fiscal on account of higher R&D expenditure and due to some adjustments under the Ind-AS reporting standards
  • 19.
    The Chemical, Industrial& Pharmaceutical Laboratories - 1935 Competitive Edge : High quality generic drugs at low cost Business Model : • Bulk drug manufacturing • Reverse engineering capabilities • Significant process skills Key Developments : • Trade Related Intellectual Property Rights (TRIPS) agreement • extend patent rights - evergreening
  • 20.
    • Cipla getsUSFDA nod for overactive bladder treating drug • Rs. 250 crores in a new R & D facility in Mumbai • Cipla has formed Ciplagenpharm with an Australian company • research alliance with Avesthagen, a Bangalore-based biotech company • strategic tie-ups : 1. AkomWatson – US 2. NeoLabs – UK 3. Medpro – South Africa Cipla is rising up the value chain using Defensive Strategy
  • 21.
    Stock price 577 52week low 457 52 week high 704 Dividend 100% EPS 17 rs
  • 22.
    Aurobindo Pharma BusinessOverview Consolidated revenues `138,960.8 million #7 prescription supplier in the US IMS total prescriptions dispensed as at March, 2016. Among the top 15 generics companies in Europe by sales (Market reports) Revenue CAGR 33.4% Between 2012-13 & 2015-16 Global presence : 150 countries across the globe Consolidated revenues International 87% Domestic 13% Manufacturing facilities (including wholly owned subsidiaries) India 18 US 3 Brazil 1 Employee presence 15,000+ employees from over 30 countries Product portfolio : Therapeutic/product areas encompassing neurosciences, cardiovasculars, gastroenterologicals, antibiotics, anti- retrovirals, anti-diabetics and anti-allergics
  • 23.
    Aurobindo Pharma Company’s Strength verticallyintegrating its active pharmaceutical ingredients (APIs) To launch differentiated products including injectables, ophthalmics, specialty products and controlled substances Focus is on complex molecules, differentiated technology platforms and specialty products. New initiatives include gaining entry into complex R&D in new businesses and differentiated technology platforms such as oncology, hormones, enzymes, peptides, depot injections, inhalers, nasal and dermatology products. Plans are to expand penetration of OTC products Well-entrenched US portfolio of 398 ANDAs filed, of which final approvals received for 215 as at March, 2016. Company Future Growth Plans
  • 24.
    Major News: Boostin FY17 earnings and US & Europe sales.  Launch generics drug of multi-billion cholesterol-lowering drug Rosuvastatin. The drug has an estimated market size of $6.7 billion.  Sales of $150-200 million from the product in the first six months of launch.  Stock gained 5.1 %  Acquisition of Intellectual Property & Marketing Authorizations, with TAD Italy, a generic company registered in Italy in 2014.  OTC Mapooro and Carmiooro from TAD as a part of this deal.  Acquisition of commercial operations in seven Western European countries from Irish multinational drug maker Actavis for €30 million.  Sales of €320 million in 2013, but it is making losses for the last several years.  $1.5 billion to acquire certain products from Israeli giant Teva in the UK, Ireland and a few other European nations  It isn't a bright idea for Aurobindo to go for any acquisition. The company is yet to consolidate its Actavis acquisition in Europe and investors have been waiting to see the benefits of a consolidation  If deals is successful is will become the second- largest Indian drug maker after Sun Pharma
  • 25.
    Financial Analysis Revenue growthdrivers:  US market (contributes to ~44% of overall revenue) grew by 27% due to new launches in the oral and injectable segment and growth from the acquired Natrol Inc business  The European market (22%) which grew by 375% in FY2015 due to the acquisition of West European operation of Actavis witnessed a de-growth of ~2% in FY2016  The API business (20%) registered a growth of ~7% whereas the emerging markets (5%) grew by 22% y-o-y  Operating margins increased by 170 bps because of a reduction in traded goods purchased, other manufacturing expenses and selling expenses.  Net margin increased by 140 bps due to factors such as the firm not incurring any extraordinary expenditure and realization of non- operating income 52 weeks low/High 582.00 891.50 Today’s Price
  • 26.
    Dr. Reddys LaboratoriesBusiness Overview  Dr Reddy’s has the largest share (24.45 per cent) in the Indian pharma market, with sales of USD1.66 billion during March 2015 In 2015, Dr. Reddy's Laboratories bought the established brands of Belgian drugmaker UCB SA in South Asia for 8 billion rupees ($128.38 million) USP- Strong vertically integrated portfolio of products, businesses & geographies  Has a strong workforce of over 15,000 employees Gross Profit Margin at 59.5%, improved by ~130 bps over last year. Research & Development (R&D) spend at 4.1 billion. Continued focus on building complex generics and differentiated products pipeline Future prospects- firm will invest in new drugs such as complex generics, biosimilars and proprietary products that offer higher margins besides exploring new markets in Europe
  • 27.
    Market Watch Today’s Price 3122 Debt:Equity 0.3 Returnon capital employed 19.7 Return on equity 20.3 EPS 160 52 weeks low/High 4382.93 2750.00 R&D as % of Revenue 11.5% Dividend Yield 0.7 Dividend Payout 17.6 Hold
  • 28.
    Dr Reddy- CompanyAnalysis 52 week high 704 52 week low 457 P/E ratio 41.66 Dividend Payout 100%
  • 29.
    Capital market Line Depictthe rates of return for efficient portfolios subject to the risk level (standard deviation) for a market portfolio and the risk-free rate of return. Rf, 0%, 7.10% Lupin, 46.97%, 36.70% Cipla, 38.78%, 15.75% Sunpharma, 27.16%, 35.24% Aurobindo, 130.00%, 79.56% Dr. Reddy's Lab, 26.05%, 15% Nifty, 15%, 6.79% 0.00% 5.00% 10.00% 15.00% 20.00% 25.00% 30.00% 35.00% 40.00% 45.00% 50.00% 55.00% 60.00% 65.00% 70.00% 75.00% 80.00% 85.00% 0% 10% 20% 30% 40% 50% 60% 70% 80% 90% 100% 110% 120% 130% 140% Return Risk Capital Market Line Q2: High risk, high return Q3: High risk, Low return Q4: Low risk, Low return Q1: Low risk, high return
  • 30.
    Security market Line Itdisplays the expected rate of return of an individual security as a function of systematic, non-diversifiable risk . Rf, 0%, 7.10% Lupin, 5.412979, 36.70% Cipla, 2.32, 15.75% Sun pharma, 2.09, 35.24% Aaurobindo, 5.4, 79.56% Dr. Reddy's lab 1.24, 15% Nifty, 1.00, 6.79% 0% 5% 10% 15% 20% 25% 30% 35% 40% 45% 50% 55% 60% 65% 70% 75% 80% 85% 0.00 0.50 1.00 1.50 2.00 2.50 3.00 3.50 4.00 4.50 5.00 5.50 6.00 RETURN BETA SECURITY MARKET LINE Overpriced Underpriced
  • 31.

Editor's Notes

  • #10 These brands have combined annualised revenues of approximately US$ 160 million and address medical conditions across several therapeutic areas.
  • #11 In December 2015, Sun Pharma received a Warning Letter from the US FDA as a result of the September 2014 inspection, for its facility located at Halol, Gujarat in India.