Downloaded 23 times

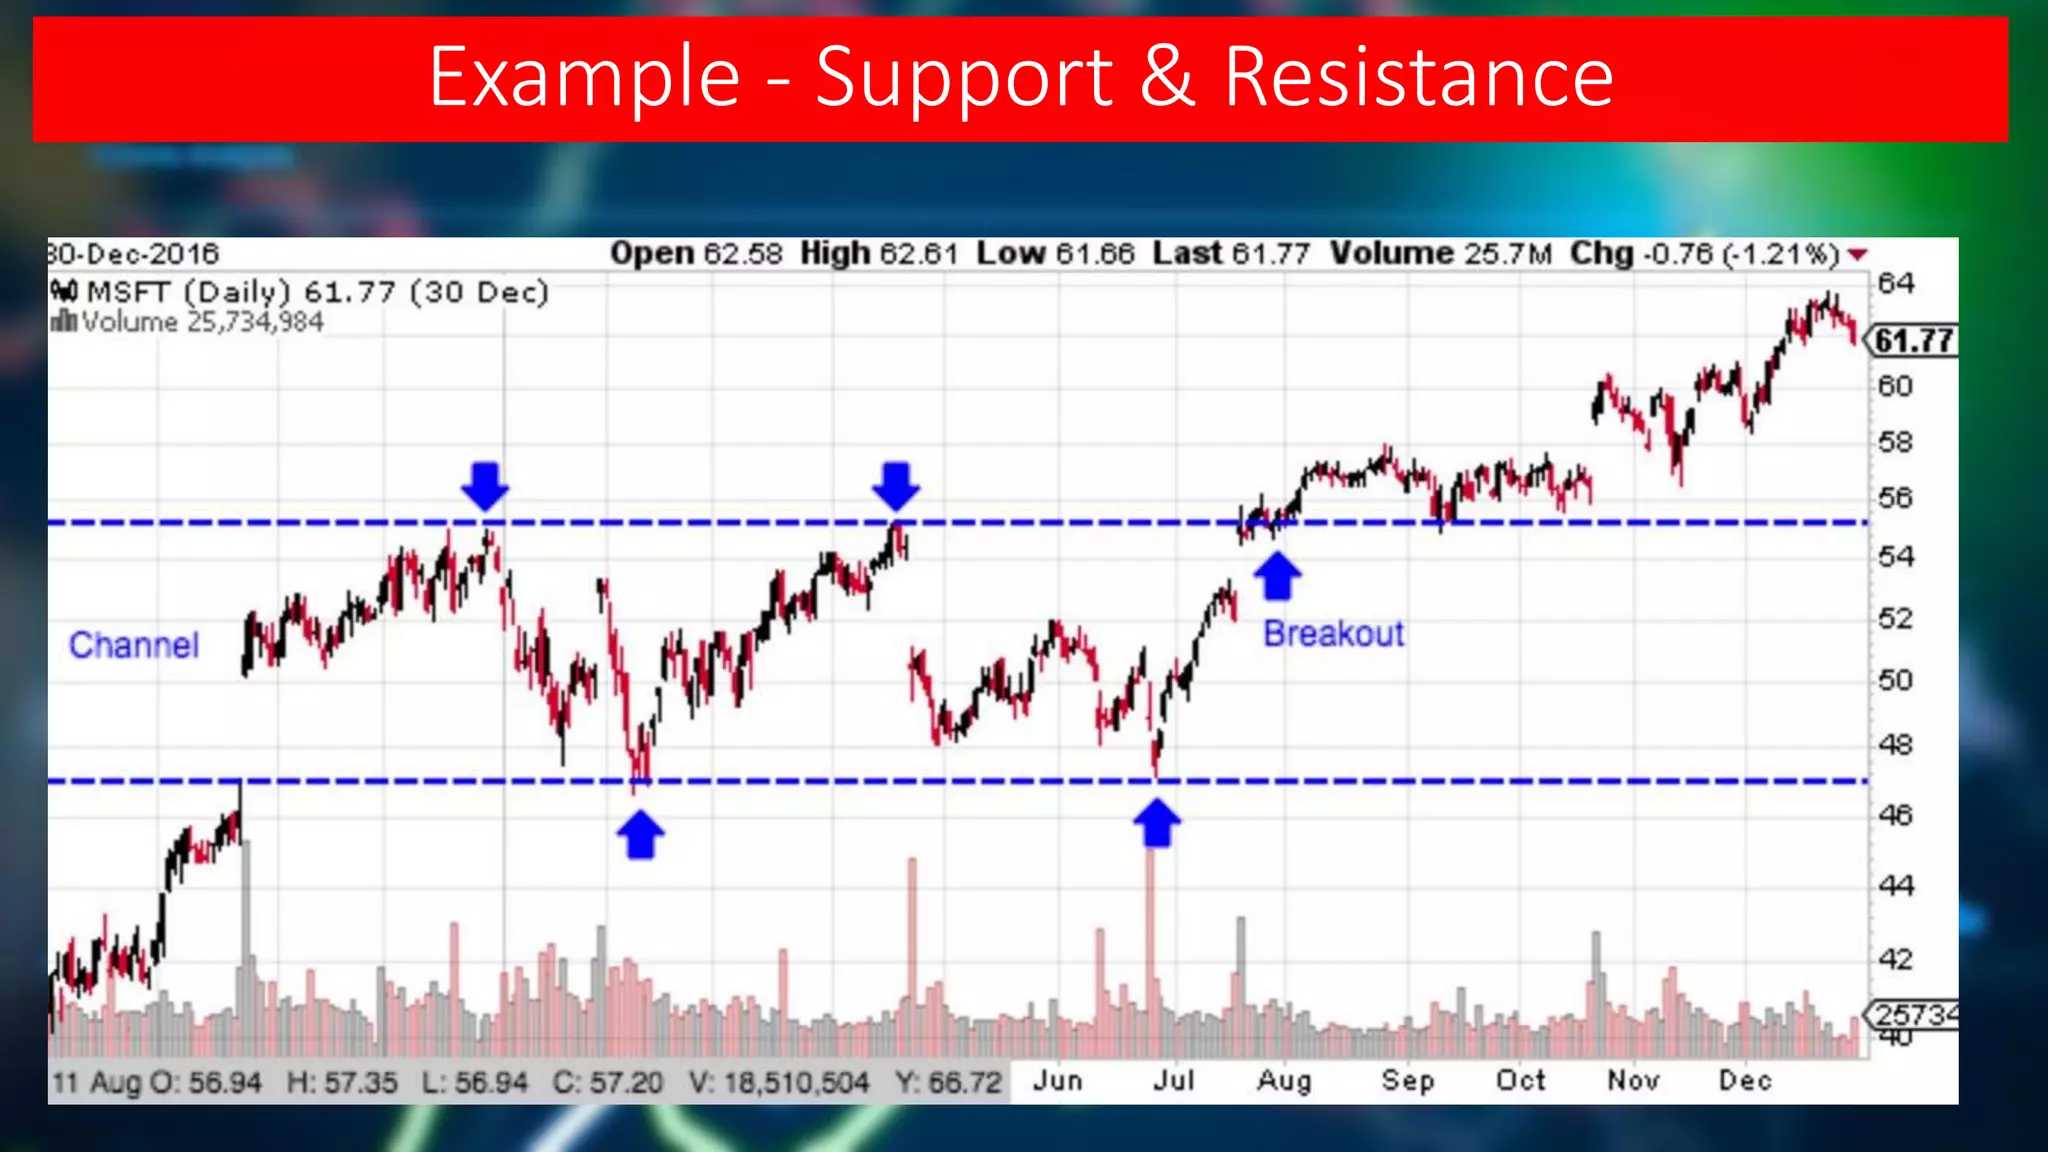
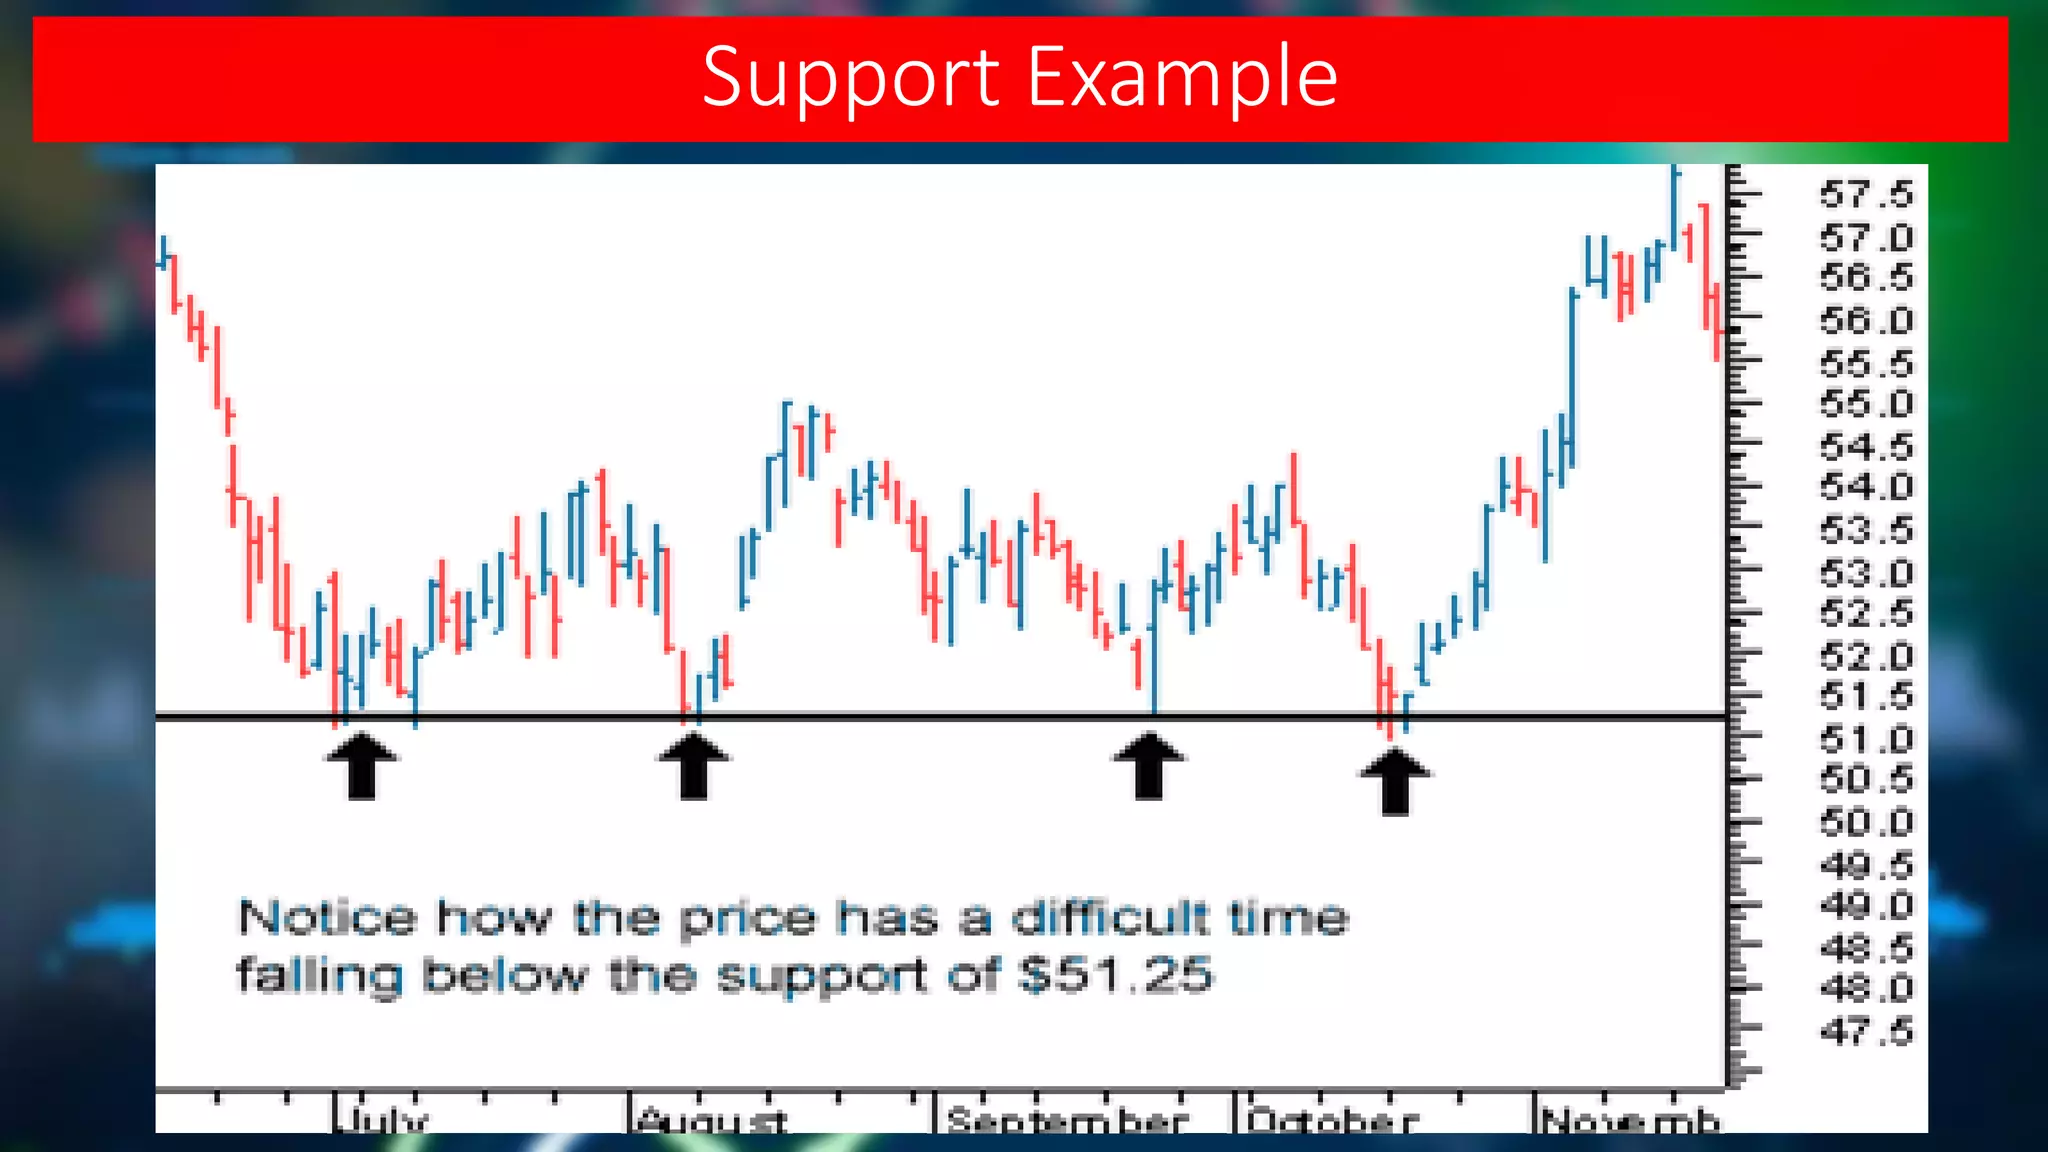
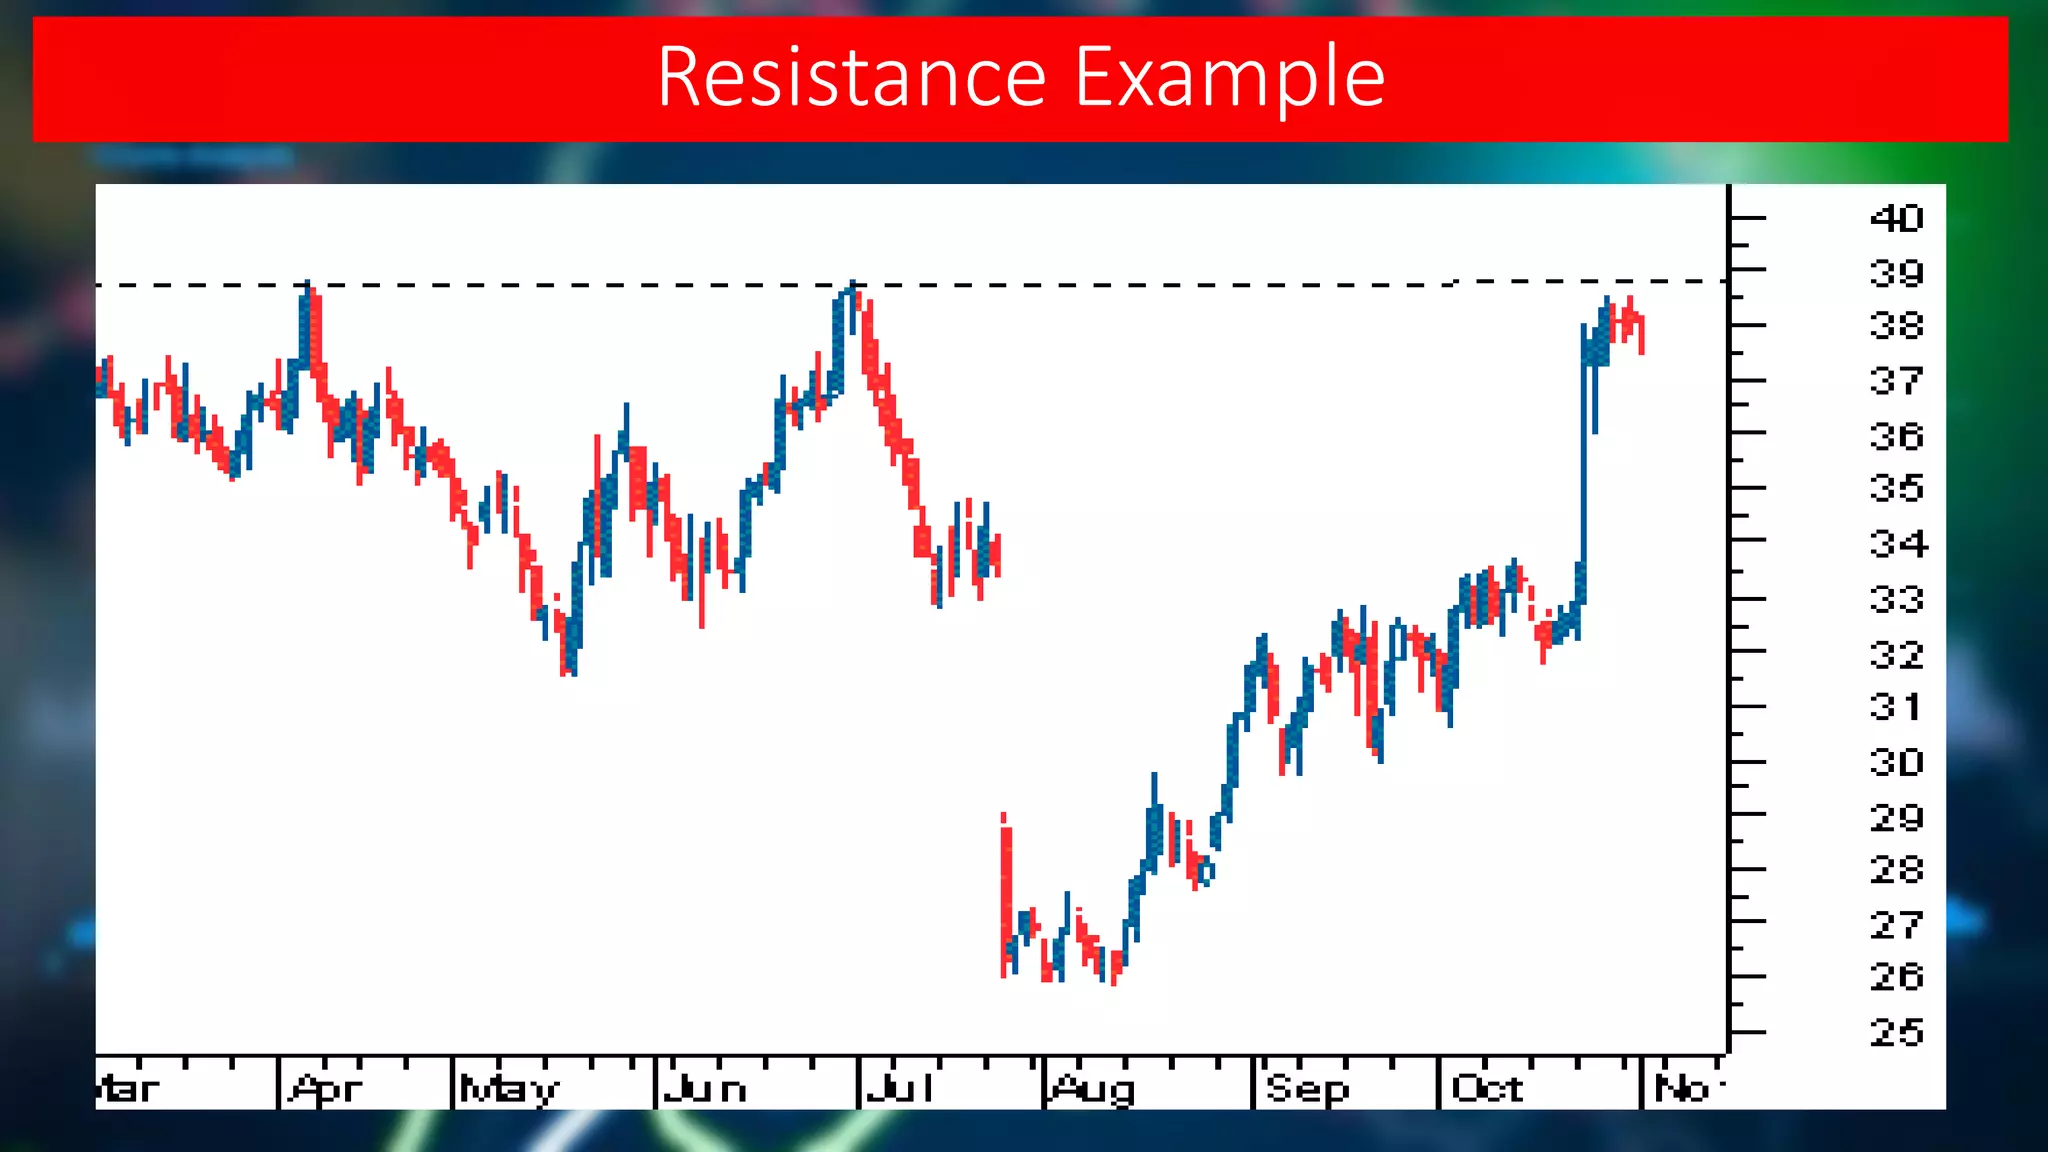
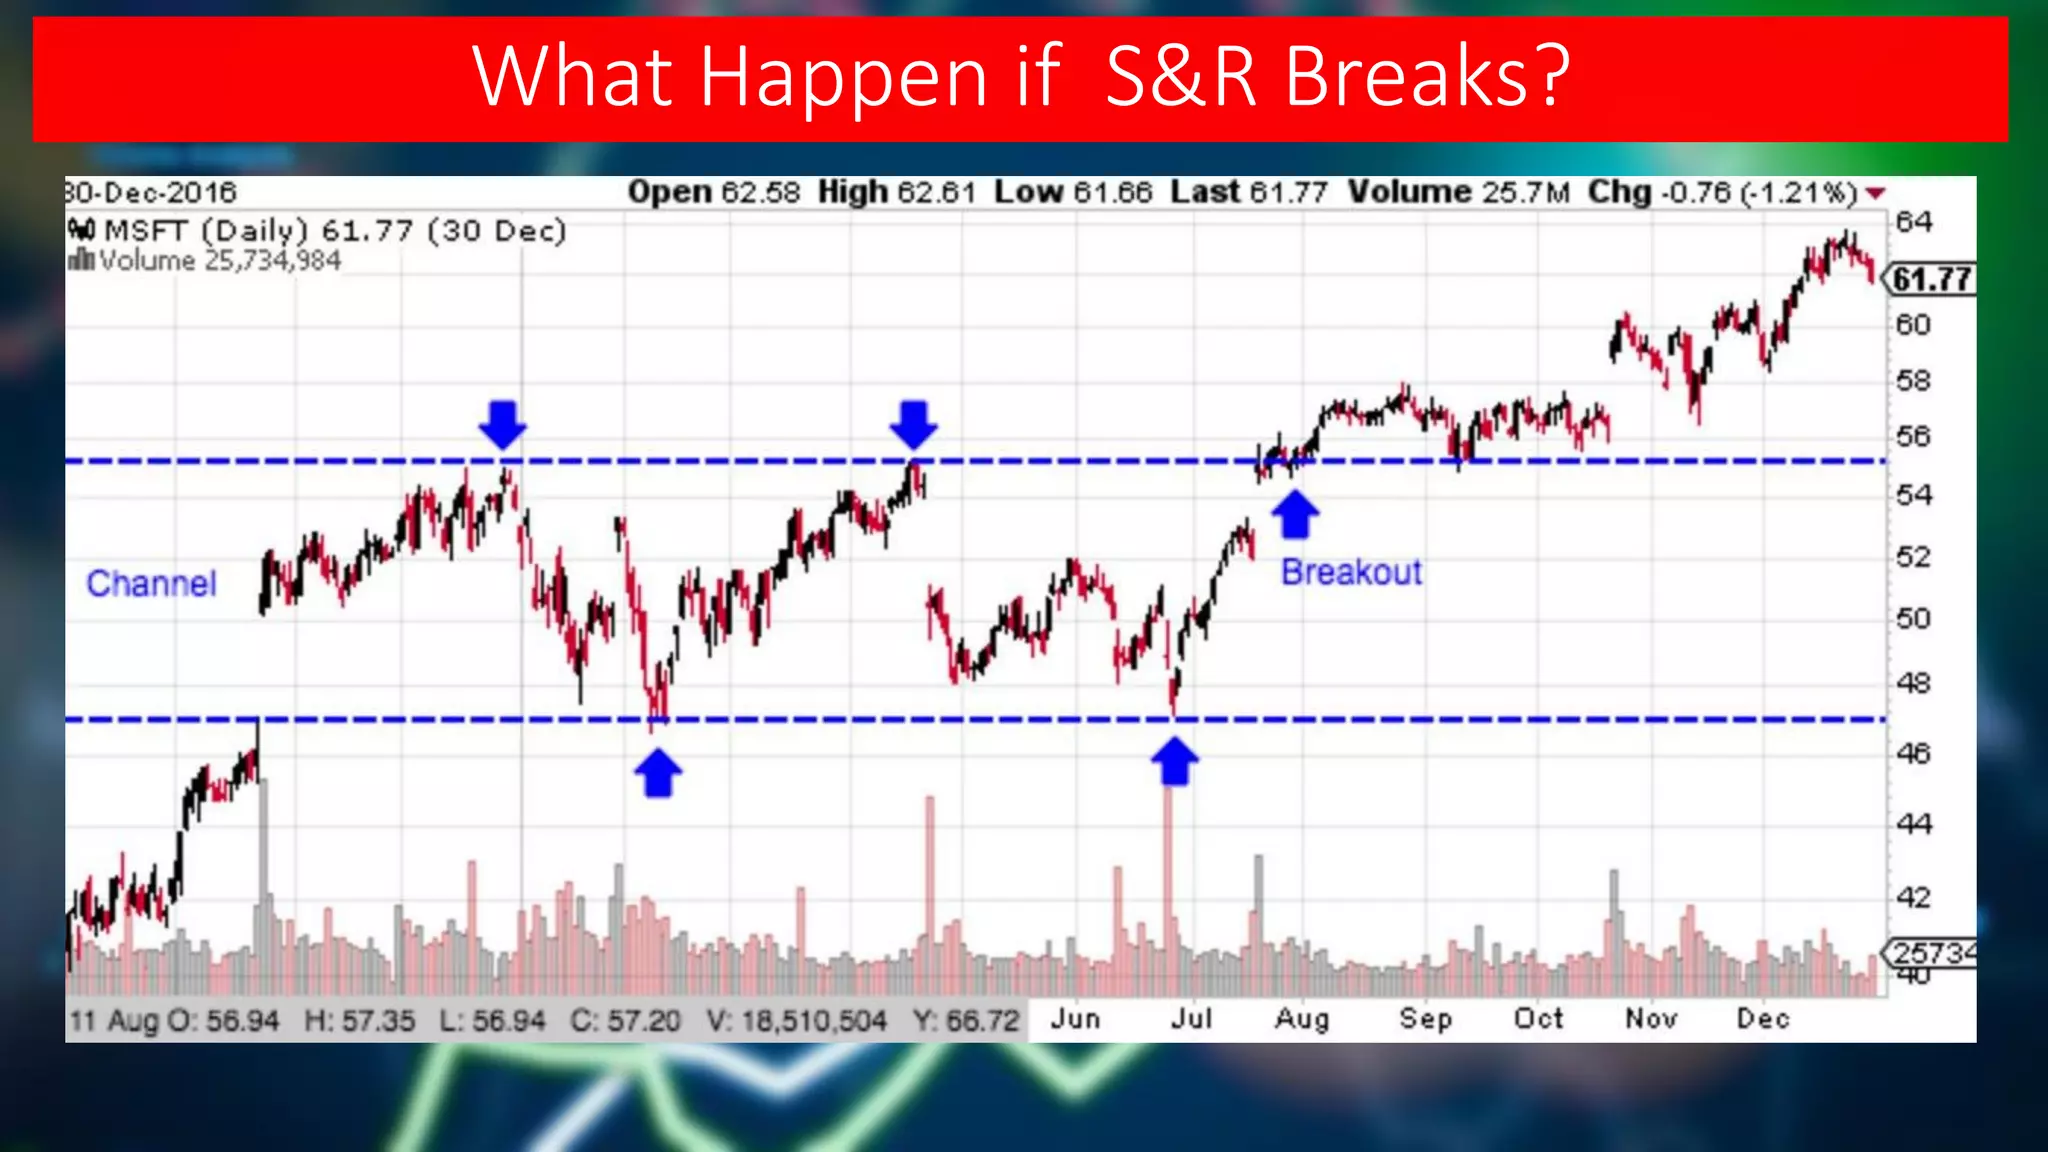

1) Support is a price level where a downtrend is expected to pause due to demand, while resistance is where an uptrend pauses due to supply. 2) Reversal points can be identified using methods like De Mark, percentage changes, Gann's two-day swing, or high volume. 3) The more times a price tests a support or resistance zone without breaking through, the more significant it becomes due to market psychology. Breaking through indicates shifts in support and resistance levels.


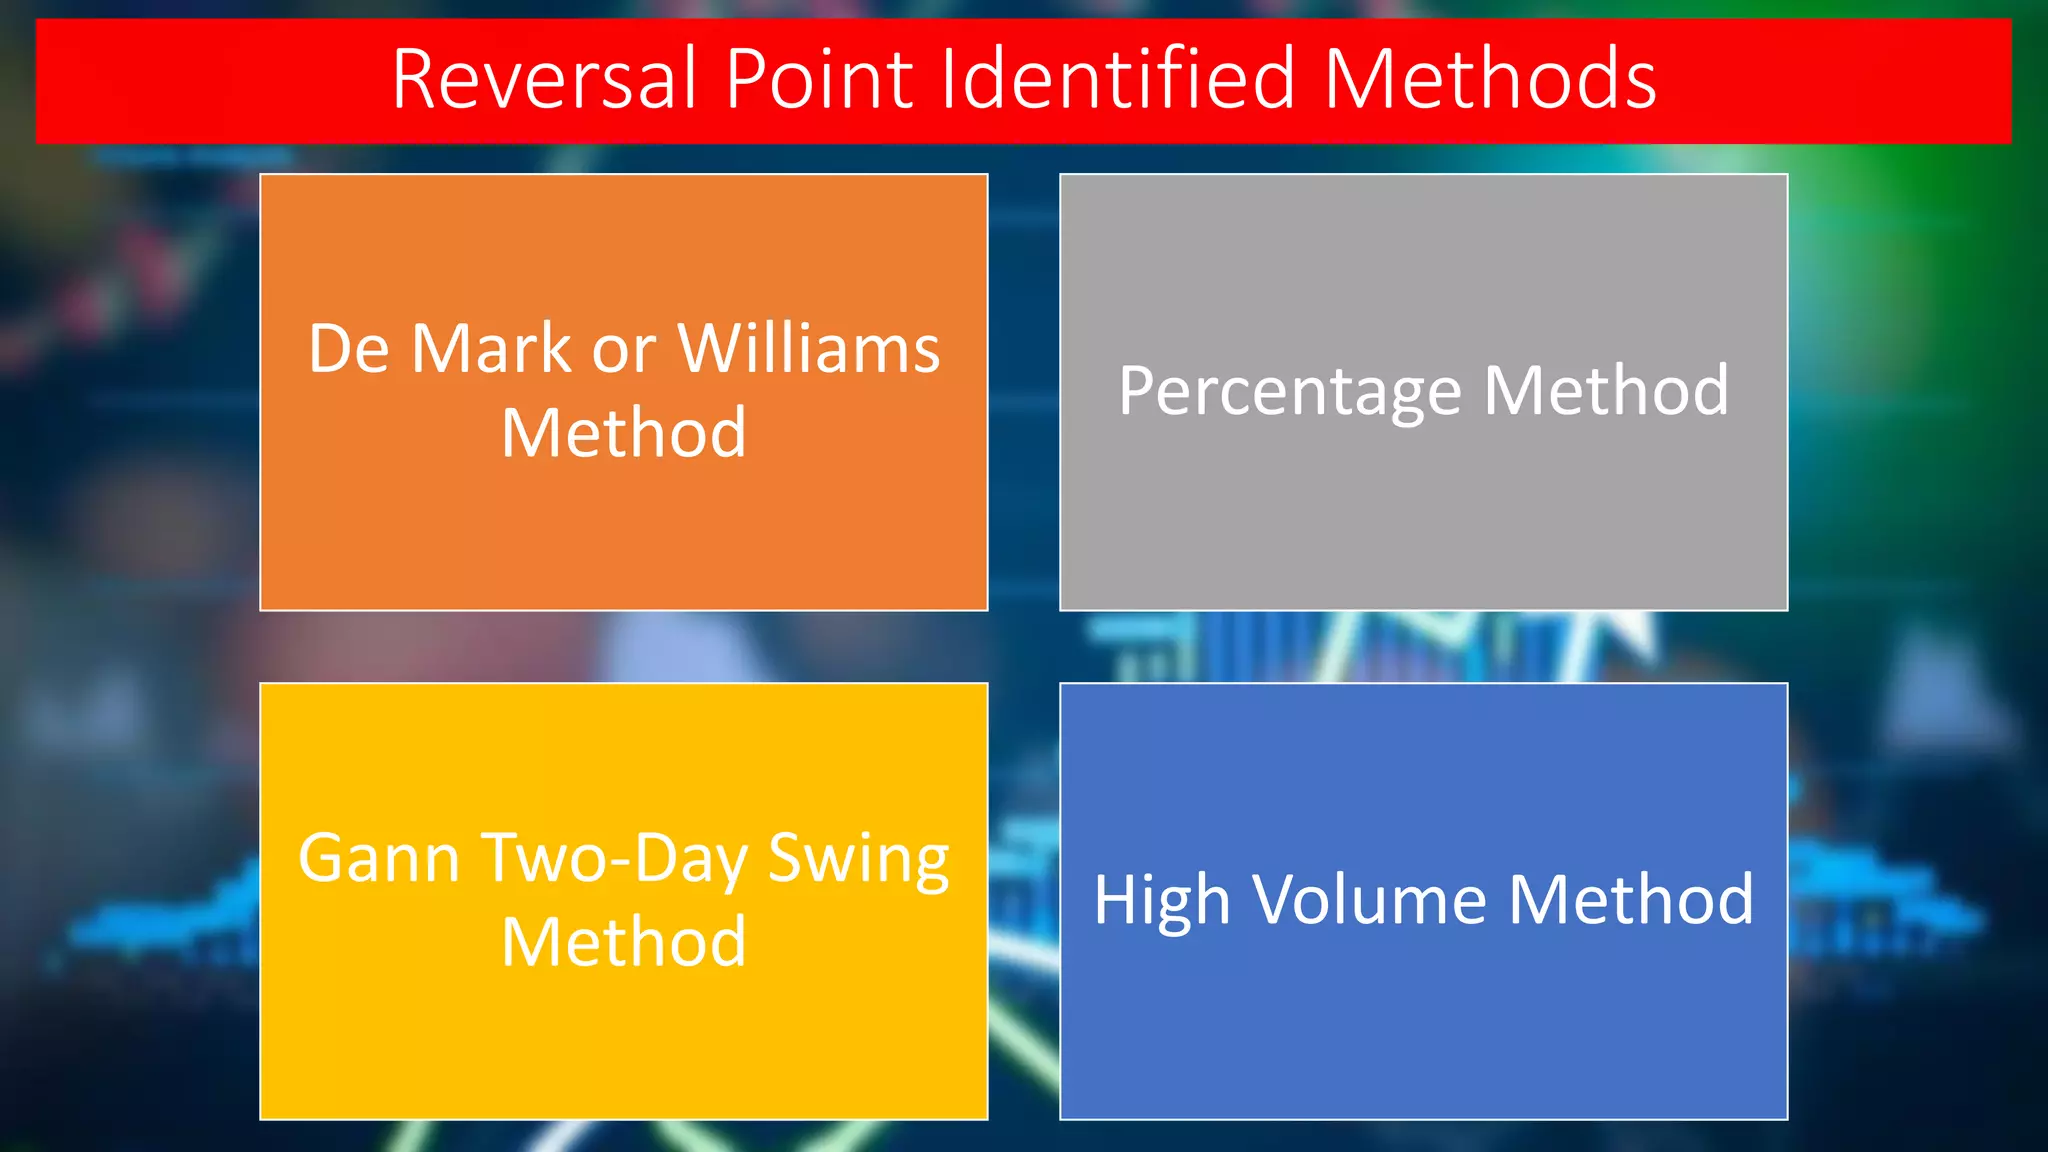
![Support and-resistance-simplified[1]](https://cdn.slidesharecdn.com/ss_thumbnails/support-and-resistance-simplified1-120113122100-phpapp01-thumbnail.jpg?width=640&height=640&fit=bounds)


