Downloaded 23 times


![Popular Momentum Indicators
This Content is Copyright Reserved Rights Copyright 2025@PTAIndia
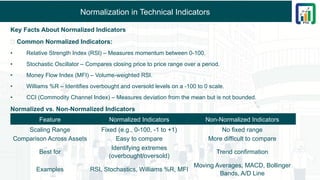
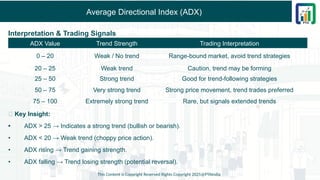
Indicator Purpose Formula Interpretation
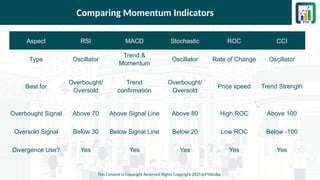
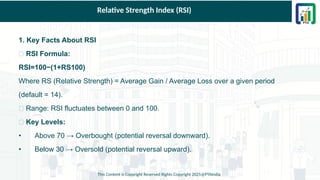
Relative Strength Index (RSI)
Measures overbought/oversold
conditions
RSI = 100 - [100 / (1 + RS)]
where RS = Avg. gains / Avg.
losses
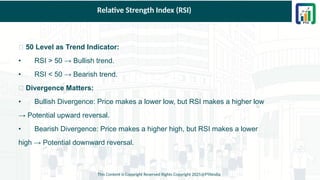
RSI > 70 → Overbought, RSI <
30 → Oversold
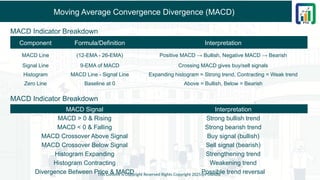
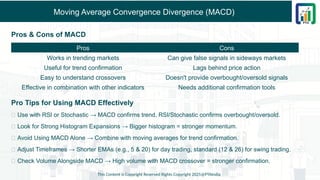
Moving Average Convergence
Divergence (MACD)
Identifies trend direction &
reversals
MACD = (12 EMA - 26 EMA),
Signal = 9 EMA of MACD
MACD > Signal → Bullish,
MACD < Signal → Bearish
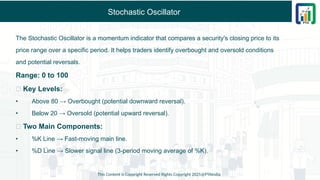
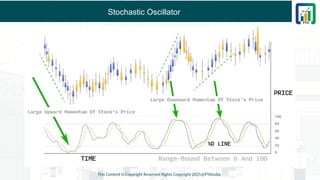
Stochastic Oscillator
Measures price relative to
range
%K = [(C - L14) / (H14 - L14)] ×
100, %D = 3-day SMA of %K
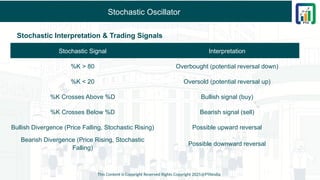
%K above 80 → Overbought,
Below 20 → Oversold
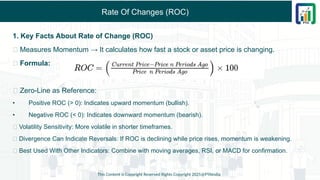
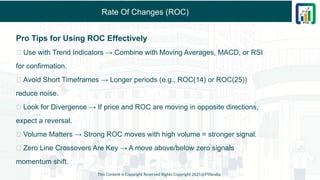
Rate of Change (ROC)
Measures speed of price
change
ROC = [(Current Price - Price N
periods ago) / Price N periods
ago] × 100
Rising ROC → Strong
Momentum, Falling ROC →
Weak Momentum
Commodity Channel Index
(CCI)
Identifies cyclical trends
CCI = (Typical Price - SMA) /
(0.015 × Mean Deviation)
CCI > 100 → Overbought, CCI
< -100 → Oversold
Williams %R Measures price strength %R = [(H - C) / (H - L)] × -100
%R above -20 → Overbought,
Below -80 → Oversold](https://image.slidesharecdn.com/section5-chapter2-technicalindicatorconstruction-250311064213-c557dfb9/85/Section-5-Chapter-2-Technical-Indicator-Construction-6-320.jpg)


Section 5 - Chapter 2 - Technical Indicator Construction - Presented by Rohan Sharma - The CMT Coach - Chartered Market Technician CMT Level 1 Study Material - CMT Level 1 Chapter Wise Short Notes - CMT Level 1 Course Content - CMT Level 1 2025 Exam Syllabus Visit Site : www.learn.ptaindia.com and www.ptaindia.com


