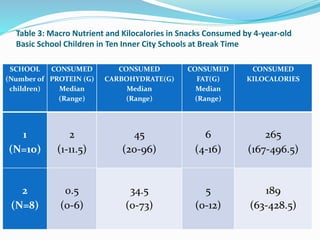
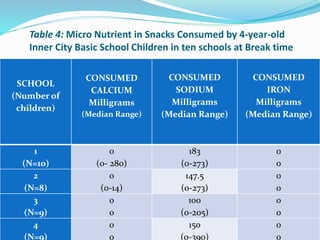
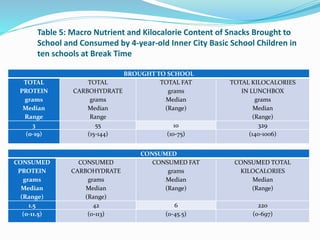
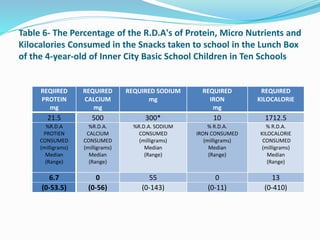
School Meals: A Lunch Box Survey of Foods
for Four Year Old Inner-City Basic School
Children at Break Time.
Andrea Searchwell
Courage is not the absence of fear… It
is the triumph over it.
Nelson Mandela
PURPOSE
 lunch box survey of the foods consumed by four- year- old inner-city
Basic School children at break time
 recording selected energy nutrients in snacks taken to school in the
lunchboxes: (Protein, Carbohydrate, Fat)
 recording important micro-nutrients in snacks: (Calcium, Sodium, Iron)
 reporting the consumption of important Nutrients by inner-city Basic
School children
 providing baseline data emphasizing the implications for the health of
children
INTRODUCTION
Nutrition and Child Development
 Proper nutrition during the first five years of a child’s
life is critical for mental, emotional as well as physical
development. Grantham – McGregor et al (2007)
 20% of deaths among young children up to six years
old could have been avoided if appropriate feeding
guidelines for young children were followed.(WHO)
Introduction
Nutrition and Child Development
 children will enter into adulthood experiencing health
problems... These include type-two diabetes, coronary
heart disease and a reduction in life expectancy.
Fox et al (2009)
LITERATURE REVIEW
 Reviews on child development in developing countries
describe nutrient deficiencies as biological risk factors
that contribute to loss of developmental potential in
children younger than 5 years.
 200 million children aged less than 5 years living in
developing countries fail to reach their potential in
cognitive and socio-emotional development because
of stunting which is an indicator of chronic under
nutrition.
Grantham McGregor et al(2007) Lancet
Early Childhood Commission (2005)
Highlighted that there were persistent levels of
malnutrition characterized by underweight and obesity
in Jamaican children
Reported the findings of the Survey of Living Conditions
in Jamaica 2004 to Cabinet in parliament
Five percent of Jamaican children were malnourished
Malnutrition
 The World Health Organization (WHO) reports that
178 million children worldwide are stunted resulting
from inadequate food, vitamin and mineral
deficiencies as well as poor diet and disease.
Malnutrition
Stunting is described as (length-for-age less than -2
standard deviation) according to the United States
National Center for Health Statistics Growth References
Stunting:
 Inadequate height for age
 Failure to thrive
 Jamaican context ( the pickney down grow)
Malnutrition
 Stunting leads to poor growth which in turn slows
down brain development and leads to poor mental
development.
 Poverty is linked to inadequate food, and when
compounded by poor sanitation and hygiene, it also
leads to infection and stunting.
Research
 Several cross-sectional studies have shown an
association between stunting and poor school
performance and reduced cognitive ability.
 In Egypt and Kenya the dietary intakes of children
have been associated with cognition and behavior.
Grantham – McGregor et al(2007) Lancet
Research
 A few longitudinal studies (long term) have been
done on the topic of nutrition and child development.
They give better quality evidence to confirm the
relationship between nutrition and development
 Studies in Guatemala and Jamaica have confirmed that
undernourished children showed later deficits in
literacy and numeracy as well as memory, vocabulary
and reasoning.
Baker – Henningham et al (2005)
OVERNUTRITION or OBESITY
 Research has shown that children sometimes snack on
calorie dense chips and sugar beverages which increase
their risk of developing obesity
Malnutrition
Obesity
 The eating habits of children are formed early
 International Obesity Task Force reported in 2003
that the prevalence of obesity in children 5-17 years
was 32% in the Americas and 10% worldwide.
Food Choices
In light of the increased number of persons suffering
under nutrition and obesity worldwide including in very
young children, the development of good eating
behaviors during childhood is needed to improve the
dietary patterns and health status of children
Fox et al (2009)
School Meals
 In Jamaican early childhood institutions or basic
schools children spend approximately seven hours a
day.
 School is often a place where children are socialized
and where they engage in eating because their peers
are doing the same.
 School age children [in Jamaica] engage in a high
consumption of snacks and sweets both for break and
lunch and although these are high in energy they are
low in protein and micronutrients especially iron.
Walker et al (2007)
Methodology
STUDY SITE
 The sample was selected from a larger study looking at
violence prevention intervention in inner city basic schools
in Kingston Jamaica. TMRI, UWI
 The parent study was a cluster randomized controlled trial
in 24 inner city basic schools. There are approximately 20
students in each class.
 This study utilized a convenience sample of the 4 year old
classes in 10 of the basic schools in the parent study.
Sample
 A convenience sample of 103 lunch boxes was selected
from the 4 year old classes in the 10 basic schools.
Data Collection
 The researcher acted as a non participant
observer
 The observation instrument was compiled using a
validated observation sheet adapted from the Early
Childhood Nutrition Pilot Study
 The instrument was adjusted after piloting by
including more space under the lunchbox
identification to accommodate a detailed description
of the lunch box
Ethical Approval
 An application was submitted to the University of the West
Indies Ethical Committee and an exemption for ethical
approval was granted.
 The researcher was advised to obtain written consent from
the Ministry of Education as well as the Principal in each of
the study schools and this was obtained.
Procedures
 1. Obtain written permission from the Ministry of
Education and principals of the ten basic schools
selected for the lunch box survey.
 2. Visit each school and schedule the date and time
for data collection with principal and the teacher for
class four.
 3. Check the class time table for the times allotted for
break and lunch.
Procedures
 4. On the day of data collection arrive at the school at
least one and a half hours before break time.
 5. Report to the principal and the class teacher on
plans for the lunch box survey.
 6. Proceed to the class room and identify the area
where the lunch boxes/bags are kept.
Procedures
7. Identify and sort lunch bags and separate them from
the school bags.
8. Find out which school bags are used for snacks as well
as those snacks that are kept in the kitchen.
9. Use a small numbered sticker to tag the lunch bag. It
should be place inconspicuously so that children may
not remove it. (e.g. In a pocket or under a flap).
Procedures
 10. Write a detailed description of the lunch bag
indicating the brand name, colour or any identifying
feature which may distinguish it from others.
 11. The observation sheet was then used to record the
pre-break contents as well as post- break contents of
the lunch bag.
INSTRUMENT
 Validated observation sheet adapted from the Early
Childhood Nutrition Pilot Study.
 Piloted and pre-tested in two schools
Lunch Box Number and ID Food Choices Portions Eaten
#1
Green and black Yak Pack
medium size bag. Front
pocket black.
1 bag St. Mary’s banana
chip . (2oz.)
1 chubby soda grape. (4oz)
All
1/2
#2
LUNCH BOX SUVEY
FOOD CHOICES AND PORTIONS EATEN AT BREAK
SCHOOL ID: _________________________
DATE:___________________ TIME:___________________
Data Collection
 Additional note paper was used to record the
nutritional contents of the local foods that would not
be found in Nutribase a nutrition data analysis
programme.
 Empty snack bags, paper, drink boxes and bottles were
collected and the nutrient contents of these foods
recorded from food labels at a later time.
Procedures
 Children were observed during break time to
determine if portions were spilled or discarded in the
garbage bins.
 An estimate of the children’s consumption was done
and recorded in fractions so that children were
recorded as eating whole, half, or a quarter of the
snack or lunch items
 The researcher did the observation on one school day
in each of the 10 four year old class rooms.
Data Analysis using NUTRIBASE
Food Item Protein
grams
Carbs
grams
Fat
grams
Fruit -
Flavored
Drinks
3.36 3.90 0
Fruits, Canned 3.36 3.60 -
3.78
0
Fruits, Raw 3.36 2.48 -
3.60
0
0
Data Collection
 The food items which represented the snacks selected
by the inner city basic school children were entered
into the Nutribase Data base.
 The Nutribase database is a nutrition analysis
programme used to analyse the nutrient content of
food items. The majority of the food items were not
found in the Nutribase database.
Data Collection
 The nutrient content of food items not found were
entered manually into the database as a Personal Food
Item (PFI).
 Where no nutrient information for the food items was
available the Food Composition Tables compiled by
the Caribbean Food and Nutrition Institute was used
and the food items entered manually into the
Nutribase Database.
Data Collection
 The results were entered into SPSS.
 Descriptive statistics was used to present the findings. The
data was skewed eg. some snacks were high in sodium and
some were low
 The Median and Range statistics were utilized instead of
the Mean (average)
 Median gives a better (true) report of the average because it
is not affected by high or low numbers
Presentation of Findings
 Table 1 shows the most popular snacks brought to
school in the lunch box of the 4-year-old inner city
basic school children in the study. The snacks were
mainly low in protein, calcium and iron and high in
sodium.
Table 1- Popular Snacks Brought to Schools in the Lunch Box of 4-year-old
Inner City Basic School Children in Ten Schools
FOOD ITEM PRO
gm
CHO
gm
FAT
gm
CALCIUM
mg
SODIUM
mg
IRON
mg
KCAL
cheese krunches 3 25 7 0 390 0 175
chee zees corn snacks 3 22 16 0 300 0 244
big foot corn snack 1 11 6 0 205 0 102
sandwich cookies 2 24 7 0 80 0 171.5
soda
0 36 0 0 0 0 144
pine apple juice drink 0 27 0 0 0 0 108
fruit punch
0 23 0 0 0 0 92
cherry fruit drink 0 36 0 0 0 0 144
Table 2 : Percentage Contribution of Food
Items in the Lunch Boxes of 4-year-old Inner
City Basic School Children in Ten Schools
FOOD ITEM NUMBER OF
CHILDREN OBSERVED
(103)
PERCENT
FRUIT 6 6
CHIPS 40 39
BAKED PRODUCTS 40 39
CHEESE TRIX TYPE 44 43
DRINK
SODA 20 19
FRUIT JUICE/DRINK 87 85
Table 3: Macro Nutrient and Kilocalories in Snacks Consumed by 4-year-old
Basic School Children in Ten Inner City Schools at Break Time
SCHOOL
(Number of
children)
CONSUMED
PROTEIN (G)
Median
(Range)
CONSUMED
CARBOHYDRATE(G)
Median
(Range)
CONSUMED
FAT(G)
Median
(Range)
CONSUMED
KILOCALORIES
1
(N=10)
2
(1-11.5)
45
(20-96)
6
(4-16)
265
(167-496.5)
2
(N=8)
0.5
(0-6)
34.5
(0-73)
5
(0-12)
189
(63-428.5)
Table 4: Micro Nutrient in Snacks Consumed by 4-year-old
Inner City Basic School Children in ten schools at Break time
SCHOOL
(Number of
children)
CONSUMED
CALCIUM
Milligrams
(Median Range)
CONSUMED
SODIUM
Milligrams
(Median Range)
CONSUMED
IRON
Milligrams
(Median Range)
1
(N=10)
0
(0- 280)
183
(0-273)
0
0
2
(N=8)
0
(0-14)
147.5
(0-273)
0
0
3
(N=9)
0
0
100
(0-205)
0
0
4
(N=9)
0
0
150
(0-390)
0
0
Table 5: Macro Nutrient and Kilocalorie Content of Snacks Brought to
School and Consumed by 4-year-old Inner City Basic School Children in
ten schools at Break Time
BROUGHT TO SCHOOL
TOTAL
PROTEIN
grams
Median
Range
TOTAL
CARBOHYDRATE
grams
Median
Range
TOTAL FAT
grams
Median
(Range)
TOTAL KILOCALORIES
IN LUNCHBOX
grams
Median
(Range)
3 55 10 329
(0-19) (15-144) (10-75) (140-1006)
CONSUMED
CONSUMED
PROTEIN
grams
Median
(Range)
CONSUMED
CARBOHYDRATE
grams
Median
(Range)
CONSUMED FAT
grams
Median
(Range)
CONSUMED TOTAL
KILOCALORIES
Median
(Range)
1.5 42 6 220
(0-11.5) (0-113) (0-45.5) (0-697)
Table 6- The Percentage of the R.D.A's of Protein, Micro Nutrients and
Kilocalories Consumed in the Snacks taken to school in the Lunch Box
of the 4-year-old of Inner City Basic School Children in Ten Schools
REQIIRED
PROTEIN
mg
REQUIRED
CALCIUM
mg
REQUIRED SODIUM
mg
REQUIRED
IRON
mg
REQUIRED
KILOCALORIE
21.5 500 300* 10 1712.5
%R.D.A
PROTIEN
CONSUMED
(milligrams)
Median
(Range)
%R.D.A.
CALCIUM
CONSUMED
(milligrams)
Median
(Range)
%R.D.A. SODIUM
CONSUMED
(milligrams)
Median
(Range)
% R.D.A.
IRON CONSUMED
(milligrams)
Median
(Range)
% R.D.A.
KILOCALORIE
CONSUMED
(milligrams)
Median
(Range)
6.7 0 55 0 13
(0-53.5) (0-56) (0-143) (0-11) (0-410)
Findings
 The most popular food items were commercially
prepared fruit drinks, chips and baked products such
as biscuits or crackers.
 Very few fruits and no vegetables were consumed by
the children
 Salty snack items such as chips or cheese trix were
popular.
EMPTY CALORIES
Findings
 preschool children snack on foods high in calories but
low in protein and micronutrients
 the pattern of consumption is not consistent with
dietary guidelines e.g Recommended Dietary
Allowances and has implications for children’s health
and well being
These food consumption patterns may lead to
under nutrition (characterized by stunting)
 Failure to thrive
 Impaired mental development
 Emotional issues
 Behavioral problems
 Poor performance in school
 Inter - generational poverty
.
Findings
Empty calorie foods (high in calories and low in
vitamins and minerals) were popular in lunch boxes
Implications:
 Obesity increasing the burden of disease
 High rates of non communicable diseases
 Diabetes, hypertension, cancer, heart disease
 Disability and death
Recommendations
 Dietary guidelines given to parents and care givers
should stress the importance of meeting the special
nutritional needs of preschool children
Recommendations
 Increase the awareness of parents, teachers and care
givers about the impact of early food choices on the
eating habits of children over time.
 Policy guidelines which indicate the nutrient content
of school meals should be formulated to improve the
diet of school children since they spend several hours a
day in school.
Prepare and promote
References
1. Retrieved March 19, (2010) World Health Organisation (WHO) 10 facts on
nutrition.http:// www. who.int/ features/act/files/nutrition/facts/en/index.html.
2. Fox M. K, Dodd A.H., Wilson A., Gleason P.M, (2009) Association between
School Food Environment and Practices and Body Mass Index of U.S. Public School Children: Journal of American Dietetic
Association, Supplement 1, Vol. 109.#2, S108-S117.2.
3. Grantham – McGregor S., Cheng Y.B.(2007) Child Development in
Developing Countries: Developmental Potential in the first 5 years for children in developing countries. The Lancet
Vol.369#9555:60-70.
4. Engle P.L.,Black M., Behrman J.r., Cabral de Mello M.,Gertler P.J.,Kapririri
L., Martorell R., Young M.E.,and the International Child Development Steering Committee:(2007) Child Development in
Developing Countries 3:Strategies to avoid loss of developmental potential more than 200 million children in the developing
world. The Lancet .vol.369 num.9557.229-242.
5. U S National Centre for Statistics and Growth References
References
6. World Health Organization official website
7. Grantham – McGregor S., Cheng Y.B.(2007) Child Development in
Developing Countries: Developmental Potential in the first 5 years for children in developing countries. The Lancet Vol.369#9555:60-70.
8. Devaney B., Ziegler P., Pac S., Karwe V., Barr S. (2004) Feeding Infants and
Toddlers Study: Meals, Snack and Beverage Patterns of Infants and Toddlers. Journal of American Dietetics Association.Vol.104/Num.1
Suppl.1
9. Early Childhood Commission (2006): The Development and Implementation of
a Nutrition Programme for Early Childhood Institutions in St. Mary, Jamaica
10. Planning Institute of Jamaica (2002) Survey of Living Conditions.
11. Planning Institute of Jamaica (2002) Survey of Living Conditions

School Meals

  • 1.
    School Meals: ALunch Box Survey of Foods for Four Year Old Inner-City Basic School Children at Break Time. Andrea Searchwell
  • 2.
    Courage is notthe absence of fear… It is the triumph over it. Nelson Mandela
  • 3.
    PURPOSE  lunch boxsurvey of the foods consumed by four- year- old inner-city Basic School children at break time  recording selected energy nutrients in snacks taken to school in the lunchboxes: (Protein, Carbohydrate, Fat)  recording important micro-nutrients in snacks: (Calcium, Sodium, Iron)  reporting the consumption of important Nutrients by inner-city Basic School children  providing baseline data emphasizing the implications for the health of children
  • 4.
    INTRODUCTION Nutrition and ChildDevelopment  Proper nutrition during the first five years of a child’s life is critical for mental, emotional as well as physical development. Grantham – McGregor et al (2007)  20% of deaths among young children up to six years old could have been avoided if appropriate feeding guidelines for young children were followed.(WHO)
  • 5.
    Introduction Nutrition and ChildDevelopment  children will enter into adulthood experiencing health problems... These include type-two diabetes, coronary heart disease and a reduction in life expectancy. Fox et al (2009)
  • 6.
    LITERATURE REVIEW  Reviewson child development in developing countries describe nutrient deficiencies as biological risk factors that contribute to loss of developmental potential in children younger than 5 years.  200 million children aged less than 5 years living in developing countries fail to reach their potential in cognitive and socio-emotional development because of stunting which is an indicator of chronic under nutrition. Grantham McGregor et al(2007) Lancet
  • 7.
    Early Childhood Commission(2005) Highlighted that there were persistent levels of malnutrition characterized by underweight and obesity in Jamaican children Reported the findings of the Survey of Living Conditions in Jamaica 2004 to Cabinet in parliament Five percent of Jamaican children were malnourished
  • 8.
    Malnutrition  The WorldHealth Organization (WHO) reports that 178 million children worldwide are stunted resulting from inadequate food, vitamin and mineral deficiencies as well as poor diet and disease.
  • 9.
    Malnutrition Stunting is describedas (length-for-age less than -2 standard deviation) according to the United States National Center for Health Statistics Growth References Stunting:  Inadequate height for age  Failure to thrive  Jamaican context ( the pickney down grow)
  • 10.
    Malnutrition  Stunting leadsto poor growth which in turn slows down brain development and leads to poor mental development.  Poverty is linked to inadequate food, and when compounded by poor sanitation and hygiene, it also leads to infection and stunting.
  • 11.
    Research  Several cross-sectionalstudies have shown an association between stunting and poor school performance and reduced cognitive ability.  In Egypt and Kenya the dietary intakes of children have been associated with cognition and behavior. Grantham – McGregor et al(2007) Lancet
  • 12.
    Research  A fewlongitudinal studies (long term) have been done on the topic of nutrition and child development. They give better quality evidence to confirm the relationship between nutrition and development  Studies in Guatemala and Jamaica have confirmed that undernourished children showed later deficits in literacy and numeracy as well as memory, vocabulary and reasoning. Baker – Henningham et al (2005)
  • 13.
    OVERNUTRITION or OBESITY Research has shown that children sometimes snack on calorie dense chips and sugar beverages which increase their risk of developing obesity
  • 14.
    Malnutrition Obesity  The eatinghabits of children are formed early  International Obesity Task Force reported in 2003 that the prevalence of obesity in children 5-17 years was 32% in the Americas and 10% worldwide.
  • 15.
    Food Choices In lightof the increased number of persons suffering under nutrition and obesity worldwide including in very young children, the development of good eating behaviors during childhood is needed to improve the dietary patterns and health status of children Fox et al (2009)
  • 16.
    School Meals  InJamaican early childhood institutions or basic schools children spend approximately seven hours a day.  School is often a place where children are socialized and where they engage in eating because their peers are doing the same.
  • 17.
     School agechildren [in Jamaica] engage in a high consumption of snacks and sweets both for break and lunch and although these are high in energy they are low in protein and micronutrients especially iron. Walker et al (2007)
  • 18.
    Methodology STUDY SITE  Thesample was selected from a larger study looking at violence prevention intervention in inner city basic schools in Kingston Jamaica. TMRI, UWI  The parent study was a cluster randomized controlled trial in 24 inner city basic schools. There are approximately 20 students in each class.  This study utilized a convenience sample of the 4 year old classes in 10 of the basic schools in the parent study.
  • 19.
    Sample  A conveniencesample of 103 lunch boxes was selected from the 4 year old classes in the 10 basic schools.
  • 20.
    Data Collection  Theresearcher acted as a non participant observer  The observation instrument was compiled using a validated observation sheet adapted from the Early Childhood Nutrition Pilot Study  The instrument was adjusted after piloting by including more space under the lunchbox identification to accommodate a detailed description of the lunch box
  • 21.
    Ethical Approval  Anapplication was submitted to the University of the West Indies Ethical Committee and an exemption for ethical approval was granted.  The researcher was advised to obtain written consent from the Ministry of Education as well as the Principal in each of the study schools and this was obtained.
  • 22.
    Procedures  1. Obtainwritten permission from the Ministry of Education and principals of the ten basic schools selected for the lunch box survey.  2. Visit each school and schedule the date and time for data collection with principal and the teacher for class four.  3. Check the class time table for the times allotted for break and lunch.
  • 23.
    Procedures  4. Onthe day of data collection arrive at the school at least one and a half hours before break time.  5. Report to the principal and the class teacher on plans for the lunch box survey.  6. Proceed to the class room and identify the area where the lunch boxes/bags are kept.
  • 24.
    Procedures 7. Identify andsort lunch bags and separate them from the school bags. 8. Find out which school bags are used for snacks as well as those snacks that are kept in the kitchen. 9. Use a small numbered sticker to tag the lunch bag. It should be place inconspicuously so that children may not remove it. (e.g. In a pocket or under a flap).
  • 25.
    Procedures  10. Writea detailed description of the lunch bag indicating the brand name, colour or any identifying feature which may distinguish it from others.  11. The observation sheet was then used to record the pre-break contents as well as post- break contents of the lunch bag.
  • 26.
    INSTRUMENT  Validated observationsheet adapted from the Early Childhood Nutrition Pilot Study.  Piloted and pre-tested in two schools
  • 27.
    Lunch Box Numberand ID Food Choices Portions Eaten #1 Green and black Yak Pack medium size bag. Front pocket black. 1 bag St. Mary’s banana chip . (2oz.) 1 chubby soda grape. (4oz) All 1/2 #2 LUNCH BOX SUVEY FOOD CHOICES AND PORTIONS EATEN AT BREAK SCHOOL ID: _________________________ DATE:___________________ TIME:___________________
  • 28.
    Data Collection  Additionalnote paper was used to record the nutritional contents of the local foods that would not be found in Nutribase a nutrition data analysis programme.  Empty snack bags, paper, drink boxes and bottles were collected and the nutrient contents of these foods recorded from food labels at a later time.
  • 29.
    Procedures  Children wereobserved during break time to determine if portions were spilled or discarded in the garbage bins.  An estimate of the children’s consumption was done and recorded in fractions so that children were recorded as eating whole, half, or a quarter of the snack or lunch items  The researcher did the observation on one school day in each of the 10 four year old class rooms.
  • 30.
    Data Analysis usingNUTRIBASE Food Item Protein grams Carbs grams Fat grams Fruit - Flavored Drinks 3.36 3.90 0 Fruits, Canned 3.36 3.60 - 3.78 0 Fruits, Raw 3.36 2.48 - 3.60 0 0
  • 31.
    Data Collection  Thefood items which represented the snacks selected by the inner city basic school children were entered into the Nutribase Data base.  The Nutribase database is a nutrition analysis programme used to analyse the nutrient content of food items. The majority of the food items were not found in the Nutribase database.
  • 32.
    Data Collection  Thenutrient content of food items not found were entered manually into the database as a Personal Food Item (PFI).  Where no nutrient information for the food items was available the Food Composition Tables compiled by the Caribbean Food and Nutrition Institute was used and the food items entered manually into the Nutribase Database.
  • 33.
    Data Collection  Theresults were entered into SPSS.  Descriptive statistics was used to present the findings. The data was skewed eg. some snacks were high in sodium and some were low  The Median and Range statistics were utilized instead of the Mean (average)  Median gives a better (true) report of the average because it is not affected by high or low numbers
  • 34.
    Presentation of Findings Table 1 shows the most popular snacks brought to school in the lunch box of the 4-year-old inner city basic school children in the study. The snacks were mainly low in protein, calcium and iron and high in sodium.
  • 35.
    Table 1- PopularSnacks Brought to Schools in the Lunch Box of 4-year-old Inner City Basic School Children in Ten Schools FOOD ITEM PRO gm CHO gm FAT gm CALCIUM mg SODIUM mg IRON mg KCAL cheese krunches 3 25 7 0 390 0 175 chee zees corn snacks 3 22 16 0 300 0 244 big foot corn snack 1 11 6 0 205 0 102 sandwich cookies 2 24 7 0 80 0 171.5 soda 0 36 0 0 0 0 144 pine apple juice drink 0 27 0 0 0 0 108 fruit punch 0 23 0 0 0 0 92 cherry fruit drink 0 36 0 0 0 0 144
  • 36.
    Table 2 :Percentage Contribution of Food Items in the Lunch Boxes of 4-year-old Inner City Basic School Children in Ten Schools FOOD ITEM NUMBER OF CHILDREN OBSERVED (103) PERCENT FRUIT 6 6 CHIPS 40 39 BAKED PRODUCTS 40 39 CHEESE TRIX TYPE 44 43 DRINK SODA 20 19 FRUIT JUICE/DRINK 87 85
  • 37.
    Table 3: MacroNutrient and Kilocalories in Snacks Consumed by 4-year-old Basic School Children in Ten Inner City Schools at Break Time SCHOOL (Number of children) CONSUMED PROTEIN (G) Median (Range) CONSUMED CARBOHYDRATE(G) Median (Range) CONSUMED FAT(G) Median (Range) CONSUMED KILOCALORIES 1 (N=10) 2 (1-11.5) 45 (20-96) 6 (4-16) 265 (167-496.5) 2 (N=8) 0.5 (0-6) 34.5 (0-73) 5 (0-12) 189 (63-428.5)
  • 38.
    Table 4: MicroNutrient in Snacks Consumed by 4-year-old Inner City Basic School Children in ten schools at Break time SCHOOL (Number of children) CONSUMED CALCIUM Milligrams (Median Range) CONSUMED SODIUM Milligrams (Median Range) CONSUMED IRON Milligrams (Median Range) 1 (N=10) 0 (0- 280) 183 (0-273) 0 0 2 (N=8) 0 (0-14) 147.5 (0-273) 0 0 3 (N=9) 0 0 100 (0-205) 0 0 4 (N=9) 0 0 150 (0-390) 0 0
  • 39.
    Table 5: MacroNutrient and Kilocalorie Content of Snacks Brought to School and Consumed by 4-year-old Inner City Basic School Children in ten schools at Break Time BROUGHT TO SCHOOL TOTAL PROTEIN grams Median Range TOTAL CARBOHYDRATE grams Median Range TOTAL FAT grams Median (Range) TOTAL KILOCALORIES IN LUNCHBOX grams Median (Range) 3 55 10 329 (0-19) (15-144) (10-75) (140-1006) CONSUMED CONSUMED PROTEIN grams Median (Range) CONSUMED CARBOHYDRATE grams Median (Range) CONSUMED FAT grams Median (Range) CONSUMED TOTAL KILOCALORIES Median (Range) 1.5 42 6 220 (0-11.5) (0-113) (0-45.5) (0-697)
  • 40.
    Table 6- ThePercentage of the R.D.A's of Protein, Micro Nutrients and Kilocalories Consumed in the Snacks taken to school in the Lunch Box of the 4-year-old of Inner City Basic School Children in Ten Schools REQIIRED PROTEIN mg REQUIRED CALCIUM mg REQUIRED SODIUM mg REQUIRED IRON mg REQUIRED KILOCALORIE 21.5 500 300* 10 1712.5 %R.D.A PROTIEN CONSUMED (milligrams) Median (Range) %R.D.A. CALCIUM CONSUMED (milligrams) Median (Range) %R.D.A. SODIUM CONSUMED (milligrams) Median (Range) % R.D.A. IRON CONSUMED (milligrams) Median (Range) % R.D.A. KILOCALORIE CONSUMED (milligrams) Median (Range) 6.7 0 55 0 13 (0-53.5) (0-56) (0-143) (0-11) (0-410)
  • 41.
    Findings  The mostpopular food items were commercially prepared fruit drinks, chips and baked products such as biscuits or crackers.  Very few fruits and no vegetables were consumed by the children  Salty snack items such as chips or cheese trix were popular.
  • 42.
  • 43.
    Findings  preschool childrensnack on foods high in calories but low in protein and micronutrients  the pattern of consumption is not consistent with dietary guidelines e.g Recommended Dietary Allowances and has implications for children’s health and well being
  • 44.
    These food consumptionpatterns may lead to under nutrition (characterized by stunting)  Failure to thrive  Impaired mental development  Emotional issues  Behavioral problems  Poor performance in school  Inter - generational poverty .
  • 45.
    Findings Empty calorie foods(high in calories and low in vitamins and minerals) were popular in lunch boxes Implications:  Obesity increasing the burden of disease  High rates of non communicable diseases  Diabetes, hypertension, cancer, heart disease  Disability and death
  • 46.
    Recommendations  Dietary guidelinesgiven to parents and care givers should stress the importance of meeting the special nutritional needs of preschool children
  • 47.
    Recommendations  Increase theawareness of parents, teachers and care givers about the impact of early food choices on the eating habits of children over time.  Policy guidelines which indicate the nutrient content of school meals should be formulated to improve the diet of school children since they spend several hours a day in school.
  • 48.
  • 49.
    References 1. Retrieved March19, (2010) World Health Organisation (WHO) 10 facts on nutrition.http:// www. who.int/ features/act/files/nutrition/facts/en/index.html. 2. Fox M. K, Dodd A.H., Wilson A., Gleason P.M, (2009) Association between School Food Environment and Practices and Body Mass Index of U.S. Public School Children: Journal of American Dietetic Association, Supplement 1, Vol. 109.#2, S108-S117.2. 3. Grantham – McGregor S., Cheng Y.B.(2007) Child Development in Developing Countries: Developmental Potential in the first 5 years for children in developing countries. The Lancet Vol.369#9555:60-70. 4. Engle P.L.,Black M., Behrman J.r., Cabral de Mello M.,Gertler P.J.,Kapririri L., Martorell R., Young M.E.,and the International Child Development Steering Committee:(2007) Child Development in Developing Countries 3:Strategies to avoid loss of developmental potential more than 200 million children in the developing world. The Lancet .vol.369 num.9557.229-242. 5. U S National Centre for Statistics and Growth References
  • 50.
    References 6. World HealthOrganization official website 7. Grantham – McGregor S., Cheng Y.B.(2007) Child Development in Developing Countries: Developmental Potential in the first 5 years for children in developing countries. The Lancet Vol.369#9555:60-70. 8. Devaney B., Ziegler P., Pac S., Karwe V., Barr S. (2004) Feeding Infants and Toddlers Study: Meals, Snack and Beverage Patterns of Infants and Toddlers. Journal of American Dietetics Association.Vol.104/Num.1 Suppl.1 9. Early Childhood Commission (2006): The Development and Implementation of a Nutrition Programme for Early Childhood Institutions in St. Mary, Jamaica 10. Planning Institute of Jamaica (2002) Survey of Living Conditions. 11. Planning Institute of Jamaica (2002) Survey of Living Conditions