SlideShare a Scribd company logo
1 of 6
Download to read offline
Public Health Nutrition: page 1 of 6 doi:10.1017/S1368980010003599
Changes in meal pattern among Norwegian children from
2001 to 2008
Nina Øverby1,
*, Tonje H Stea1
, Frøydis N Vik1
, Knut-Inge Klepp2
and Elling Bere1
1
Department of Public Health, Sport and Nutrition, Faculty of Health and Sport, University of Agder,
PO Box 422, 4604 Kristiansand, Norway: 2
Department of Nutrition, Faculty of Medicine,
University of Oslo, Oslo, Norway
Submitted 13 April 2010: Accepted 18 November 2010
Abstract
Objective: The present study aimed to analyse changes in meal pattern among
Norwegian children from 2001 to 2008 in general; to analyse associations between
meal pattern and gender, parental educational level and number of parents in the
household; and to analyse the association between intake of unhealthy snacks,
meal pattern and the mentioned variables.
Design: Within the Fruits and Vegetables Make the Marks (FVMM) project, two
cross-sectional studies were conducted, one in 2001 and one in 2008, where
participants from the same schools filled in a questionnaire on meals eaten the
previous day.
Subjects: Participants were 6th and 7th grade pupils, n 1488 in 2001 and n 1339
in 2008.
Setting: Twenty-seven elementary schools in two Norwegian counties.
Results: There were no significant changes in children’s meal pattern from 2001 to
2008. For both years more than 90 % of the participants reported that they had
breakfast yesterday, while 95 % had lunch, 94 % had dinner and 82 % had supper.
More girls than boys reported that they had lunch yesterday (96 % v. 94 %,
P 5 0?03). More children with higher v. lower educated parents reported that they
had breakfast yesterday (93 % v. 88 %, P , 0?001). More children living with two
parents v. one parent had breakfast (93 % v. 88 %, P 5 0?001) and lunch yesterday
(97 % v. 93 %, P , 0?001).
Conclusions: There were no changes in meal pattern from 2001 to 2008 among
Norwegian children. Characteristics associated with skipping meals were living in
a one-parent family and having lower educated parents.
Keywords
Breakfast
Cohort
Children
Meal pattern
In recent years there has been an increased focus on meal
pattern among children and adolescents(1–4)
. First, there
has been much interest in meal pattern in relation to
health status(1)
. Special attention has been given to the
importance of eating breakfast, which has been asso-
ciated with a multitude of positive health benefits, espe-
cially an association with body weight. Breakfast skipping
among young people has been shown to be associated
with an increased likelihood of being overweight or
obese(5–8)
and having higher BMI(9,10)
. A recently published
study among Norwegian children showed increased odds of
being overweight when fewer than four meals were eaten
the previous day(11)
.
Second, studies from the 1980s to today have described
a distinct change in meal pattern in children and ado-
lescents, more than observed in the adult popula-
tion(2,3,12)
. These changes vary widely from one region to
the other(12)
. Generally, information about children’s and
adolescents’ meal frequency is scarce. However, in Europe
an increased prevalence of irregular meal patterns has
been reported. In Norway it has been reported that 15 %
of healthy children and adolescents skip breakfast and
30 % skip lunch twice weekly or more(13)
. In the USA the
prominent trend is an increase in snacking events
between meals(12)
.
A third focus on meal pattern has concerned the
importance of how and with whom meals are eaten.
Family meals (eating together as a family with one or two
parents present) appear to be associated with a variety of
positive health behaviours in childhood and adoles-
cence(14)
. An American 10-year longitudinal study of
black and white girls aged 9–19 years suggested that
eating together as a family during childhood may have
multiple health benefits in later years, such as fewer
eating disorders, lower alcohol and tobacco consumption
and less extreme weight-control behaviours(15)
.
Knowing the probable health benefits of having regular
meals and that eating patterns established during adolescence
SPublicHealthNutrition
*Corresponding author: Email nina.c.overby@uia.no r The Authors 2011
shape diet later in life(16)
, an analysis of changes in meal
pattern and factors associated with meal patterns in
children is important. In Norway breakfast is usually
sandwiches or cereals, school lunch is usually packed
sandwiches, while dinner is a hot meal, and supper is
often sandwiches or cereals. Many Norwegians have
supper, most probably because they have an early dinner
(16.00–18.00 hours) which is not all common in other
European countries(17)
.
The present study aimed to analyse changes in meal
pattern in Norwegian children from 2001 to 2008 in
general; to analyse associations between meal pattern and
gender, parental educational level and number of parents
in the household; and to analyse the association between
intake of unhealthy snacks, meal pattern and the men-
tioned variables.
Methods
Sample and procedure
The current study is a part of the Fruits and Vegetables
Make the Marks (FVMM) project. In 2001, forty-eight
schools from Hedmark and Telemark counties (twenty-
four schools in each county) were randomly selected and
invited to participate in the project FVMM, and thirty-eight
agreed to participate. All 6th and 7th graders (age 10–12
years) in these thirty-eight schools were invited to take
part in a questionnaire survey. These thirty-eight schools
were contacted again in 2008, and were invited to parti-
cipate once more in a similar survey. At that time twenty-
seven schools agreed to participate, and all 6th and 7th
graders in these twenty-seven schools were invited to
participate. Pupils from the twenty-seven schools, from
both 2001 and 2008, constitute the study sample of the
present study (Table 1)(18)
. Further details on the sam-
pling process are available elsewhere(18)
. Eleven schools
that participated in 2001 did not participate in 2008. In
a previously reported attrition analysis, no significant
differences between the present study sample from the
twenty-seven schools participating in both the 2001 and
2008 surveys and pupils at the eleven schools that parti-
cipated in 2001 but not in 2008 were observed regarding
sex, parental education level, and fruit and vegetable
intake at school and all day(18)
.
During both data collections (in 2001 and 2008), the
same questionnaire was completed by the children in the
presence of a trained project worker in the classroom.
One school lesson (45 min) was used to complete the
questionnaire. The present study sample includes in total
2827 children (1488 in 2001 and 1339 children in 2008)
out of 3439 eligible (participation rate 82?2 %). The main
reason why children did not participate in the study was
absence from school on the survey day. The participation
rates for parents were 83 % in 2001 and 74 % in 2008
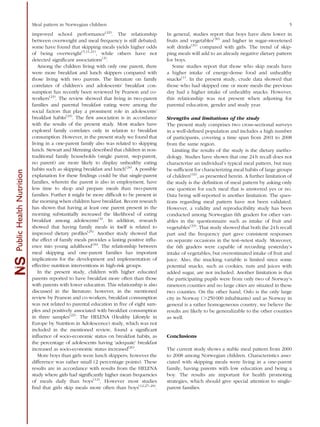
(Table 1). Table 1 gives a description of the participants
and shows that there were no differences in numbers
living with one parent between 2001 and 2008. The par-
ents participating in 2008 had higher education than those
participating in 2001 (P , 0?001; Table 1). This is similar
to what has been seen in Norway in general during the
past 10 years; that there is an increased part of the
population having high education(19)
.
Research clearance was obtained from the Norwegian
Social Science Data Services. Written informed consent
was obtained from parents and children prior to partici-
pation in the study.
The questionnaire included questions about meals
wherein the participants were asked if they had breakfast,
lunch, dinner or supper the previous day. The question
was answered ‘yes’ or ‘no’. A sum score was made
including if they had breakfast, lunch, dinner or supper
yesterday, ranging from 0 to 4 meals yesterday. This was
further dichotomized into having fewer than 4 meals per
day and having 4 meals per day. This variable is called ‘all
meals’. Another sum score of unhealthy snacks was made
from the following three items from an FFQ: ‘How often
do you drink soda (including sugar)?’, ‘How often do you
eat candy (e.g. chocolate, mixed candy)’ and ‘How often
do you eat potato chips?’ All items had ten response
alternatives (‘never’, ‘less than once a week’, ‘once a
week’, ‘twice a week’, y, ‘six times a week’, ‘every day’,
‘several times every day’), and they were scored (0, 0?5, 1,
2, y, 6, 7, 10), giving the unhealthy snack scale a range
from 0 to 30 times/week.
Further, the children filled in questions about gender
and number of parents in the household. Number of par-
ents in the household was assessed by: ‘Tick the alternative
showing the persons living at home with you’. Response
alternatives were mother, father, stepmother and step-
father. Participants could tick more than one alternative if
they lived with two parents. If parents were separated, the
participants were supposed to tick the alternative showing
the parent they live with most of the time. All responses
were added and, eventually, dichotomized into living with
one parent or living with two parents. Parental educational
level was assessed individually in a questionnaire filled in
by the parents, with one question: ‘What level of education
do you have?’ The question had four response alternatives:
‘elementary school’, ‘high school’, ‘college or university’
(3 years or less) and ‘college or university’ (more than 3
years). This variable was dichotomized into lower (no
college or university education) and higher (having
attended college or university).
Statistical analysis
Differences in gender, parental education, number of
parents in the household and meal pattern between 2001
and 2008 were analysed by x2
tests (Table 1). Crude and
adjusted data were analysed by different multilevel linear-
mixed models with breakfast, lunch, dinner, supper and
SPublicHealthNutrition
2 N Øverby et al.
all meals as the dependent variables. Crude results are only
commented upon in the text (data not shown in any table).
Relevant confounders were chosen according to the litera-
ture, and all adjusted models (Table 2) included gender,
parental education, number of parents in the household,
time of data collection and grade. In all adjusted models the
following interaction terms were included: time3gender,
time3parental education and time 3number of parents in
the household. This was done to assess possible interaction
between time and the examined variables. Results presented
in the text regarding unhealthy snacks (data not shown in
any table) were analysed by a multilevel linear-mixed model
with unhealthy snacks as the dependent variable, and
adjusted for all meals, gender, parental education, number
of parents in the household, time of data collection and
grade. All models were also adjusted for school as a random
effect. Accepted significant level was set at P,0?05. All
statistical analyses were performed using the SPSS statistical
software package version 17?0 (SPSS Inc., Chicago, IL, USA).
Results
Results from the present study showed that there were no
significant changes in children’s meal pattern from 2001
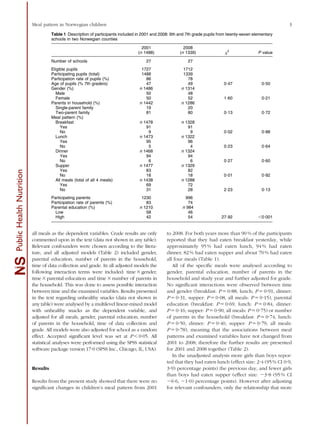
to 2008. For both years more than 90 % of the participants
reported that they had eaten breakfast yesterday, while
approximately 95 % had eaten lunch, 94 % had eaten
dinner, 82 % had eaten supper and about 70 % had eaten
all four meals (Table 1).
All of the specific meals were analysed according to
gender, parental education, number of parents in the
household and study year and further adjusted for grade.
No significant interactions were observed between time
and gender (breakfast: P 5 0?88, lunch; P 5 0?91, dinner:
P 5 0?31, supper: P 5 0?08, all meals: P 5 0?15), parental
education (breakfast: P 5 0?69, lunch: P 5 0?84, dinner:
P 5 0?16, supper: P 5 0?90, all meals: P 5 0?75) or number
of parents in the household (breakfast: P 5 0?74, lunch:
P 5 0?50, dinner: P 5 0?40, supper: P 5 0?79, all meals:
P 5 0?78), meaning that the associations between meal
patterns and examined variables have not changed from
2001 to 2008; therefore the further results are presented
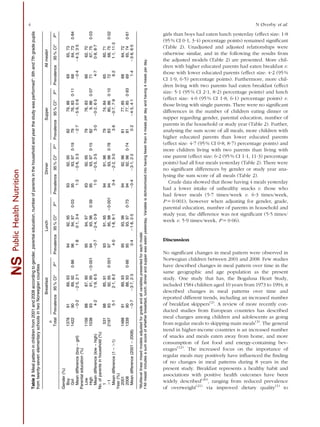
for 2001 and 2008 together (Table 2).
In the unadjusted analysis more girls than boys repor-
ted that they had eaten lunch (effect size: 2?4 (95 % CI 0?9,
3?9) percentage points) the previous day, and fewer girls
than boys had eaten supper (effect size: 23?8 (95 % CI
26?6, 21?0) percentage points). However after adjusting
for relevant confounders, only the relationship that more
SPublicHealthNutrition
Table 1 Description of participants included in 2001 and 2008: 6th and 7th grade pupils from twenty-seven elementary
schools in two Norwegian counties
2001 2008
(n 1488) (n 1339) x2
P value
Number of schools 27 27
Eligible pupils 1727 1712
Participating pupils (total) 1488 1339
Participation rate of pupils (%) 86 78
Age of pupils (% 7th graders) 47 49 0?47 0?50
Gender (%) n 1486 n 1314
Male 50 48
Female 50 52 1?60 0?21
Parents in household (%) n 1442 n 1286
Single-parent family 19 20
Two-parent family 81 80 0?13 0?72
Meal pattern (%)
Breakfast n 1478 n 1328
Yes 91 91
No 9 9 0?02 0?88
Lunch n 1473 n 1322
Yes 95 96
No 5 4 0?23 0?64
Dinner n 1468 n 1324
Yes 94 94
No 6 6 0?27 0?60
Supper n 1477 n 1329
Yes 83 82
No 18 18 0?01 0?92
All meals (total of all 4 meals) n 1438 n 1288
Yes 69 72
No 31 28 2?23 0?13
Participating parents 1230 996
Participation rate of parents (%) 83 74
Parental education (%) n 1210 n 984
Low 58 46
High 42 54 27?92 ,0?001
Meal pattern in Norwegian children 3
girls than boys had eaten lunch yesterday (effect size: 1?8
(95 % CI 0?1, 3?4) percentage points) remained significant
(Table 2). Unadjusted and adjusted relationships were
otherwise similar, and in the following the results from
the adjusted models (Table 2) are presented. More chil-
dren with higher educated parents had eaten breakfast v.
those with lower educated parents (effect size: 4?2 (95 %
CI 1?9, 6?5) percentage points). Furthermore, more chil-
dren living with two parents had eaten breakfast (effect
size: 5?1 (95 % CI 2?1, 8?2) percentage points) and lunch
(effect size: 4?0 (95 % CI 1?8, 6?1) percentage points) v.
those living with single parents. There were no significant
differences in the number of children eating dinner or
supper regarding gender, parental education, number of
parents in the household or study year (Table 2). Further,
analysing the sum score of all meals, more children with
higher educated parents than lower educated parents
(effect size: 4?7 (95 % CI 0?8, 8?7) percentage points) and
more children living with two parents than living with
one parent (effect size: 6?2 (95 % CI 1?1, 11?3) percentage
points) had all four meals yesterday (Table 2). There were
no significant differences by gender or study year ana-
lysing the sum score of all meals (Table 2).
Crude data showed that those having 4 meals yesterday
had a lower intake of unhealthy snacks v. those who
had fewer meals (5?7 times/week v. 6?3 times/week,
P 5 0?001); however when adjusting for gender, grade,
parental education, number of parents in household and
study year, the difference was not significant (5?5 times/
week v. 5?9 times/week, P 5 0?06).
Discussion
No significant changes in meal pattern were observed in
Norwegian children between 2001 and 2008. Few studies
have described changes in meal pattern over time in the
same geographic and age population as the present
study. One study that has, the Bogalusa Heart Study,
included 1584 children aged 10 years from 1973 to 1994; it
described changes in meal patterns over time and
reported different trends, including an increased number
of breakfast skippers(2)
. A review of more recently con-
ducted studies from European countries has described
meal changes among children and adolescents as going
from regular meals to skipping main meals(3)
. The general
trend in higher-income countries is an increased number
of snacks and meals eaten away from home, and more
consumption of fast food and energy-containing bev-
erages(12)
. The increased focus on the importance of
regular meals may positively have influenced the finding
of no changes in meal patterns during 8 years in the
present study. Breakfast represents a healthy habit and
associations with positive health outcomes have been
widely described(20)
, ranging from reduced prevalence
of overweight(21)
via improved dietary quality(1)
to
SPublicHealthNutrition
Table2Mealpatterninchildrenfrom2001and2008accordingtogender,parentaleducation,numberofparentsinthehouseholdandyearthestudywasperformed*:6thand7thgradepupils
fromtwenty-sevenelementaryschoolsintwoNorwegiancounties
n
BreakfastLunchDinnerSupperAllmeals-
TotalPrevalence95%CI*P*Prevalence95%CI*P*Prevalence95%CI*P*Prevalence95%CI*P*Prevalence95%CI*P*
Gender(%)
Boy13789189,939492,959392,958279,866965,73
Girl14229089,920?869694,970?039593,970?197976,830?116864,730?84
Meandifference(boy–girl)20?222?5,2?11?80?1,3?41?320?6,3?322?725?9,0?620?424?3,3?5
Parentaleducation(%)
Low11568887,909594,979392,957976,836662,70
High10389391,95,0?0019493,960?399593,970?15829,860?077167,750?03
Meandifference(low–high)4?21?9,6?520?722?4,0?91?520?5,3?53?020?2,6?54?70?8,8?7
No.ofparentsinhousehold(%)
15318885,919391,959491,967974,846560,71
.121979392,950?0019795,98,0?0019493,960?788380,860?107268,750?02
Meandifference(1–.1)5?12?1,8?24?01?8,6?10?422?2,3?03?620?7,7?96?21?1,11?3
Year(%)
200114889189,939593,969492,968177,856864,72
200813399088,930?669593,970?739492,960?748177,850?936965,740?61
Meandifference(2001–2008)20?723?7,2?30?421?8,2?520?423?1,2?20?224?5,4?11?423?8,6?5
*Multilevellinearmixedmodelsadjustedforgradeandallvariablespresentedforeachmodel.
-’Allmeals’includesasumscoreofwhetherbreakfast,lunch,dinnerandsupperwaseatenyesterday.Variableisdichotomizedintohavingfewerthan4mealsperdayandhaving4mealsperday.
4 N Øverby et al.
improved school performance(22)
. The relationship
between overweight and meal frequency is still debated;
some have found that skipping meals yields higher odds
of being overweight(5,11,21)
, while others have not
detected significant associations(2)
.
Among the children living with only one parent, there
were more breakfast and lunch skippers compared with
those living with two parents. The literature on family
correlates of children’s and adolescents’ breakfast con-
sumption has recently been reviewed by Pearson and co-
workers(23)
. The review showed that living in two-parent
families and parental breakfast eating were among the
social factors that play a prominent role in adolescents’
breakfast habits(23)
. The first association is in accordance
with the results of the present study. Most studies have
explored family correlates only in relation to breakfast
consumption. However, in the present study we found that
living in a one-parent family also was related to skipping
lunch. Stewart and Menning described that children in non-
traditional family households (single parent, step-parent,
no parent) are more likely to display unhealthy eating
habits such as skipping breakfast and lunch(24)
. A possible
explanation for these findings could be that single-parent
families, wherein the parent is also in employment, have
less time to shop and prepare meals than two-parent
families. Further it might be more difficult to be present in
the morning when children have breakfast. Recent research
has shown that having at least one parent present in the
morning substantially increased the likelihood of eating
breakfast among adolescents(4)
. In addition, research
showed that having family meals in itself is related to
improved dietary profiles(25)
. Another study showed that
the effect of family meals provides a lasting positive influ-
ence into young adulthood(16)
. The relationship between
meal skipping and one-parent families has important
implications for the development and implementation of
effective nutrition interventions in high-risk groups.
In the present study, children with higher educated
parents reported to have breakfast more often than those
with parents with lower education. This relationship is also
discussed in the literature; however, in the mentioned
review by Pearson and co-workers, breakfast consumption
was not related to parental education in five of eight sam-
ples and positively associated with breakfast consumption
in three samples(23)
. The HELENA (Healthy Lifestyle in
Europe by Nutrition in Adolescence) study, which was not
included in the mentioned review, found a significant
influence of socio-economic status on breakfast habits, as
the percentage of adolescents having ‘adequate’ breakfast
increased as socio-economic status increased(26)
.
More boys than girls were lunch skippers; however the
difference was rather small (2 percentage points). These
results are in accordance with results from the HELENA
study where girls had significantly higher mean frequencies
of meals daily than boys(12)
. However most studies
find that girls skip meals more often than boys(12,27–29)
.
In general, studies report that boys have diets lower in
fruits and vegetables(30)
and higher in sugar-sweetened
soft drinks(31)
compared with girls. The trend of skip-
ping meals will add to an already negative dietary pattern
for boys.
Some studies report that those who skip meals have
a higher intake of energy-dense food and unhealthy
snacks(1)
. In the present study, crude data showed that
those who had skipped one or more meals the previous
day had a higher intake of unhealthy snacks. However,
this relationship was not present when adjusting for
parental education, gender and study year.
Strengths and limitations of the study
The present study comprises two cross-sectional surveys
in a well-defined population and includes a high number
of participants, covering a time span from 2001 to 2008
from the same region.
Limiting the results of the study is the dietary metho-
dology. Studies have shown that one 24 h recall does not
characterize an individual’s typical meal pattern, but may
be sufficient for characterizing meal habits of large groups
of children(32)
, as presented herein. A further limitation of
the study is the definition of meal pattern by asking only
one question for each meal that is answered yes or no.
Data being self-reported is another limitation. The ques-
tions regarding meal pattern have not been validated.
However, a validity and reproducibility study has been
conducted among Norwegian 6th graders for other vari-
ables in the questionnaire such as intake of fruit and
vegetables(33)
. That study showed that both the 24 h recall
part and the frequency part gave consistent responses
on separate occasions in the test–retest study. Moreover,
the 6th graders were capable of recording yesterday’s
intake of vegetables, but overestimated intake of fruit and
juice. Also, the snacking variable is limited since some
potential snacks, such as cookies, nuts and juices with
added sugar, are not included. Another limitation is that
the participating pupils were from only two of Norway’s
nineteen counties and no large cities are situated in these
two counties. On the other hand, Oslo is the only large
city in Norway (.250 000 inhabitants) and as Norway in
general is a rather homogeneous country, we believe the
results are likely to be generalizable to the other counties
as well.
Conclusions
The current study shows a stable meal pattern from 2000
to 2008 among Norwegian children. Characteristics asso-
ciated with skipping meals were living in a one-parent
family, having parents with low education and being a
boy. The results are important for health promoting
strategies, which should give special attention to single-
parent families.
SPublicHealthNutrition Meal pattern in Norwegian children 5
Acknowledgements
The FVMM project is funded by the Research Council of
Norway. The authors declare that they have no compet-
ing interests. K.-I.K. conceived the FVMM project. E.B.
and K-I.K. designed the present study. N.Ø., T.H.S. and
E.B. analysed and interpreted the data. N.Ø., T.H.S. and
F.N.V. drafted the manuscript, and E.B. and K.-I.K. revised
it critically. All authors have approved the final version of
the manuscript.
References
1. Rampersaud GC, Pereira MA, Girard BL et al. (2005)
Breakfast habits, nutritional status, body weight, and
academic performance in children and adolescents. J Am
Diet Assoc 105, 743–760.
2. Nicklas TA, Morales M, Linares A et al. (2004) Children’s
meal patterns have changed over a 21-year period: the
Bogalusa Heart Study. J Am Diet Assoc 104, 753–761.
3. Samuelson G (2000) Dietary habits and nutritional status in
adolescents over Europe. An overview of current studies in
the Nordic countries. Eur J Clin Nutr 54, Suppl. 1, S21–S28.
4. Merten MJ, Williams AL & Shriver LH (2009) Breakfast
consumption in adolescence and young adulthood: par-
ental presence, community context, and obesity. J Am Diet
Assoc 109, 1384–1391.
5. Andersen LF, Lillegaard IT, Overby N et al. (2005) Over-
weight and obesity among Norwegian schoolchildren:
changes from 1993 to 2000. Scand J Public Health 33,
99–106.
6. Croezen S, Visscher TL, Ter Bogt NC et al. (2009) Skipping
breakfast, alcohol consumption and physical inactivity as
risk factors for overweight and obesity in adolescents:
results of the E-MOVO project. Eur J Clin Nutr 63, 405–412.
7. Dubois L, Girard M & Potvin KM (2006) Breakfast eating
and overweight in a pre-school population: is there a link?
Public Health Nutr 9, 436–442.
8. Groholt EK, Stigum H & Nordhagen R (2008) Overweight
and obesity among adolescents in Norway: cultural and
socio-economic differences. J Public Health (Oxf) 30,
258–265.
9. Barton BA, Eldridge AL, Thompson D et al. (2005) The
relationship of breakfast and cereal consumption to
nutrient intake and body mass index: the National Heart,
Lung, and Blood Institute Growth and Health Study. J Am
Diet Assoc 105, 1383–1389.
10. Delva J, Johnston LD & O’Malley PM (2007) The
epidemiology of overweight and related lifestyle behaviors:
racial/ethnic and socioeconomic status differences among
American youth. Am J Prev Med 33, 4 Suppl., S178–S186.
11. Vik FN, Øverby NC, Lien N et al. (2010) Number of meals
eaten in relation to weight status among Norwegian
adolescents. Scand J Public Health 38, Suppl. 5, 13–18.
12. Moreno LA, Rodriguez G, Fleta J et al. (2010) Trends of
dietary habits in adolescents. Crit Rev Food Sci Nutr 50,
106–112.
13. Overby NC, Margeirsdottir HD, Brunborg C et al. (2008)
Sweets, snacking habits, and skipping meals in children
and adolescents on intensive insulin treatment. Pediatr
Diabetes 9, 393–400.
14. Mamun AA, Lawlor DA, O’Callaghan MJ et al. (2005)
Positive maternal attitude to the family eating together
decreases the risk of adolescent overweight. Obes Res 13,
1422–1430.
15. Franko DL, Thompson D, Affenito SG et al. (2008) What
mediates the relationship between family meals and
adolescent health issues? Health Psychol 27, 2 Suppl.,
S109–S117.
16. Larson NI, Neumark-Sztainer D, Hannan PJ et al. (2007)
Family meals during adolescence are associated with
higher diet quality and healthful meal patterns during
young adulthood. J Am Diet Assoc 107, 1502–1510.
17. Nordic Council of Ministers (2004) Eating pattern. In Nordic
Nutrition Recommendations 2004: Integrating Nutrition
and Physical Activity, pp. 85–101. Copenhagen: Nordic
Council of Ministers.
18. Bere E, Hilsen N & Klepp K-I (2010) Effect of the
nationwide free school fruit scheme in Norway. Br J Nutr
104, 589–594.
19. Statistics Norway (2010) Education statistics. Students
at universities and colleges, 1 October 2009. http://
www.ssb.no/english/subjects/04/02/40/utuvh_en/ (accessed
December 2010).
20. Agostoni C & Brighenti F (2010) Dietary choices for
breakfast in children and adolescents. Crit Rev Food Sci
Nutr 50, 120–128.
21. Wurbach A, Zellner K & Kromeyer-Hauschild K (2009)
Meal patterns among children and adolescents and their
associations with weight status and parental characteristics.
Public Health Nutr 12, 1115–1121.
22. Hoyland A, Dye L & Lawton CL (2009) A systematic review
of the effect of breakfast on the cognitive performance of
children and adolescents. Nutr Res Rev 22, 220–243.
23. Pearson N, Biddle SJ & Gorely T (2009) Family correlates of
breakfast consumption among children and adolescents. A
systematic review. Appetite 52, 1–7.
24. Stewart SD & Menning CL (2009) Family structure,
nonresident father involvement, and adolescent eating
patterns. J Adolesc Health 45, 193–201.
25. Neumark-Sztainer D, Hannan PJ, Story M et al. (2003)
Family meal patterns: associations with sociodemographic
characteristics and improved dietary intake among adoles-
cents. J Am Diet Assoc 103, 317–322.
26. Moreno LA, Kersting M, de Henauw S et al. (2005) How to
measure dietary intake and food habits in adolescence: the
European perspective. Int J Obes (Lond) 29, Suppl. 2,
S66–S77.
27. Story M, Neumark-Sztainer D & French S (2002) Individual
and environmental influences on adolescent eating beha-
viors. J Am Diet Assoc 102, 3 Suppl., S40–S51.
28. Sjoberg A, Hallberg L, Hoglund D et al. (2003) Meal
pattern, food choice, nutrient intake and lifestyle factors in
The Goteborg Adolescence Study. Eur J Clin Nutr 57,
1569–1578.
29. Siega-Riz AM, Popkin BM & Carson T (1998) Trends in
breakfast consumption for children in the United States
from 1965–1991. Am J Clin Nutr 67, 748S–756S.
30. Rasmussen M, Krolner R, Klepp KI et al. (2006) Determi-
nants of fruit and vegetable consumption among children
and adolescents: a review of the literature. Part I:
Quantitative studies. Int J Behav Nutr Phys Act 3, 22.
31. Bere E, Glomnes ES, te Velde SJ et al. (2008) Determinants
of adolescents’ soft drink consumption. Public Health Nutr
11, 49–56.
32. Thompson FE & Byers T (1994) Dietary assessment
resource manual. J Nutr 124, 11 Suppl., 2245S–2317S.
33. Andersen LF, Bere E, Kolbjornsen N et al. (2004) Validity
and reproducibility of self-reported intake of fruit and
vegetable among 6th graders. Eur J Clin Nutr 58, 771–777.
SPublicHealthNutrition
6 N Øverby et al.

More Related Content

What's hot

Childhood obesity treatment literature review
Childhood obesity treatment literature reviewChildhood obesity treatment literature review
Childhood obesity treatment literature reviewAmber Breidel
 
Nutritional Status of School Age Children in Private Elementary Schools: Basi...
Nutritional Status of School Age Children in Private Elementary Schools: Basi...Nutritional Status of School Age Children in Private Elementary Schools: Basi...
Nutritional Status of School Age Children in Private Elementary Schools: Basi...IJAEMSJORNAL
 
PlacematProtocolvalidation
PlacematProtocolvalidationPlacematProtocolvalidation
PlacematProtocolvalidationNicole Tung
 
Media exposure and dietary intake
Media exposure and dietary intakeMedia exposure and dietary intake
Media exposure and dietary intakeJulia Lipowski
 
Effect of Mothers Working and Non Working Status on the Nutritional Status of...
Effect of Mothers Working and Non Working Status on the Nutritional Status of...Effect of Mothers Working and Non Working Status on the Nutritional Status of...
Effect of Mothers Working and Non Working Status on the Nutritional Status of...YogeshIJTSRD
 
6 Week Sport-Based Healthy Eating Intervention for Year 6 Students in Barnsta...
6 Week Sport-Based Healthy Eating Intervention for Year 6 Students in Barnsta...6 Week Sport-Based Healthy Eating Intervention for Year 6 Students in Barnsta...
6 Week Sport-Based Healthy Eating Intervention for Year 6 Students in Barnsta...Tom Lake
 
Risk resilience child development-results from Jamaican birth cohort studies
Risk resilience child development-results from Jamaican birth cohort studies Risk resilience child development-results from Jamaican birth cohort studies
Risk resilience child development-results from Jamaican birth cohort studies UNICEF Office of Research - Innocenti
 
Aene project a medium city public students obesity study
Aene project   a medium city public students obesity studyAene project   a medium city public students obesity study
Aene project a medium city public students obesity studyCIRINEU COSTA
 
Nutrition Intervention Prog Lit Review
Nutrition Intervention Prog Lit ReviewNutrition Intervention Prog Lit Review
Nutrition Intervention Prog Lit ReviewJordyn Wheeler
 
Nutrition for Children
Nutrition for ChildrenNutrition for Children
Nutrition for ChildrenKorina Calbay
 
PeirisLUCEFinalVersion1
PeirisLUCEFinalVersion1PeirisLUCEFinalVersion1
PeirisLUCEFinalVersion1Ama Peiris
 
Nutritional Status and Dietary Habits of Preschool Children
Nutritional Status and Dietary Habits of Preschool ChildrenNutritional Status and Dietary Habits of Preschool Children
Nutritional Status and Dietary Habits of Preschool Childreninventionjournals
 
28795-182335-1-PB
28795-182335-1-PB28795-182335-1-PB
28795-182335-1-PBMira Prinz
 
NTFS - Chapter 1 Methodology
NTFS - Chapter 1 MethodologyNTFS - Chapter 1 Methodology
NTFS - Chapter 1 MethodologyLBG
 
Factors Associated with Growth in the First 1,000 Days CHECKLEY
Factors Associated with Growth in the First 1,000 Days CHECKLEYFactors Associated with Growth in the First 1,000 Days CHECKLEY
Factors Associated with Growth in the First 1,000 Days CHECKLEYCORE Group
 
Study On Nutritional Status Of 5-10 Years Childrens in Magway ,Phoe ThantZin...
Study On Nutritional Status Of  5-10 Years Childrens in Magway ,Phoe ThantZin...Study On Nutritional Status Of  5-10 Years Childrens in Magway ,Phoe ThantZin...
Study On Nutritional Status Of 5-10 Years Childrens in Magway ,Phoe ThantZin...Ye Thein
 
Prevalence of malnutrition_and_associated_factors_
Prevalence of malnutrition_and_associated_factors_Prevalence of malnutrition_and_associated_factors_
Prevalence of malnutrition_and_associated_factors_AmanualNuredin
 
Snacking and its effect on nutritional status of adolescents in two
Snacking and its effect on nutritional status of adolescents in twoSnacking and its effect on nutritional status of adolescents in two
Snacking and its effect on nutritional status of adolescents in twoAlexander Decker
 

What's hot (20)

Childhood obesity treatment literature review
Childhood obesity treatment literature reviewChildhood obesity treatment literature review
Childhood obesity treatment literature review
 
Nutritional Status of School Age Children in Private Elementary Schools: Basi...
Nutritional Status of School Age Children in Private Elementary Schools: Basi...Nutritional Status of School Age Children in Private Elementary Schools: Basi...
Nutritional Status of School Age Children in Private Elementary Schools: Basi...
 
PlacematProtocolvalidation
PlacematProtocolvalidationPlacematProtocolvalidation
PlacematProtocolvalidation
 
Media exposure and dietary intake
Media exposure and dietary intakeMedia exposure and dietary intake
Media exposure and dietary intake
 
Effect of Mothers Working and Non Working Status on the Nutritional Status of...
Effect of Mothers Working and Non Working Status on the Nutritional Status of...Effect of Mothers Working and Non Working Status on the Nutritional Status of...
Effect of Mothers Working and Non Working Status on the Nutritional Status of...
 
6 Week Sport-Based Healthy Eating Intervention for Year 6 Students in Barnsta...
6 Week Sport-Based Healthy Eating Intervention for Year 6 Students in Barnsta...6 Week Sport-Based Healthy Eating Intervention for Year 6 Students in Barnsta...
6 Week Sport-Based Healthy Eating Intervention for Year 6 Students in Barnsta...
 
Risk resilience child development-results from Jamaican birth cohort studies
Risk resilience child development-results from Jamaican birth cohort studies Risk resilience child development-results from Jamaican birth cohort studies
Risk resilience child development-results from Jamaican birth cohort studies
 
Aene project a medium city public students obesity study
Aene project   a medium city public students obesity studyAene project   a medium city public students obesity study
Aene project a medium city public students obesity study
 
Nutrition Intervention Prog Lit Review
Nutrition Intervention Prog Lit ReviewNutrition Intervention Prog Lit Review
Nutrition Intervention Prog Lit Review
 
Nutrition for Children
Nutrition for ChildrenNutrition for Children
Nutrition for Children
 
PeirisLUCEFinalVersion1
PeirisLUCEFinalVersion1PeirisLUCEFinalVersion1
PeirisLUCEFinalVersion1
 
Nutritional Status and Dietary Habits of Preschool Children
Nutritional Status and Dietary Habits of Preschool ChildrenNutritional Status and Dietary Habits of Preschool Children
Nutritional Status and Dietary Habits of Preschool Children
 
Undergraduate Research
Undergraduate ResearchUndergraduate Research
Undergraduate Research
 
28795-182335-1-PB
28795-182335-1-PB28795-182335-1-PB
28795-182335-1-PB
 
NTFS - Chapter 1 Methodology
NTFS - Chapter 1 MethodologyNTFS - Chapter 1 Methodology
NTFS - Chapter 1 Methodology
 
Factors Associated with Growth in the First 1,000 Days CHECKLEY
Factors Associated with Growth in the First 1,000 Days CHECKLEYFactors Associated with Growth in the First 1,000 Days CHECKLEY
Factors Associated with Growth in the First 1,000 Days CHECKLEY
 
Relation between Changing Lifestyle and Adolescent Obesity in India: A Commun...
Relation between Changing Lifestyle and Adolescent Obesity in India: A Commun...Relation between Changing Lifestyle and Adolescent Obesity in India: A Commun...
Relation between Changing Lifestyle and Adolescent Obesity in India: A Commun...
 
Study On Nutritional Status Of 5-10 Years Childrens in Magway ,Phoe ThantZin...
Study On Nutritional Status Of  5-10 Years Childrens in Magway ,Phoe ThantZin...Study On Nutritional Status Of  5-10 Years Childrens in Magway ,Phoe ThantZin...
Study On Nutritional Status Of 5-10 Years Childrens in Magway ,Phoe ThantZin...
 
Prevalence of malnutrition_and_associated_factors_
Prevalence of malnutrition_and_associated_factors_Prevalence of malnutrition_and_associated_factors_
Prevalence of malnutrition_and_associated_factors_
 
Snacking and its effect on nutritional status of adolescents in two
Snacking and its effect on nutritional status of adolescents in twoSnacking and its effect on nutritional status of adolescents in two
Snacking and its effect on nutritional status of adolescents in two
 

Similar to A19

Determinants of children's nutritional status among primary
Determinants of children's nutritional status among primaryDeterminants of children's nutritional status among primary
Determinants of children's nutritional status among primaryAlexander Decker
 
Childhood obesity prevention literature review
Childhood obesity prevention literature reviewChildhood obesity prevention literature review
Childhood obesity prevention literature reviewAmber Breidel
 
Harrison_et_al-2015-Journal_of_Communication
Harrison_et_al-2015-Journal_of_CommunicationHarrison_et_al-2015-Journal_of_Communication
Harrison_et_al-2015-Journal_of_CommunicationNicole Tung
 
Prevalence of undernutrition and determinant factors among preschool children...
Prevalence of undernutrition and determinant factors among preschool children...Prevalence of undernutrition and determinant factors among preschool children...
Prevalence of undernutrition and determinant factors among preschool children...Alexander Decker
 
Running head LITERATURE REVIEW 1LITERATURE REVIEW 5.docx
Running head LITERATURE REVIEW 1LITERATURE REVIEW 5.docxRunning head LITERATURE REVIEW 1LITERATURE REVIEW 5.docx
Running head LITERATURE REVIEW 1LITERATURE REVIEW 5.docxcowinhelen
 
Nutritional Knowledge and Practices of Pre-School Teachers in Homa Bay County
Nutritional Knowledge and Practices of Pre-School Teachers in Homa Bay CountyNutritional Knowledge and Practices of Pre-School Teachers in Homa Bay County
Nutritional Knowledge and Practices of Pre-School Teachers in Homa Bay Countypaperpublications3
 
Eating Disorders, 19308–322, 2011Copyright © Taylor & Franc
Eating Disorders, 19308–322, 2011Copyright © Taylor & FrancEating Disorders, 19308–322, 2011Copyright © Taylor & Franc
Eating Disorders, 19308–322, 2011Copyright © Taylor & FrancEvonCanales257
 
Complete Advanced Nursing Discussion.docx
Complete Advanced Nursing Discussion.docxComplete Advanced Nursing Discussion.docx
Complete Advanced Nursing Discussion.docxwrite22
 
Complete Advanced Nursing Discussion.docx
Complete Advanced Nursing Discussion.docxComplete Advanced Nursing Discussion.docx
Complete Advanced Nursing Discussion.docxwrite22
 
Influence of Mothers’ Participation in Intra-Household Decision Making on Nut...
Influence of Mothers’ Participation in Intra-Household Decision Making on Nut...Influence of Mothers’ Participation in Intra-Household Decision Making on Nut...
Influence of Mothers’ Participation in Intra-Household Decision Making on Nut...Hudu Zakaria
 
Childhood Obesity Research Report
Childhood Obesity Research ReportChildhood Obesity Research Report
Childhood Obesity Research ReportGloriaDreamer
 
1· The precise goal of the study or experiment· The populati.docx
1· The precise goal of the study or experiment· The populati.docx1· The precise goal of the study or experiment· The populati.docx
1· The precise goal of the study or experiment· The populati.docxeugeniadean34240
 
Childhood Overweight and Obesity
Childhood Overweight and ObesityChildhood Overweight and Obesity
Childhood Overweight and ObesityNicolinaaa
 
Assessment of nutritional status of children in al hilla city
Assessment of nutritional status of children in al hilla cityAssessment of nutritional status of children in al hilla city
Assessment of nutritional status of children in al hilla cityAlexander Decker
 
A Conceptual Framework for Healthy Eating Behavior inEcuador.docx
A Conceptual Framework for Healthy Eating Behavior inEcuador.docxA Conceptual Framework for Healthy Eating Behavior inEcuador.docx
A Conceptual Framework for Healthy Eating Behavior inEcuador.docxevonnehoggarth79783
 
Sa'sha Moody - Systematic Review
Sa'sha Moody - Systematic ReviewSa'sha Moody - Systematic Review
Sa'sha Moody - Systematic ReviewSa'sha Moody
 
Factors influencing attitudes to foodss
Factors influencing attitudes to foodssFactors influencing attitudes to foodss
Factors influencing attitudes to foodsspeterkilcoyne
 
Psyc308 Presentation 2
Psyc308 Presentation 2Psyc308 Presentation 2
Psyc308 Presentation 2umbcpsych308
 

Similar to A19 (20)

Determinants of children's nutritional status among primary
Determinants of children's nutritional status among primaryDeterminants of children's nutritional status among primary
Determinants of children's nutritional status among primary
 
Childhood obesity prevention literature review
Childhood obesity prevention literature reviewChildhood obesity prevention literature review
Childhood obesity prevention literature review
 
Harrison_et_al-2015-Journal_of_Communication
Harrison_et_al-2015-Journal_of_CommunicationHarrison_et_al-2015-Journal_of_Communication
Harrison_et_al-2015-Journal_of_Communication
 
Prevalence of undernutrition and determinant factors among preschool children...
Prevalence of undernutrition and determinant factors among preschool children...Prevalence of undernutrition and determinant factors among preschool children...
Prevalence of undernutrition and determinant factors among preschool children...
 
Running head LITERATURE REVIEW 1LITERATURE REVIEW 5.docx
Running head LITERATURE REVIEW 1LITERATURE REVIEW 5.docxRunning head LITERATURE REVIEW 1LITERATURE REVIEW 5.docx
Running head LITERATURE REVIEW 1LITERATURE REVIEW 5.docx
 
Nutritional Knowledge and Practices of Pre-School Teachers in Homa Bay County
Nutritional Knowledge and Practices of Pre-School Teachers in Homa Bay CountyNutritional Knowledge and Practices of Pre-School Teachers in Homa Bay County
Nutritional Knowledge and Practices of Pre-School Teachers in Homa Bay County
 
Eating Disorders, 19308–322, 2011Copyright © Taylor & Franc
Eating Disorders, 19308–322, 2011Copyright © Taylor & FrancEating Disorders, 19308–322, 2011Copyright © Taylor & Franc
Eating Disorders, 19308–322, 2011Copyright © Taylor & Franc
 
Complete Advanced Nursing Discussion.docx
Complete Advanced Nursing Discussion.docxComplete Advanced Nursing Discussion.docx
Complete Advanced Nursing Discussion.docx
 
Complete Advanced Nursing Discussion.docx
Complete Advanced Nursing Discussion.docxComplete Advanced Nursing Discussion.docx
Complete Advanced Nursing Discussion.docx
 
Influence of Mothers’ Participation in Intra-Household Decision Making on Nut...
Influence of Mothers’ Participation in Intra-Household Decision Making on Nut...Influence of Mothers’ Participation in Intra-Household Decision Making on Nut...
Influence of Mothers’ Participation in Intra-Household Decision Making on Nut...
 
Childhood Obesity
Childhood ObesityChildhood Obesity
Childhood Obesity
 
Childhood Obesity Research Report
Childhood Obesity Research ReportChildhood Obesity Research Report
Childhood Obesity Research Report
 
Obesity 1
Obesity 1Obesity 1
Obesity 1
 
1· The precise goal of the study or experiment· The populati.docx
1· The precise goal of the study or experiment· The populati.docx1· The precise goal of the study or experiment· The populati.docx
1· The precise goal of the study or experiment· The populati.docx
 
Childhood Overweight and Obesity
Childhood Overweight and ObesityChildhood Overweight and Obesity
Childhood Overweight and Obesity
 
Assessment of nutritional status of children in al hilla city
Assessment of nutritional status of children in al hilla cityAssessment of nutritional status of children in al hilla city
Assessment of nutritional status of children in al hilla city
 
A Conceptual Framework for Healthy Eating Behavior inEcuador.docx
A Conceptual Framework for Healthy Eating Behavior inEcuador.docxA Conceptual Framework for Healthy Eating Behavior inEcuador.docx
A Conceptual Framework for Healthy Eating Behavior inEcuador.docx
 
Sa'sha Moody - Systematic Review
Sa'sha Moody - Systematic ReviewSa'sha Moody - Systematic Review
Sa'sha Moody - Systematic Review
 
Factors influencing attitudes to foodss
Factors influencing attitudes to foodssFactors influencing attitudes to foodss
Factors influencing attitudes to foodss
 
Psyc308 Presentation 2
Psyc308 Presentation 2Psyc308 Presentation 2
Psyc308 Presentation 2
 

Recently uploaded

Jp Nagar Call Girls Bangalore WhatsApp 8250192130 High Profile Service
Jp Nagar Call Girls Bangalore WhatsApp 8250192130 High Profile ServiceJp Nagar Call Girls Bangalore WhatsApp 8250192130 High Profile Service
Jp Nagar Call Girls Bangalore WhatsApp 8250192130 High Profile ServiceHigh Profile Call Girls
 
(ASHA) Sb Road Call Girls Just Call 7001035870 [ Cash on Delivery ] Pune Escorts
(ASHA) Sb Road Call Girls Just Call 7001035870 [ Cash on Delivery ] Pune Escorts(ASHA) Sb Road Call Girls Just Call 7001035870 [ Cash on Delivery ] Pune Escorts
(ASHA) Sb Road Call Girls Just Call 7001035870 [ Cash on Delivery ] Pune Escortsranjana rawat
 
Russian Call Girls in Nashik Riya 7001305949 Independent Escort Service Nashik
Russian Call Girls in Nashik Riya 7001305949 Independent Escort Service NashikRussian Call Girls in Nashik Riya 7001305949 Independent Escort Service Nashik
Russian Call Girls in Nashik Riya 7001305949 Independent Escort Service Nashikranjana rawat
 
Ho Sexy Call Girl in Mira Road Bhayandar | ₹,7500 With Free Delivery, Kashimi...
Ho Sexy Call Girl in Mira Road Bhayandar | ₹,7500 With Free Delivery, Kashimi...Ho Sexy Call Girl in Mira Road Bhayandar | ₹,7500 With Free Delivery, Kashimi...
Ho Sexy Call Girl in Mira Road Bhayandar | ₹,7500 With Free Delivery, Kashimi...Pooja Nehwal
 
VIP Call Girls Service Shamshabad Hyderabad Call +91-8250192130
VIP Call Girls Service Shamshabad Hyderabad Call +91-8250192130VIP Call Girls Service Shamshabad Hyderabad Call +91-8250192130
VIP Call Girls Service Shamshabad Hyderabad Call +91-8250192130Suhani Kapoor
 
THE ARTISANAL SALT OF SAN VICENTE, ILOCOS SUR: A CASE STUDY
THE ARTISANAL SALT OF SAN VICENTE, ILOCOS SUR: A CASE STUDYTHE ARTISANAL SALT OF SAN VICENTE, ILOCOS SUR: A CASE STUDY
THE ARTISANAL SALT OF SAN VICENTE, ILOCOS SUR: A CASE STUDYHumphrey A Beña
 
(KRITIKA) Balaji Nagar Call Girls Just Call 7001035870 [ Cash on Delivery ] P...
(KRITIKA) Balaji Nagar Call Girls Just Call 7001035870 [ Cash on Delivery ] P...(KRITIKA) Balaji Nagar Call Girls Just Call 7001035870 [ Cash on Delivery ] P...
(KRITIKA) Balaji Nagar Call Girls Just Call 7001035870 [ Cash on Delivery ] P...ranjana rawat
 
VVIP Pune Call Girls Viman Nagar (7001035870) Pune Escorts Nearby with Comple...
VVIP Pune Call Girls Viman Nagar (7001035870) Pune Escorts Nearby with Comple...VVIP Pune Call Girls Viman Nagar (7001035870) Pune Escorts Nearby with Comple...
VVIP Pune Call Girls Viman Nagar (7001035870) Pune Escorts Nearby with Comple...Call Girls in Nagpur High Profile
 
Call Girls in Ghitorni Delhi 💯Call Us 🔝8264348440🔝
Call Girls in Ghitorni Delhi 💯Call Us 🔝8264348440🔝Call Girls in Ghitorni Delhi 💯Call Us 🔝8264348440🔝
Call Girls in Ghitorni Delhi 💯Call Us 🔝8264348440🔝soniya singh
 
Russian Call Girls in Nagpur Devyani Call 7001035870 Meet With Nagpur Escorts
Russian Call Girls in Nagpur Devyani Call 7001035870 Meet With Nagpur EscortsRussian Call Girls in Nagpur Devyani Call 7001035870 Meet With Nagpur Escorts
Russian Call Girls in Nagpur Devyani Call 7001035870 Meet With Nagpur EscortsCall Girls in Nagpur High Profile
 
VIP Russian Call Girls in Noida Deepika 8250192130 Independent Escort Service...
VIP Russian Call Girls in Noida Deepika 8250192130 Independent Escort Service...VIP Russian Call Girls in Noida Deepika 8250192130 Independent Escort Service...
VIP Russian Call Girls in Noida Deepika 8250192130 Independent Escort Service...Suhani Kapoor
 
Call Girls in Nashik Ila 7001305949 Independent Escort Service Nashik
Call Girls in Nashik Ila 7001305949 Independent Escort Service NashikCall Girls in Nashik Ila 7001305949 Independent Escort Service Nashik
Call Girls in Nashik Ila 7001305949 Independent Escort Service NashikCall Girls in Nagpur High Profile
 
The Billo Photo Gallery - Cultivated Cuisine T1
The Billo Photo Gallery - Cultivated Cuisine T1The Billo Photo Gallery - Cultivated Cuisine T1
The Billo Photo Gallery - Cultivated Cuisine T1davew9
 
(MAYA) Baner Call Girls Just Call 7001035870 [ Cash on Delivery ] Pune Escorts
(MAYA) Baner Call Girls Just Call 7001035870 [ Cash on Delivery ] Pune Escorts(MAYA) Baner Call Girls Just Call 7001035870 [ Cash on Delivery ] Pune Escorts
(MAYA) Baner Call Girls Just Call 7001035870 [ Cash on Delivery ] Pune Escortsranjana rawat
 
4th QT WEEK 2 Cook Meat Cuts part 2.pptx
4th QT WEEK 2 Cook Meat Cuts part 2.pptx4th QT WEEK 2 Cook Meat Cuts part 2.pptx
4th QT WEEK 2 Cook Meat Cuts part 2.pptxKattieAlisonMacatugg1
 
VVIP Pune Call Girls Sinhagad Road (7001035870) Pune Escorts Nearby with Comp...
VVIP Pune Call Girls Sinhagad Road (7001035870) Pune Escorts Nearby with Comp...VVIP Pune Call Girls Sinhagad Road (7001035870) Pune Escorts Nearby with Comp...
VVIP Pune Call Girls Sinhagad Road (7001035870) Pune Escorts Nearby with Comp...Call Girls in Nagpur High Profile
 
VIP Call Girl Bikaner Aashi 8250192130 Independent Escort Service Bikaner
VIP Call Girl Bikaner Aashi 8250192130 Independent Escort Service BikanerVIP Call Girl Bikaner Aashi 8250192130 Independent Escort Service Bikaner
VIP Call Girl Bikaner Aashi 8250192130 Independent Escort Service BikanerSuhani Kapoor
 
Pesticide Calculation Review 2013 post.pptx
Pesticide Calculation Review 2013 post.pptxPesticide Calculation Review 2013 post.pptx
Pesticide Calculation Review 2013 post.pptxalfordglenn
 

Recently uploaded (20)

Jp Nagar Call Girls Bangalore WhatsApp 8250192130 High Profile Service
Jp Nagar Call Girls Bangalore WhatsApp 8250192130 High Profile ServiceJp Nagar Call Girls Bangalore WhatsApp 8250192130 High Profile Service
Jp Nagar Call Girls Bangalore WhatsApp 8250192130 High Profile Service
 
(ASHA) Sb Road Call Girls Just Call 7001035870 [ Cash on Delivery ] Pune Escorts
(ASHA) Sb Road Call Girls Just Call 7001035870 [ Cash on Delivery ] Pune Escorts(ASHA) Sb Road Call Girls Just Call 7001035870 [ Cash on Delivery ] Pune Escorts
(ASHA) Sb Road Call Girls Just Call 7001035870 [ Cash on Delivery ] Pune Escorts
 
Russian Call Girls in Nashik Riya 7001305949 Independent Escort Service Nashik
Russian Call Girls in Nashik Riya 7001305949 Independent Escort Service NashikRussian Call Girls in Nashik Riya 7001305949 Independent Escort Service Nashik
Russian Call Girls in Nashik Riya 7001305949 Independent Escort Service Nashik
 
Ho Sexy Call Girl in Mira Road Bhayandar | ₹,7500 With Free Delivery, Kashimi...
Ho Sexy Call Girl in Mira Road Bhayandar | ₹,7500 With Free Delivery, Kashimi...Ho Sexy Call Girl in Mira Road Bhayandar | ₹,7500 With Free Delivery, Kashimi...
Ho Sexy Call Girl in Mira Road Bhayandar | ₹,7500 With Free Delivery, Kashimi...
 
VIP Call Girls Service Shamshabad Hyderabad Call +91-8250192130
VIP Call Girls Service Shamshabad Hyderabad Call +91-8250192130VIP Call Girls Service Shamshabad Hyderabad Call +91-8250192130
VIP Call Girls Service Shamshabad Hyderabad Call +91-8250192130
 
THE ARTISANAL SALT OF SAN VICENTE, ILOCOS SUR: A CASE STUDY
THE ARTISANAL SALT OF SAN VICENTE, ILOCOS SUR: A CASE STUDYTHE ARTISANAL SALT OF SAN VICENTE, ILOCOS SUR: A CASE STUDY
THE ARTISANAL SALT OF SAN VICENTE, ILOCOS SUR: A CASE STUDY
 
(KRITIKA) Balaji Nagar Call Girls Just Call 7001035870 [ Cash on Delivery ] P...
(KRITIKA) Balaji Nagar Call Girls Just Call 7001035870 [ Cash on Delivery ] P...(KRITIKA) Balaji Nagar Call Girls Just Call 7001035870 [ Cash on Delivery ] P...
(KRITIKA) Balaji Nagar Call Girls Just Call 7001035870 [ Cash on Delivery ] P...
 
VVIP Pune Call Girls Viman Nagar (7001035870) Pune Escorts Nearby with Comple...
VVIP Pune Call Girls Viman Nagar (7001035870) Pune Escorts Nearby with Comple...VVIP Pune Call Girls Viman Nagar (7001035870) Pune Escorts Nearby with Comple...
VVIP Pune Call Girls Viman Nagar (7001035870) Pune Escorts Nearby with Comple...
 
Call Girls in Ghitorni Delhi 💯Call Us 🔝8264348440🔝
Call Girls in Ghitorni Delhi 💯Call Us 🔝8264348440🔝Call Girls in Ghitorni Delhi 💯Call Us 🔝8264348440🔝
Call Girls in Ghitorni Delhi 💯Call Us 🔝8264348440🔝
 
Russian Call Girls in Nagpur Devyani Call 7001035870 Meet With Nagpur Escorts
Russian Call Girls in Nagpur Devyani Call 7001035870 Meet With Nagpur EscortsRussian Call Girls in Nagpur Devyani Call 7001035870 Meet With Nagpur Escorts
Russian Call Girls in Nagpur Devyani Call 7001035870 Meet With Nagpur Escorts
 
9953330565 Low Rate Call Girls In Sameypur-Bodli Delhi NCR
9953330565 Low Rate Call Girls In Sameypur-Bodli Delhi NCR9953330565 Low Rate Call Girls In Sameypur-Bodli Delhi NCR
9953330565 Low Rate Call Girls In Sameypur-Bodli Delhi NCR
 
VIP Russian Call Girls in Noida Deepika 8250192130 Independent Escort Service...
VIP Russian Call Girls in Noida Deepika 8250192130 Independent Escort Service...VIP Russian Call Girls in Noida Deepika 8250192130 Independent Escort Service...
VIP Russian Call Girls in Noida Deepika 8250192130 Independent Escort Service...
 
Call Girls in Nashik Ila 7001305949 Independent Escort Service Nashik
Call Girls in Nashik Ila 7001305949 Independent Escort Service NashikCall Girls in Nashik Ila 7001305949 Independent Escort Service Nashik
Call Girls in Nashik Ila 7001305949 Independent Escort Service Nashik
 
The Billo Photo Gallery - Cultivated Cuisine T1
The Billo Photo Gallery - Cultivated Cuisine T1The Billo Photo Gallery - Cultivated Cuisine T1
The Billo Photo Gallery - Cultivated Cuisine T1
 
Call Girls In Tilak Nagar꧁❤ 🔝 9953056974🔝❤꧂ Escort ServiCe
Call Girls In  Tilak Nagar꧁❤ 🔝 9953056974🔝❤꧂ Escort ServiCeCall Girls In  Tilak Nagar꧁❤ 🔝 9953056974🔝❤꧂ Escort ServiCe
Call Girls In Tilak Nagar꧁❤ 🔝 9953056974🔝❤꧂ Escort ServiCe
 
(MAYA) Baner Call Girls Just Call 7001035870 [ Cash on Delivery ] Pune Escorts
(MAYA) Baner Call Girls Just Call 7001035870 [ Cash on Delivery ] Pune Escorts(MAYA) Baner Call Girls Just Call 7001035870 [ Cash on Delivery ] Pune Escorts
(MAYA) Baner Call Girls Just Call 7001035870 [ Cash on Delivery ] Pune Escorts
 
4th QT WEEK 2 Cook Meat Cuts part 2.pptx
4th QT WEEK 2 Cook Meat Cuts part 2.pptx4th QT WEEK 2 Cook Meat Cuts part 2.pptx
4th QT WEEK 2 Cook Meat Cuts part 2.pptx
 
VVIP Pune Call Girls Sinhagad Road (7001035870) Pune Escorts Nearby with Comp...
VVIP Pune Call Girls Sinhagad Road (7001035870) Pune Escorts Nearby with Comp...VVIP Pune Call Girls Sinhagad Road (7001035870) Pune Escorts Nearby with Comp...
VVIP Pune Call Girls Sinhagad Road (7001035870) Pune Escorts Nearby with Comp...
 
VIP Call Girl Bikaner Aashi 8250192130 Independent Escort Service Bikaner
VIP Call Girl Bikaner Aashi 8250192130 Independent Escort Service BikanerVIP Call Girl Bikaner Aashi 8250192130 Independent Escort Service Bikaner
VIP Call Girl Bikaner Aashi 8250192130 Independent Escort Service Bikaner
 
Pesticide Calculation Review 2013 post.pptx
Pesticide Calculation Review 2013 post.pptxPesticide Calculation Review 2013 post.pptx
Pesticide Calculation Review 2013 post.pptx
 

A19

  • 1. Public Health Nutrition: page 1 of 6 doi:10.1017/S1368980010003599 Changes in meal pattern among Norwegian children from 2001 to 2008 Nina Øverby1, *, Tonje H Stea1 , Frøydis N Vik1 , Knut-Inge Klepp2 and Elling Bere1 1 Department of Public Health, Sport and Nutrition, Faculty of Health and Sport, University of Agder, PO Box 422, 4604 Kristiansand, Norway: 2 Department of Nutrition, Faculty of Medicine, University of Oslo, Oslo, Norway Submitted 13 April 2010: Accepted 18 November 2010 Abstract Objective: The present study aimed to analyse changes in meal pattern among Norwegian children from 2001 to 2008 in general; to analyse associations between meal pattern and gender, parental educational level and number of parents in the household; and to analyse the association between intake of unhealthy snacks, meal pattern and the mentioned variables. Design: Within the Fruits and Vegetables Make the Marks (FVMM) project, two cross-sectional studies were conducted, one in 2001 and one in 2008, where participants from the same schools filled in a questionnaire on meals eaten the previous day. Subjects: Participants were 6th and 7th grade pupils, n 1488 in 2001 and n 1339 in 2008. Setting: Twenty-seven elementary schools in two Norwegian counties. Results: There were no significant changes in children’s meal pattern from 2001 to 2008. For both years more than 90 % of the participants reported that they had breakfast yesterday, while 95 % had lunch, 94 % had dinner and 82 % had supper. More girls than boys reported that they had lunch yesterday (96 % v. 94 %, P 5 0?03). More children with higher v. lower educated parents reported that they had breakfast yesterday (93 % v. 88 %, P , 0?001). More children living with two parents v. one parent had breakfast (93 % v. 88 %, P 5 0?001) and lunch yesterday (97 % v. 93 %, P , 0?001). Conclusions: There were no changes in meal pattern from 2001 to 2008 among Norwegian children. Characteristics associated with skipping meals were living in a one-parent family and having lower educated parents. Keywords Breakfast Cohort Children Meal pattern In recent years there has been an increased focus on meal pattern among children and adolescents(1–4) . First, there has been much interest in meal pattern in relation to health status(1) . Special attention has been given to the importance of eating breakfast, which has been asso- ciated with a multitude of positive health benefits, espe- cially an association with body weight. Breakfast skipping among young people has been shown to be associated with an increased likelihood of being overweight or obese(5–8) and having higher BMI(9,10) . A recently published study among Norwegian children showed increased odds of being overweight when fewer than four meals were eaten the previous day(11) . Second, studies from the 1980s to today have described a distinct change in meal pattern in children and ado- lescents, more than observed in the adult popula- tion(2,3,12) . These changes vary widely from one region to the other(12) . Generally, information about children’s and adolescents’ meal frequency is scarce. However, in Europe an increased prevalence of irregular meal patterns has been reported. In Norway it has been reported that 15 % of healthy children and adolescents skip breakfast and 30 % skip lunch twice weekly or more(13) . In the USA the prominent trend is an increase in snacking events between meals(12) . A third focus on meal pattern has concerned the importance of how and with whom meals are eaten. Family meals (eating together as a family with one or two parents present) appear to be associated with a variety of positive health behaviours in childhood and adoles- cence(14) . An American 10-year longitudinal study of black and white girls aged 9–19 years suggested that eating together as a family during childhood may have multiple health benefits in later years, such as fewer eating disorders, lower alcohol and tobacco consumption and less extreme weight-control behaviours(15) . Knowing the probable health benefits of having regular meals and that eating patterns established during adolescence SPublicHealthNutrition *Corresponding author: Email nina.c.overby@uia.no r The Authors 2011
  • 2. shape diet later in life(16) , an analysis of changes in meal pattern and factors associated with meal patterns in children is important. In Norway breakfast is usually sandwiches or cereals, school lunch is usually packed sandwiches, while dinner is a hot meal, and supper is often sandwiches or cereals. Many Norwegians have supper, most probably because they have an early dinner (16.00–18.00 hours) which is not all common in other European countries(17) . The present study aimed to analyse changes in meal pattern in Norwegian children from 2001 to 2008 in general; to analyse associations between meal pattern and gender, parental educational level and number of parents in the household; and to analyse the association between intake of unhealthy snacks, meal pattern and the men- tioned variables. Methods Sample and procedure The current study is a part of the Fruits and Vegetables Make the Marks (FVMM) project. In 2001, forty-eight schools from Hedmark and Telemark counties (twenty- four schools in each county) were randomly selected and invited to participate in the project FVMM, and thirty-eight agreed to participate. All 6th and 7th graders (age 10–12 years) in these thirty-eight schools were invited to take part in a questionnaire survey. These thirty-eight schools were contacted again in 2008, and were invited to parti- cipate once more in a similar survey. At that time twenty- seven schools agreed to participate, and all 6th and 7th graders in these twenty-seven schools were invited to participate. Pupils from the twenty-seven schools, from both 2001 and 2008, constitute the study sample of the present study (Table 1)(18) . Further details on the sam- pling process are available elsewhere(18) . Eleven schools that participated in 2001 did not participate in 2008. In a previously reported attrition analysis, no significant differences between the present study sample from the twenty-seven schools participating in both the 2001 and 2008 surveys and pupils at the eleven schools that parti- cipated in 2001 but not in 2008 were observed regarding sex, parental education level, and fruit and vegetable intake at school and all day(18) . During both data collections (in 2001 and 2008), the same questionnaire was completed by the children in the presence of a trained project worker in the classroom. One school lesson (45 min) was used to complete the questionnaire. The present study sample includes in total 2827 children (1488 in 2001 and 1339 children in 2008) out of 3439 eligible (participation rate 82?2 %). The main reason why children did not participate in the study was absence from school on the survey day. The participation rates for parents were 83 % in 2001 and 74 % in 2008 (Table 1). Table 1 gives a description of the participants and shows that there were no differences in numbers living with one parent between 2001 and 2008. The par- ents participating in 2008 had higher education than those participating in 2001 (P , 0?001; Table 1). This is similar to what has been seen in Norway in general during the past 10 years; that there is an increased part of the population having high education(19) . Research clearance was obtained from the Norwegian Social Science Data Services. Written informed consent was obtained from parents and children prior to partici- pation in the study. The questionnaire included questions about meals wherein the participants were asked if they had breakfast, lunch, dinner or supper the previous day. The question was answered ‘yes’ or ‘no’. A sum score was made including if they had breakfast, lunch, dinner or supper yesterday, ranging from 0 to 4 meals yesterday. This was further dichotomized into having fewer than 4 meals per day and having 4 meals per day. This variable is called ‘all meals’. Another sum score of unhealthy snacks was made from the following three items from an FFQ: ‘How often do you drink soda (including sugar)?’, ‘How often do you eat candy (e.g. chocolate, mixed candy)’ and ‘How often do you eat potato chips?’ All items had ten response alternatives (‘never’, ‘less than once a week’, ‘once a week’, ‘twice a week’, y, ‘six times a week’, ‘every day’, ‘several times every day’), and they were scored (0, 0?5, 1, 2, y, 6, 7, 10), giving the unhealthy snack scale a range from 0 to 30 times/week. Further, the children filled in questions about gender and number of parents in the household. Number of par- ents in the household was assessed by: ‘Tick the alternative showing the persons living at home with you’. Response alternatives were mother, father, stepmother and step- father. Participants could tick more than one alternative if they lived with two parents. If parents were separated, the participants were supposed to tick the alternative showing the parent they live with most of the time. All responses were added and, eventually, dichotomized into living with one parent or living with two parents. Parental educational level was assessed individually in a questionnaire filled in by the parents, with one question: ‘What level of education do you have?’ The question had four response alternatives: ‘elementary school’, ‘high school’, ‘college or university’ (3 years or less) and ‘college or university’ (more than 3 years). This variable was dichotomized into lower (no college or university education) and higher (having attended college or university). Statistical analysis Differences in gender, parental education, number of parents in the household and meal pattern between 2001 and 2008 were analysed by x2 tests (Table 1). Crude and adjusted data were analysed by different multilevel linear- mixed models with breakfast, lunch, dinner, supper and SPublicHealthNutrition 2 N Øverby et al.
  • 3. all meals as the dependent variables. Crude results are only commented upon in the text (data not shown in any table). Relevant confounders were chosen according to the litera- ture, and all adjusted models (Table 2) included gender, parental education, number of parents in the household, time of data collection and grade. In all adjusted models the following interaction terms were included: time3gender, time3parental education and time 3number of parents in the household. This was done to assess possible interaction between time and the examined variables. Results presented in the text regarding unhealthy snacks (data not shown in any table) were analysed by a multilevel linear-mixed model with unhealthy snacks as the dependent variable, and adjusted for all meals, gender, parental education, number of parents in the household, time of data collection and grade. All models were also adjusted for school as a random effect. Accepted significant level was set at P,0?05. All statistical analyses were performed using the SPSS statistical software package version 17?0 (SPSS Inc., Chicago, IL, USA). Results Results from the present study showed that there were no significant changes in children’s meal pattern from 2001 to 2008. For both years more than 90 % of the participants reported that they had eaten breakfast yesterday, while approximately 95 % had eaten lunch, 94 % had eaten dinner, 82 % had eaten supper and about 70 % had eaten all four meals (Table 1). All of the specific meals were analysed according to gender, parental education, number of parents in the household and study year and further adjusted for grade. No significant interactions were observed between time and gender (breakfast: P 5 0?88, lunch; P 5 0?91, dinner: P 5 0?31, supper: P 5 0?08, all meals: P 5 0?15), parental education (breakfast: P 5 0?69, lunch: P 5 0?84, dinner: P 5 0?16, supper: P 5 0?90, all meals: P 5 0?75) or number of parents in the household (breakfast: P 5 0?74, lunch: P 5 0?50, dinner: P 5 0?40, supper: P 5 0?79, all meals: P 5 0?78), meaning that the associations between meal patterns and examined variables have not changed from 2001 to 2008; therefore the further results are presented for 2001 and 2008 together (Table 2). In the unadjusted analysis more girls than boys repor- ted that they had eaten lunch (effect size: 2?4 (95 % CI 0?9, 3?9) percentage points) the previous day, and fewer girls than boys had eaten supper (effect size: 23?8 (95 % CI 26?6, 21?0) percentage points). However after adjusting for relevant confounders, only the relationship that more SPublicHealthNutrition Table 1 Description of participants included in 2001 and 2008: 6th and 7th grade pupils from twenty-seven elementary schools in two Norwegian counties 2001 2008 (n 1488) (n 1339) x2 P value Number of schools 27 27 Eligible pupils 1727 1712 Participating pupils (total) 1488 1339 Participation rate of pupils (%) 86 78 Age of pupils (% 7th graders) 47 49 0?47 0?50 Gender (%) n 1486 n 1314 Male 50 48 Female 50 52 1?60 0?21 Parents in household (%) n 1442 n 1286 Single-parent family 19 20 Two-parent family 81 80 0?13 0?72 Meal pattern (%) Breakfast n 1478 n 1328 Yes 91 91 No 9 9 0?02 0?88 Lunch n 1473 n 1322 Yes 95 96 No 5 4 0?23 0?64 Dinner n 1468 n 1324 Yes 94 94 No 6 6 0?27 0?60 Supper n 1477 n 1329 Yes 83 82 No 18 18 0?01 0?92 All meals (total of all 4 meals) n 1438 n 1288 Yes 69 72 No 31 28 2?23 0?13 Participating parents 1230 996 Participation rate of parents (%) 83 74 Parental education (%) n 1210 n 984 Low 58 46 High 42 54 27?92 ,0?001 Meal pattern in Norwegian children 3
  • 4. girls than boys had eaten lunch yesterday (effect size: 1?8 (95 % CI 0?1, 3?4) percentage points) remained significant (Table 2). Unadjusted and adjusted relationships were otherwise similar, and in the following the results from the adjusted models (Table 2) are presented. More chil- dren with higher educated parents had eaten breakfast v. those with lower educated parents (effect size: 4?2 (95 % CI 1?9, 6?5) percentage points). Furthermore, more chil- dren living with two parents had eaten breakfast (effect size: 5?1 (95 % CI 2?1, 8?2) percentage points) and lunch (effect size: 4?0 (95 % CI 1?8, 6?1) percentage points) v. those living with single parents. There were no significant differences in the number of children eating dinner or supper regarding gender, parental education, number of parents in the household or study year (Table 2). Further, analysing the sum score of all meals, more children with higher educated parents than lower educated parents (effect size: 4?7 (95 % CI 0?8, 8?7) percentage points) and more children living with two parents than living with one parent (effect size: 6?2 (95 % CI 1?1, 11?3) percentage points) had all four meals yesterday (Table 2). There were no significant differences by gender or study year ana- lysing the sum score of all meals (Table 2). Crude data showed that those having 4 meals yesterday had a lower intake of unhealthy snacks v. those who had fewer meals (5?7 times/week v. 6?3 times/week, P 5 0?001); however when adjusting for gender, grade, parental education, number of parents in household and study year, the difference was not significant (5?5 times/ week v. 5?9 times/week, P 5 0?06). Discussion No significant changes in meal pattern were observed in Norwegian children between 2001 and 2008. Few studies have described changes in meal pattern over time in the same geographic and age population as the present study. One study that has, the Bogalusa Heart Study, included 1584 children aged 10 years from 1973 to 1994; it described changes in meal patterns over time and reported different trends, including an increased number of breakfast skippers(2) . A review of more recently con- ducted studies from European countries has described meal changes among children and adolescents as going from regular meals to skipping main meals(3) . The general trend in higher-income countries is an increased number of snacks and meals eaten away from home, and more consumption of fast food and energy-containing bev- erages(12) . The increased focus on the importance of regular meals may positively have influenced the finding of no changes in meal patterns during 8 years in the present study. Breakfast represents a healthy habit and associations with positive health outcomes have been widely described(20) , ranging from reduced prevalence of overweight(21) via improved dietary quality(1) to SPublicHealthNutrition Table2Mealpatterninchildrenfrom2001and2008accordingtogender,parentaleducation,numberofparentsinthehouseholdandyearthestudywasperformed*:6thand7thgradepupils fromtwenty-sevenelementaryschoolsintwoNorwegiancounties n BreakfastLunchDinnerSupperAllmeals- TotalPrevalence95%CI*P*Prevalence95%CI*P*Prevalence95%CI*P*Prevalence95%CI*P*Prevalence95%CI*P* Gender(%) Boy13789189,939492,959392,958279,866965,73 Girl14229089,920?869694,970?039593,970?197976,830?116864,730?84 Meandifference(boy–girl)20?222?5,2?11?80?1,3?41?320?6,3?322?725?9,0?620?424?3,3?5 Parentaleducation(%) Low11568887,909594,979392,957976,836662,70 High10389391,95,0?0019493,960?399593,970?15829,860?077167,750?03 Meandifference(low–high)4?21?9,6?520?722?4,0?91?520?5,3?53?020?2,6?54?70?8,8?7 No.ofparentsinhousehold(%) 15318885,919391,959491,967974,846560,71 .121979392,950?0019795,98,0?0019493,960?788380,860?107268,750?02 Meandifference(1–.1)5?12?1,8?24?01?8,6?10?422?2,3?03?620?7,7?96?21?1,11?3 Year(%) 200114889189,939593,969492,968177,856864,72 200813399088,930?669593,970?739492,960?748177,850?936965,740?61 Meandifference(2001–2008)20?723?7,2?30?421?8,2?520?423?1,2?20?224?5,4?11?423?8,6?5 *Multilevellinearmixedmodelsadjustedforgradeandallvariablespresentedforeachmodel. -’Allmeals’includesasumscoreofwhetherbreakfast,lunch,dinnerandsupperwaseatenyesterday.Variableisdichotomizedintohavingfewerthan4mealsperdayandhaving4mealsperday. 4 N Øverby et al.
  • 5. improved school performance(22) . The relationship between overweight and meal frequency is still debated; some have found that skipping meals yields higher odds of being overweight(5,11,21) , while others have not detected significant associations(2) . Among the children living with only one parent, there were more breakfast and lunch skippers compared with those living with two parents. The literature on family correlates of children’s and adolescents’ breakfast con- sumption has recently been reviewed by Pearson and co- workers(23) . The review showed that living in two-parent families and parental breakfast eating were among the social factors that play a prominent role in adolescents’ breakfast habits(23) . The first association is in accordance with the results of the present study. Most studies have explored family correlates only in relation to breakfast consumption. However, in the present study we found that living in a one-parent family also was related to skipping lunch. Stewart and Menning described that children in non- traditional family households (single parent, step-parent, no parent) are more likely to display unhealthy eating habits such as skipping breakfast and lunch(24) . A possible explanation for these findings could be that single-parent families, wherein the parent is also in employment, have less time to shop and prepare meals than two-parent families. Further it might be more difficult to be present in the morning when children have breakfast. Recent research has shown that having at least one parent present in the morning substantially increased the likelihood of eating breakfast among adolescents(4) . In addition, research showed that having family meals in itself is related to improved dietary profiles(25) . Another study showed that the effect of family meals provides a lasting positive influ- ence into young adulthood(16) . The relationship between meal skipping and one-parent families has important implications for the development and implementation of effective nutrition interventions in high-risk groups. In the present study, children with higher educated parents reported to have breakfast more often than those with parents with lower education. This relationship is also discussed in the literature; however, in the mentioned review by Pearson and co-workers, breakfast consumption was not related to parental education in five of eight sam- ples and positively associated with breakfast consumption in three samples(23) . The HELENA (Healthy Lifestyle in Europe by Nutrition in Adolescence) study, which was not included in the mentioned review, found a significant influence of socio-economic status on breakfast habits, as the percentage of adolescents having ‘adequate’ breakfast increased as socio-economic status increased(26) . More boys than girls were lunch skippers; however the difference was rather small (2 percentage points). These results are in accordance with results from the HELENA study where girls had significantly higher mean frequencies of meals daily than boys(12) . However most studies find that girls skip meals more often than boys(12,27–29) . In general, studies report that boys have diets lower in fruits and vegetables(30) and higher in sugar-sweetened soft drinks(31) compared with girls. The trend of skip- ping meals will add to an already negative dietary pattern for boys. Some studies report that those who skip meals have a higher intake of energy-dense food and unhealthy snacks(1) . In the present study, crude data showed that those who had skipped one or more meals the previous day had a higher intake of unhealthy snacks. However, this relationship was not present when adjusting for parental education, gender and study year. Strengths and limitations of the study The present study comprises two cross-sectional surveys in a well-defined population and includes a high number of participants, covering a time span from 2001 to 2008 from the same region. Limiting the results of the study is the dietary metho- dology. Studies have shown that one 24 h recall does not characterize an individual’s typical meal pattern, but may be sufficient for characterizing meal habits of large groups of children(32) , as presented herein. A further limitation of the study is the definition of meal pattern by asking only one question for each meal that is answered yes or no. Data being self-reported is another limitation. The ques- tions regarding meal pattern have not been validated. However, a validity and reproducibility study has been conducted among Norwegian 6th graders for other vari- ables in the questionnaire such as intake of fruit and vegetables(33) . That study showed that both the 24 h recall part and the frequency part gave consistent responses on separate occasions in the test–retest study. Moreover, the 6th graders were capable of recording yesterday’s intake of vegetables, but overestimated intake of fruit and juice. Also, the snacking variable is limited since some potential snacks, such as cookies, nuts and juices with added sugar, are not included. Another limitation is that the participating pupils were from only two of Norway’s nineteen counties and no large cities are situated in these two counties. On the other hand, Oslo is the only large city in Norway (.250 000 inhabitants) and as Norway in general is a rather homogeneous country, we believe the results are likely to be generalizable to the other counties as well. Conclusions The current study shows a stable meal pattern from 2000 to 2008 among Norwegian children. Characteristics asso- ciated with skipping meals were living in a one-parent family, having parents with low education and being a boy. The results are important for health promoting strategies, which should give special attention to single- parent families. SPublicHealthNutrition Meal pattern in Norwegian children 5
  • 6. Acknowledgements The FVMM project is funded by the Research Council of Norway. The authors declare that they have no compet- ing interests. K.-I.K. conceived the FVMM project. E.B. and K-I.K. designed the present study. N.Ø., T.H.S. and E.B. analysed and interpreted the data. N.Ø., T.H.S. and F.N.V. drafted the manuscript, and E.B. and K.-I.K. revised it critically. All authors have approved the final version of the manuscript. References 1. Rampersaud GC, Pereira MA, Girard BL et al. (2005) Breakfast habits, nutritional status, body weight, and academic performance in children and adolescents. J Am Diet Assoc 105, 743–760. 2. Nicklas TA, Morales M, Linares A et al. (2004) Children’s meal patterns have changed over a 21-year period: the Bogalusa Heart Study. J Am Diet Assoc 104, 753–761. 3. Samuelson G (2000) Dietary habits and nutritional status in adolescents over Europe. An overview of current studies in the Nordic countries. Eur J Clin Nutr 54, Suppl. 1, S21–S28. 4. Merten MJ, Williams AL & Shriver LH (2009) Breakfast consumption in adolescence and young adulthood: par- ental presence, community context, and obesity. J Am Diet Assoc 109, 1384–1391. 5. Andersen LF, Lillegaard IT, Overby N et al. (2005) Over- weight and obesity among Norwegian schoolchildren: changes from 1993 to 2000. Scand J Public Health 33, 99–106. 6. Croezen S, Visscher TL, Ter Bogt NC et al. (2009) Skipping breakfast, alcohol consumption and physical inactivity as risk factors for overweight and obesity in adolescents: results of the E-MOVO project. Eur J Clin Nutr 63, 405–412. 7. Dubois L, Girard M & Potvin KM (2006) Breakfast eating and overweight in a pre-school population: is there a link? Public Health Nutr 9, 436–442. 8. Groholt EK, Stigum H & Nordhagen R (2008) Overweight and obesity among adolescents in Norway: cultural and socio-economic differences. J Public Health (Oxf) 30, 258–265. 9. Barton BA, Eldridge AL, Thompson D et al. (2005) The relationship of breakfast and cereal consumption to nutrient intake and body mass index: the National Heart, Lung, and Blood Institute Growth and Health Study. J Am Diet Assoc 105, 1383–1389. 10. Delva J, Johnston LD & O’Malley PM (2007) The epidemiology of overweight and related lifestyle behaviors: racial/ethnic and socioeconomic status differences among American youth. Am J Prev Med 33, 4 Suppl., S178–S186. 11. Vik FN, Øverby NC, Lien N et al. (2010) Number of meals eaten in relation to weight status among Norwegian adolescents. Scand J Public Health 38, Suppl. 5, 13–18. 12. Moreno LA, Rodriguez G, Fleta J et al. (2010) Trends of dietary habits in adolescents. Crit Rev Food Sci Nutr 50, 106–112. 13. Overby NC, Margeirsdottir HD, Brunborg C et al. (2008) Sweets, snacking habits, and skipping meals in children and adolescents on intensive insulin treatment. Pediatr Diabetes 9, 393–400. 14. Mamun AA, Lawlor DA, O’Callaghan MJ et al. (2005) Positive maternal attitude to the family eating together decreases the risk of adolescent overweight. Obes Res 13, 1422–1430. 15. Franko DL, Thompson D, Affenito SG et al. (2008) What mediates the relationship between family meals and adolescent health issues? Health Psychol 27, 2 Suppl., S109–S117. 16. Larson NI, Neumark-Sztainer D, Hannan PJ et al. (2007) Family meals during adolescence are associated with higher diet quality and healthful meal patterns during young adulthood. J Am Diet Assoc 107, 1502–1510. 17. Nordic Council of Ministers (2004) Eating pattern. In Nordic Nutrition Recommendations 2004: Integrating Nutrition and Physical Activity, pp. 85–101. Copenhagen: Nordic Council of Ministers. 18. Bere E, Hilsen N & Klepp K-I (2010) Effect of the nationwide free school fruit scheme in Norway. Br J Nutr 104, 589–594. 19. Statistics Norway (2010) Education statistics. Students at universities and colleges, 1 October 2009. http:// www.ssb.no/english/subjects/04/02/40/utuvh_en/ (accessed December 2010). 20. Agostoni C & Brighenti F (2010) Dietary choices for breakfast in children and adolescents. Crit Rev Food Sci Nutr 50, 120–128. 21. Wurbach A, Zellner K & Kromeyer-Hauschild K (2009) Meal patterns among children and adolescents and their associations with weight status and parental characteristics. Public Health Nutr 12, 1115–1121. 22. Hoyland A, Dye L & Lawton CL (2009) A systematic review of the effect of breakfast on the cognitive performance of children and adolescents. Nutr Res Rev 22, 220–243. 23. Pearson N, Biddle SJ & Gorely T (2009) Family correlates of breakfast consumption among children and adolescents. A systematic review. Appetite 52, 1–7. 24. Stewart SD & Menning CL (2009) Family structure, nonresident father involvement, and adolescent eating patterns. J Adolesc Health 45, 193–201. 25. Neumark-Sztainer D, Hannan PJ, Story M et al. (2003) Family meal patterns: associations with sociodemographic characteristics and improved dietary intake among adoles- cents. J Am Diet Assoc 103, 317–322. 26. Moreno LA, Kersting M, de Henauw S et al. (2005) How to measure dietary intake and food habits in adolescence: the European perspective. Int J Obes (Lond) 29, Suppl. 2, S66–S77. 27. Story M, Neumark-Sztainer D & French S (2002) Individual and environmental influences on adolescent eating beha- viors. J Am Diet Assoc 102, 3 Suppl., S40–S51. 28. Sjoberg A, Hallberg L, Hoglund D et al. (2003) Meal pattern, food choice, nutrient intake and lifestyle factors in The Goteborg Adolescence Study. Eur J Clin Nutr 57, 1569–1578. 29. Siega-Riz AM, Popkin BM & Carson T (1998) Trends in breakfast consumption for children in the United States from 1965–1991. Am J Clin Nutr 67, 748S–756S. 30. Rasmussen M, Krolner R, Klepp KI et al. (2006) Determi- nants of fruit and vegetable consumption among children and adolescents: a review of the literature. Part I: Quantitative studies. Int J Behav Nutr Phys Act 3, 22. 31. Bere E, Glomnes ES, te Velde SJ et al. (2008) Determinants of adolescents’ soft drink consumption. Public Health Nutr 11, 49–56. 32. Thompson FE & Byers T (1994) Dietary assessment resource manual. J Nutr 124, 11 Suppl., 2245S–2317S. 33. Andersen LF, Bere E, Kolbjornsen N et al. (2004) Validity and reproducibility of self-reported intake of fruit and vegetable among 6th graders. Eur J Clin Nutr 58, 771–777. SPublicHealthNutrition 6 N Øverby et al.