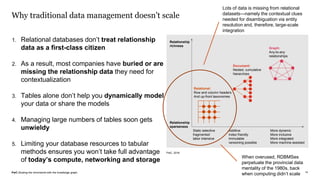
SlideShare a Scribd company logo
1 of 27
Alan Morrison
SWC Webinar
23 October 2019
Scaling the mirrorworld with
knowledge graphs
PwC |Scaling the mirrorworld with the knowledge graph
Agenda
2
The mirrorworld vision
How graphs will begin to underlay the mirrorworld
Why semantic graphs are more efficient
Use cases that point the way forward
Conclusion: Efficiencies throughout the data lifecycle
Definitions and the
mirrorworld vision
PwC |Scaling the mirrorworld with the knowledge graph
Definitions
Content = Meaningful, human-readable data + logic in the
form of text, images, audio, video (or combinations of these)
Knowledge graphs = Meaningful, machine readable data +
logic in the form of any-to-any connected, contextualized
entities, their properties and relationships
Content can be modeled and then read by machines the same
way as other data + logic. The same techniques can apply.
PwC |Scaling the mirrorworld with the knowledge graph
In the mirrorworld,
everything will have a
paired twin.
Kevin Kelly in Wired
Feb 12, 2019
June 2019
5
PwC |Scaling the mirrorworld with the knowledge graph
What’s a digital twin? Depends on who you ask
6
GE: “At its core, the Digital Twin consists of sophisticated models or system
of models based on deep domain knowledge of specific industrial assets.
The Digital Twin is informed by a massive amount of design,
manufacturing, inspection, repair, online sensor and operational data.”
Goals: Predictive analytics, knowledge representation, etc.
From “What is a digital twin?” GE Digital, 2019
Finger Food, “We Are Industry-leading Digital Twin Holographic Service
Providers….
Imagine taking all of your disparate data sets from multiple spreadsheets
and diagrams and combining them into one live-streaming visual
holographic representation of your data – at full scale.”
Goals: “We can take your data from your spreadsheets and turn it into
clear, actionable context like never before…”
From “Digital Twin Solutions to Improve your Bottom Line,” Finger Food
Advanced Technology Group,“ 2019
PwC |Scaling the mirrorworld with the knowledge graph
Consider how long it took to build out the world’s oil &
gas infrastructure.
Now think about where we are with traditional data
management:
• How do we free ourselves from legacy IT?
• How do we build sharable digital twins?
• How do we scale a shared data infrastructure?
The mirrorworld poses a
massive global data
infrastructure challenge
7
PwC |Scaling the mirrorworld with the knowledge graph
Why treating smart data as a strategic asset is so critical right now
8
Challenge of the 2020s: Feeding your AIs enough
relevant, quality data
• Emerging tech often gets adopted just in pockets,
• That’s particularly the case with AI.
• Retraining, hiring new people, or buying more tools
isn’t enough.
• Many never figure out how to take advantage of
important AI-enabling tech. They’ll just use it in ad-
hoc projects or subscribe to AI-enhanced apps.
• But the impact on decision making will be minimal
without an industrial-scale approach to data and
flow.
Opportunity of the 2020s:
Pipelines, distribution networks and
volumes of quality, contextualized
smart data flowing to the point of
need
The challenge we face is the same
as the oil and gas industry faced in
the 1920s:
• Collecting enough raw material
• Refining and enriching it
• Distributing it to the places that
need it most
• Creating enough supply to
generate massive demand and
drive down the cost of AI
How graphs will
begin to underlay the
mirrorworld
PwC |Scaling the mirrorworld with the knowledge graph
Emerging techs – How are all these things interrelated?
Are they addressable too?
Knowledge graphs—the manifestation of a data-
centric architecture--can empower the other
technologies in these ways:
1. Accelerate machine learning training set
development
2. Enable multi-domain virtual
assistants/chatbots
3. Add reasoning to conversational ai platforms
4. Become means of sharing and interoperation
of digital twins
10
PwC |Scaling the mirrorworld with the knowledge graph
Emerging markets — related to most relevant hype cycle techs
11
Total projected revenue: $58.2 billion (2021)
Source: Tractica, Grandview Research and PwC analysis, 2019
PwC |Scaling the mirrorworld with the knowledge graph
Summary: A very large available market, but of course there’s a catch….
12
4%
5%
5%
8%
8%
9%
14%
13%
8%
26%
Summary of global target markets for
knowledge graph technology, 2021
Digital twins PaaS--data mgmt.
DaaS (org. domain) Virtual assistants
Conversational AI Deep learning
PaaS--integration, orchestration Info mgmt software
Integration software DBMS software
Total: $205 Billion Sources: Gartner (hype cycle only),
IDC, Tractica, PwC analysis, 2019
Why semantic graphs
are more efficient
PwC |Scaling the mirrorworld with the knowledge graph
Why traditional data management doesn’t scale
14
1. Relational databases don’t treat relationship
data as a first-class citizen
2. As a result, most companies have buried or are
missing the relationship data they need for
contextualization
3. Tables alone don’t help you dynamically model
your data or share the models
4. Managing large numbers of tables soon gets
unwieldy
5. Limiting your database resources to tabular
methods ensures you won’t take full advantage
of today’s compute, networking and storage
Relationship
richness
Relationship
sparseness
Static selective
fragmented
labor intensive
Additive
Index friendly
Immutable
versioning possible
More dynamic
More inclusive
More integrated
More machine assisted
Relational:
Row and column headers
And up-front taxonomies
Document:
Nested, cumulative
hierarchies
Graph:
Any-to-any
relationships
PwC, 2016
When overused, RDBMSes
perpetuate the provincial data
mentality of the 1980s, back
when computing didn’t scale
Lots of data is missing from relational
datasets—namely the contextual clues
needed for disambiguation via entity
resolution and, therefore, large-scale
integration
PwC |Scaling the mirrorworld with the knowledge graph
The consequence of logic and data siloing – App-centric system-level complexity
and disconnectedness spinning out of control (Result – Table and code sprawl)
15
Hardware
DBMS
OS
Custom code
Hardware
Lots of OSes
1,000+ SQL/
NoSQL DBs
Custom code
ERP+ suites
Hardware
A few more
OSes
More
DBMSes
Custom code
ERP+ suites
Hardware
Lots more OSes
5,000+
databases
Componentized
suites
Custom code
Cloud layer
Hardware
More types
of OSes
10,000+ DBs +
blockchains
Multicloud layer
Suites as
services
Various SaaSes
Custom code
Hardware
A few
DBMSes
A few OSes
ERP+ suites
Custom code
Threat of more
application centric
sprawl
Early1990s Late 1990s 2000s 2010s1973-1990sPre 1970 2020s
PwC |Scaling the mirrorworld with the knowledge graph
Implications of semantic knowledge graphs
16
• Data modeling in graph form can become dynamic, reusable, and scalable.
• The same data model can be readily used conceptually, logically and physically,
in a write-once, use-anywhere fashion, and can be reused as semantic
metadata.
• Semantic metadata is both machine- and human-readable, can be encoded as
data and can live with the rest of the data at the data layer.
• With the help of knowledge graphs, techniques born in the world of web content
can be applied to other data + logic, across boundaries.
• Logic does not have to be trapped in applications, but can remain universally
accessible and callable via the data layer as part of reusable data models.
• Knowledge graph-driven development in this world can become a highly efficient
and scalable means of development, eliminating application and data silo sprawl.
PwC |Scaling the mirrorworld with the knowledge graph
Data-centric design at the micro level brings human and machines together, with
the humans helping the machines build and scale relationship data
17
Relationship logic to shared at scale needs to be created in human-machine feedback
loops and embedded in a standard form at the data layer for full reuse—not trapped in
app silos
Relationship-
sparse, but
highly
articulated
data context
that humans
need to help
machines
refine and
enrich
Relationship-
rich smart
data that
uses
description or
predicate
logic to scale
integration,
context and
interoperation
PwC |Scaling the mirrorworld with the knowledge graph
The key opportunity – Large-scale integration and model-driven intelligence in
a de-siloed and de-duplicated way
18
Previously dominant
Rule-based systems (includes KR)
Handcrafted knowledge” is the term DARPA
uses; rule-based programming + procedure
replication in process automation, + some
knowledge representation (KR)
• Strong on logical reasoning in specific
concrete contexts
- Procedural + declarative programming +
set theory, etc.
- Deterministic
• Can’t learn or abstract
• Still exceptionally common and useful
On the rise and rapidly improving
Statistical machine learning
• Probabilistic
• From Bayesian algorithms to neural nets
(yes, deep learning also)
• Strong on perceiving and learning
(classifying, predicting)
• Weak on abstracting and reasoning
• Quite powerful in the aggregate but
individually (instance by instance) unreliable
• Can require lots of data
Perceiving
Learning
Abstracting
Reasoning
Perceiving
Learning
Abstracting
Reasoning
Perceiving
Learning
Abstracting
Reasoning
Example: Consumer tax software Example: Facial recognition using
deep learning/neural nets
John Launchbury of DARPA (https://www.youtube.com/watch?v=N2L8AqkEDLs), Estes Park Group and PwC research, 2017
Nascent, just beginning
Contextualized, model-driven approach
• Contextualized modeling approach-allows
efficiency, precision and certainty
• Combines power of deterministic,
probabilistic and description logic
• Allows explanations to be added
to decisions
• Accelerates the training process with the
help of specific, contextual human input
• Takes less data
Example: Explains first how handwritten
letters are formed so machines can decide-
less data needed, more transparency.
PwC |Scaling the mirrorworld with the knowledge graph
The solution – Data-centric architecture reduces both application and
database sprawl
19
Trapped app code and databases
Application centric versus Data centric
Semantic model/rules
Data lake or hub
Applets   
Applications for execution only
Models exposed with the data
Use cases that point
the way forward
PwC |Scaling the mirrorworld with the knowledge graph
Largest changes in market cap by global company, cross industry, 2018
21
1. Change in market cap from IPO date
2. Market cap at IPO date
Source: Bloomberg and PwC analysis
• Other major tech, FS and pharma cos. are also working on cross-enterprise knowledge graphs
• Many have cross-enterprise knowledge graph ambitions, but most are focused on a single use case
• S&P does cross-enterprise data management using relational tech
Company name Location Industry
Change in market cap
2009 – 2018 ($bn)
Market cap
2018 ($bn)
1 Apple United States Technology 757 851
2 Amazon.Com United States Consumer Services 670 701
3 Alphabet United States Technology 609 719
4 Microsoft Corp United States Technology 540 703
5 Tencent Holdings China Technology 483 496
6 Facebook United States Technology 3831 464
7 Berkshire Hathaway United States Financial 358 492
8 Alibaba China Consumer Services 3021 470
9 JPMorgan Chase United States Financials 275 375
10 Bank of America United States Financials 263 307
Known knowledge
graph builders
Operator of
Taobao and AliBot
KG builder
Known KG
builders
The most value-creating companies in the world are using knowledge graphs
PwC |Scaling the mirrorworld with the knowledge graph
State of the art knowledge graph – Blue Brain Nexus (1 of 2)
22
How do scientists record the provenance, curate, share in open
source and collaborate on what they’re documented using 3D
imaging techniques generated with the help of a supercomputer,
such as the slices of a rat’s brain?
From the EPFL Blue Brain Portal Gallery, https://portal.bluebrain.epfl.ch/gallery-2/
PwC |Scaling the mirrorworld with the knowledge graph
Morgan Stanley’s operational risk model (simplified)
23
Jason Marburg, Morgan Stanley, and Michael Uschold, Semantic Arts, “Representing Operational Risk in an RDF Graph,” presented at Graphorum, October 16, 2019.
3p
vendor/supplier
3P service
ProcessTechnology
asset
Risk & control
self-assessment Risk in context
of a process
Control Incident
Issue
Action plan
This simplified diagram illustrates some of
the main concepts and relationships
articulated in Morgan Stanley’s
Operational Risk Ontology (ORO), which
consists of 350 classes, 350 properties,
and 800 relationships.
Semantic Arts, a PwC partner, led the
development of the ORO. PwC advised
Morgan Stanley on risk strategy and
information governance.
Is realization of
Is assessment of
Is assessment of
Depends upon
Depends upon
Is part of
Pertains to
failure of
Depends upon
Provided by RemediatesIs identified
Issue with
Is identified
Issue with
Has root cause
PwC |Scaling the mirrorworld with the knowledge graph
A semantic knowledge graph could enable the model-driven organization (a digital
twin) at the data layer
24
Step One: Model the relevant
elements of the organization, how
they relate to one another
and interoperate
Step Two: Embed the model where
it lives as machine-readable data
Step Three: Integrate the source
datasets as a target knowledge
graph with model-driven mappings
Step Four: Browse, query,
disambiguate, detect and discover
via the resulting knowledge graph
Capability
enables
process
Process uses
information
https://virtualdutchman.com/2018/10/14/moving-to-a-model-based-enterprise-the-business-model/
Clearvision, 2019. Used with permission.
Prog/proj
creates
information
Prog/proj
Supports
process
Prog/proj
Has person
Prog/proj
creates
technology
Person uses
process
Person uses
information
Person
creates
information
Person uses
technology
Person uses
capability
Capability uses
technology
Information
uses
technology
Technology
Supports
process
Prog/proj
has risk
Portfolio
has person
Risk owned
by personPerson
Identified risk
Company
employs person
Portfolio
Has prog/proj
Prog/proj
outputs
Work package
Prog/proj
Has role
Prog/proj
Has parente prog/pro
Company
Has prog/proj
Prog/proj
Delivers strategy
Prog/proj
Has milestone
Company
has portfolio
Strategy
has milestone
Company
Has role
Role needs
competenceWork package
Needs competence
Work
package
Process
Information
Person
Risk
Portfolio
Milestone
Strategy
Company
Role
Competence
Technology
Capability
Capability uses
information
Prog/proj
Uses information
Prog/proj
Uses technology
Prog/proj
delivers
capability
Prog/proj
Work Package
has person
Person has
competence
Conclusion:
Efficiencies
throughout the data
lifecycle
PwC |Scaling the mirrorworld with the knowledge graph
Knowledge graphs complete the picture of your transformed data lifecycle and how
it’s managed
26
pwc.com
Thanks for attending!
© 2019 PwC. All rights reserved. PwC refers to the US member firm or one of its subsidiaries or affiliates, and may sometimes refer to the PwC network. Each member firm is a separate legal entity.
Please see www.pwc.com/structure for further details.
Alan Morrison
PwC | Emerging Tech | Sr. Research Fellow
+1 (408) 205 5109
alan.s.morrison@pwc.com
https://www.linkedin.com/in/alanmorrison/
https://twitter.com/AlanMorrison
https://www.quora.com/profile/Alan-Morrison

More Related Content

What's hot

Data Catalog for Better Data Discovery and Governance
Data Catalog for Better Data Discovery and GovernanceData Catalog for Better Data Discovery and Governance
Data Catalog for Better Data Discovery and GovernanceDenodo
 
DAS Slides: Enterprise Architecture vs. Data Architecture
DAS Slides: Enterprise Architecture vs. Data ArchitectureDAS Slides: Enterprise Architecture vs. Data Architecture
DAS Slides: Enterprise Architecture vs. Data ArchitectureDATAVERSITY
 
Data Catalogs Are the Answer – What is the Question?
Data Catalogs Are the Answer – What is the Question?Data Catalogs Are the Answer – What is the Question?
Data Catalogs Are the Answer – What is the Question?DATAVERSITY
 
Introduction to Knowledge Graphs and Semantic AI
Introduction to Knowledge Graphs and Semantic AIIntroduction to Knowledge Graphs and Semantic AI
Introduction to Knowledge Graphs and Semantic AISemantic Web Company
 
Building a Data Strategy – Practical Steps for Aligning with Business Goals
Building a Data Strategy – Practical Steps for Aligning with Business GoalsBuilding a Data Strategy – Practical Steps for Aligning with Business Goals
Building a Data Strategy – Practical Steps for Aligning with Business GoalsDATAVERSITY
 
Emerging Trends in Data Architecture – What’s the Next Big Thing?
Emerging Trends in Data Architecture – What’s the Next Big Thing?Emerging Trends in Data Architecture – What’s the Next Big Thing?
Emerging Trends in Data Architecture – What’s the Next Big Thing?DATAVERSITY
 
Data Architecture, Solution Architecture, Platform Architecture — What’s the ...
Data Architecture, Solution Architecture, Platform Architecture — What’s the ...Data Architecture, Solution Architecture, Platform Architecture — What’s the ...
Data Architecture, Solution Architecture, Platform Architecture — What’s the ...DATAVERSITY
 
Data-Centric Business Transformation Using Knowledge Graphs
Data-Centric Business Transformation Using Knowledge GraphsData-Centric Business Transformation Using Knowledge Graphs
Data-Centric Business Transformation Using Knowledge GraphsAlan Morrison
 
Data Catalog as the Platform for Data Intelligence
Data Catalog as the Platform for Data IntelligenceData Catalog as the Platform for Data Intelligence
Data Catalog as the Platform for Data IntelligenceAlation
 
Introduction to Knowledge Graphs: Data Summit 2020
Introduction to Knowledge Graphs: Data Summit 2020Introduction to Knowledge Graphs: Data Summit 2020
Introduction to Knowledge Graphs: Data Summit 2020Enterprise Knowledge
 
Building the Modern Data Hub
Building the Modern Data HubBuilding the Modern Data Hub
Building the Modern Data HubDatavail
 
Your Roadmap for An Enterprise Graph Strategy
Your Roadmap for An Enterprise Graph StrategyYour Roadmap for An Enterprise Graph Strategy
Your Roadmap for An Enterprise Graph StrategyNeo4j
 
Impuls-Vortrag Data Strategy
Impuls-Vortrag Data StrategyImpuls-Vortrag Data Strategy
Impuls-Vortrag Data StrategyMarco Geuer
 
Enterprise Knowledge Graph
Enterprise Knowledge GraphEnterprise Knowledge Graph
Enterprise Knowledge GraphLukas Masuch
 
Big Data & Data Lakes Building Blocks
Big Data & Data Lakes Building BlocksBig Data & Data Lakes Building Blocks
Big Data & Data Lakes Building BlocksAmazon Web Services
 
Active Governance Across the Delta Lake with Alation
Active Governance Across the Delta Lake with AlationActive Governance Across the Delta Lake with Alation
Active Governance Across the Delta Lake with AlationDatabricks
 
Data Governance
Data GovernanceData Governance
Data GovernanceRob Lux
 
Data Lakehouse Symposium | Day 4
Data Lakehouse Symposium | Day 4Data Lakehouse Symposium | Day 4
Data Lakehouse Symposium | Day 4Databricks
 
Building a Data Strategy – Practical Steps for Aligning with Business Goals
Building a Data Strategy – Practical Steps for Aligning with Business GoalsBuilding a Data Strategy – Practical Steps for Aligning with Business Goals
Building a Data Strategy – Practical Steps for Aligning with Business GoalsDATAVERSITY
 
How to Use a Semantic Layer to Deliver Actionable Insights at Scale
How to Use a Semantic Layer to Deliver Actionable Insights at ScaleHow to Use a Semantic Layer to Deliver Actionable Insights at Scale
How to Use a Semantic Layer to Deliver Actionable Insights at ScaleDATAVERSITY
 

What's hot (20)

Data Catalog for Better Data Discovery and Governance
Data Catalog for Better Data Discovery and GovernanceData Catalog for Better Data Discovery and Governance
Data Catalog for Better Data Discovery and Governance
 
DAS Slides: Enterprise Architecture vs. Data Architecture
DAS Slides: Enterprise Architecture vs. Data ArchitectureDAS Slides: Enterprise Architecture vs. Data Architecture
DAS Slides: Enterprise Architecture vs. Data Architecture
 
Data Catalogs Are the Answer – What is the Question?
Data Catalogs Are the Answer – What is the Question?Data Catalogs Are the Answer – What is the Question?
Data Catalogs Are the Answer – What is the Question?
 
Introduction to Knowledge Graphs and Semantic AI
Introduction to Knowledge Graphs and Semantic AIIntroduction to Knowledge Graphs and Semantic AI
Introduction to Knowledge Graphs and Semantic AI
 
Building a Data Strategy – Practical Steps for Aligning with Business Goals
Building a Data Strategy – Practical Steps for Aligning with Business GoalsBuilding a Data Strategy – Practical Steps for Aligning with Business Goals
Building a Data Strategy – Practical Steps for Aligning with Business Goals
 
Emerging Trends in Data Architecture – What’s the Next Big Thing?
Emerging Trends in Data Architecture – What’s the Next Big Thing?Emerging Trends in Data Architecture – What’s the Next Big Thing?
Emerging Trends in Data Architecture – What’s the Next Big Thing?
 
Data Architecture, Solution Architecture, Platform Architecture — What’s the ...
Data Architecture, Solution Architecture, Platform Architecture — What’s the ...Data Architecture, Solution Architecture, Platform Architecture — What’s the ...
Data Architecture, Solution Architecture, Platform Architecture — What’s the ...
 
Data-Centric Business Transformation Using Knowledge Graphs
Data-Centric Business Transformation Using Knowledge GraphsData-Centric Business Transformation Using Knowledge Graphs
Data-Centric Business Transformation Using Knowledge Graphs
 
Data Catalog as the Platform for Data Intelligence
Data Catalog as the Platform for Data IntelligenceData Catalog as the Platform for Data Intelligence
Data Catalog as the Platform for Data Intelligence
 
Introduction to Knowledge Graphs: Data Summit 2020
Introduction to Knowledge Graphs: Data Summit 2020Introduction to Knowledge Graphs: Data Summit 2020
Introduction to Knowledge Graphs: Data Summit 2020
 
Building the Modern Data Hub
Building the Modern Data HubBuilding the Modern Data Hub
Building the Modern Data Hub
 
Your Roadmap for An Enterprise Graph Strategy
Your Roadmap for An Enterprise Graph StrategyYour Roadmap for An Enterprise Graph Strategy
Your Roadmap for An Enterprise Graph Strategy
 
Impuls-Vortrag Data Strategy
Impuls-Vortrag Data StrategyImpuls-Vortrag Data Strategy
Impuls-Vortrag Data Strategy
 
Enterprise Knowledge Graph
Enterprise Knowledge GraphEnterprise Knowledge Graph
Enterprise Knowledge Graph
 
Big Data & Data Lakes Building Blocks
Big Data & Data Lakes Building BlocksBig Data & Data Lakes Building Blocks
Big Data & Data Lakes Building Blocks
 
Active Governance Across the Delta Lake with Alation
Active Governance Across the Delta Lake with AlationActive Governance Across the Delta Lake with Alation
Active Governance Across the Delta Lake with Alation
 
Data Governance
Data GovernanceData Governance
Data Governance
 
Data Lakehouse Symposium | Day 4
Data Lakehouse Symposium | Day 4Data Lakehouse Symposium | Day 4
Data Lakehouse Symposium | Day 4
 
Building a Data Strategy – Practical Steps for Aligning with Business Goals
Building a Data Strategy – Practical Steps for Aligning with Business GoalsBuilding a Data Strategy – Practical Steps for Aligning with Business Goals
Building a Data Strategy – Practical Steps for Aligning with Business Goals
 
How to Use a Semantic Layer to Deliver Actionable Insights at Scale
How to Use a Semantic Layer to Deliver Actionable Insights at ScaleHow to Use a Semantic Layer to Deliver Actionable Insights at Scale
How to Use a Semantic Layer to Deliver Actionable Insights at Scale
 

Similar to Scaling the mirrorworld with knowledge graphs

The boom in Xaas and the knowledge graph
The boom in Xaas and the knowledge graphThe boom in Xaas and the knowledge graph
The boom in Xaas and the knowledge graphAlan Morrison
 
Data centric business and knowledge graph trends
Data centric business and knowledge graph trendsData centric business and knowledge graph trends
Data centric business and knowledge graph trendsAlan Morrison
 
DCAF 2023 1 and 2.pdf
DCAF 2023 1 and 2.pdfDCAF 2023 1 and 2.pdf
DCAF 2023 1 and 2.pdfAlan Morrison
 
FAIR data_ Superior data visibility and reuse without warehousing.pdf
FAIR data_ Superior data visibility and reuse without warehousing.pdfFAIR data_ Superior data visibility and reuse without warehousing.pdf
FAIR data_ Superior data visibility and reuse without warehousing.pdfAlan Morrison
 
Customer Presentation - IBM Cloud Pak for Data Overview (Level 100).PPTX
Customer Presentation - IBM Cloud Pak for Data Overview (Level 100).PPTXCustomer Presentation - IBM Cloud Pak for Data Overview (Level 100).PPTX
Customer Presentation - IBM Cloud Pak for Data Overview (Level 100).PPTXtsigitnist02
 
Insurtech, Cloud and Cybersecurity - Chartered Insurance Institute
Insurtech, Cloud and Cybersecurity -  Chartered Insurance InstituteInsurtech, Cloud and Cybersecurity -  Chartered Insurance Institute
Insurtech, Cloud and Cybersecurity - Chartered Insurance InstituteHenrique Centieiro
 
Cloud Computing - Is it the Future of ESI?
Cloud Computing - Is it the Future of ESI?Cloud Computing - Is it the Future of ESI?
Cloud Computing - Is it the Future of ESI?trentlivingston
 
John Mancini's Predictions for Information Management in 2015
John Mancini's Predictions for Information Management in 2015John Mancini's Predictions for Information Management in 2015
John Mancini's Predictions for Information Management in 2015AIIM International
 
Meetup 10 here&now_megatriscomp_design_methodparti_v1
Meetup 10 here&now_megatriscomp_design_methodparti_v1Meetup 10 here&now_megatriscomp_design_methodparti_v1
Meetup 10 here&now_megatriscomp_design_methodparti_v1Francesco Rago
 
Meetup 10 here&now: Megatris Comp design method (Part 1)
Meetup 10 here&now: Megatris Comp design method (Part 1)Meetup 10 here&now: Megatris Comp design method (Part 1)
Meetup 10 here&now: Megatris Comp design method (Part 1)Megatris Comp
 
Constellation Labs - Business Whitepaper
Constellation Labs - Business WhitepaperConstellation Labs - Business Whitepaper
Constellation Labs - Business Whitepaperrun_frictionless
 
Enabling the data driven enterprise
Enabling the data driven enterpriseEnabling the data driven enterprise
Enabling the data driven enterprisermikkilineni
 
Asyma E3 2014 The Impact of Cloud Computing on SME's
Asyma E3 2014   The Impact of Cloud Computing on SME'sAsyma E3 2014   The Impact of Cloud Computing on SME's
Asyma E3 2014 The Impact of Cloud Computing on SME'sasyma
 
Data-centric market status, case studies and outlook
Data-centric market status, case studies and outlookData-centric market status, case studies and outlook
Data-centric market status, case studies and outlookAlan Morrison
 
How to Become a Big Data Professional.pdf
How to Become a Big Data Professional.pdfHow to Become a Big Data Professional.pdf
How to Become a Big Data Professional.pdfCareervira
 
What is the future of data strategy?
What is the future of data strategy?What is the future of data strategy?
What is the future of data strategy?Denodo
 
Rethink Your 2021 Data Management Strategy with Data Virtualization (ASEAN)
Rethink Your 2021 Data Management Strategy with Data Virtualization (ASEAN)Rethink Your 2021 Data Management Strategy with Data Virtualization (ASEAN)
Rethink Your 2021 Data Management Strategy with Data Virtualization (ASEAN)Denodo
 
Wind River Studio Brochure.pdf
Wind River Studio Brochure.pdfWind River Studio Brochure.pdf
Wind River Studio Brochure.pdfJacob Mathew
 
Smart Data for Smart Labs
Smart Data for Smart Labs Smart Data for Smart Labs
Smart Data for Smart Labs OSTHUS
 

Similar to Scaling the mirrorworld with knowledge graphs (20)

The boom in Xaas and the knowledge graph
The boom in Xaas and the knowledge graphThe boom in Xaas and the knowledge graph
The boom in Xaas and the knowledge graph
 
Data centric business and knowledge graph trends
Data centric business and knowledge graph trendsData centric business and knowledge graph trends
Data centric business and knowledge graph trends
 
DCAF 2023 1 and 2.pdf
DCAF 2023 1 and 2.pdfDCAF 2023 1 and 2.pdf
DCAF 2023 1 and 2.pdf
 
FAIR data_ Superior data visibility and reuse without warehousing.pdf
FAIR data_ Superior data visibility and reuse without warehousing.pdfFAIR data_ Superior data visibility and reuse without warehousing.pdf
FAIR data_ Superior data visibility and reuse without warehousing.pdf
 
SegmentOfOne
SegmentOfOneSegmentOfOne
SegmentOfOne
 
Customer Presentation - IBM Cloud Pak for Data Overview (Level 100).PPTX
Customer Presentation - IBM Cloud Pak for Data Overview (Level 100).PPTXCustomer Presentation - IBM Cloud Pak for Data Overview (Level 100).PPTX
Customer Presentation - IBM Cloud Pak for Data Overview (Level 100).PPTX
 
Insurtech, Cloud and Cybersecurity - Chartered Insurance Institute
Insurtech, Cloud and Cybersecurity -  Chartered Insurance InstituteInsurtech, Cloud and Cybersecurity -  Chartered Insurance Institute
Insurtech, Cloud and Cybersecurity - Chartered Insurance Institute
 
Cloud Computing - Is it the Future of ESI?
Cloud Computing - Is it the Future of ESI?Cloud Computing - Is it the Future of ESI?
Cloud Computing - Is it the Future of ESI?
 
John Mancini's Predictions for Information Management in 2015
John Mancini's Predictions for Information Management in 2015John Mancini's Predictions for Information Management in 2015
John Mancini's Predictions for Information Management in 2015
 
Meetup 10 here&now_megatriscomp_design_methodparti_v1
Meetup 10 here&now_megatriscomp_design_methodparti_v1Meetup 10 here&now_megatriscomp_design_methodparti_v1
Meetup 10 here&now_megatriscomp_design_methodparti_v1
 
Meetup 10 here&now: Megatris Comp design method (Part 1)
Meetup 10 here&now: Megatris Comp design method (Part 1)Meetup 10 here&now: Megatris Comp design method (Part 1)
Meetup 10 here&now: Megatris Comp design method (Part 1)
 
Constellation Labs - Business Whitepaper
Constellation Labs - Business WhitepaperConstellation Labs - Business Whitepaper
Constellation Labs - Business Whitepaper
 
Enabling the data driven enterprise
Enabling the data driven enterpriseEnabling the data driven enterprise
Enabling the data driven enterprise
 
Asyma E3 2014 The Impact of Cloud Computing on SME's
Asyma E3 2014   The Impact of Cloud Computing on SME'sAsyma E3 2014   The Impact of Cloud Computing on SME's
Asyma E3 2014 The Impact of Cloud Computing on SME's
 
Data-centric market status, case studies and outlook
Data-centric market status, case studies and outlookData-centric market status, case studies and outlook
Data-centric market status, case studies and outlook
 
How to Become a Big Data Professional.pdf
How to Become a Big Data Professional.pdfHow to Become a Big Data Professional.pdf
How to Become a Big Data Professional.pdf
 
What is the future of data strategy?
What is the future of data strategy?What is the future of data strategy?
What is the future of data strategy?
 
Rethink Your 2021 Data Management Strategy with Data Virtualization (ASEAN)
Rethink Your 2021 Data Management Strategy with Data Virtualization (ASEAN)Rethink Your 2021 Data Management Strategy with Data Virtualization (ASEAN)
Rethink Your 2021 Data Management Strategy with Data Virtualization (ASEAN)
 
Wind River Studio Brochure.pdf
Wind River Studio Brochure.pdfWind River Studio Brochure.pdf
Wind River Studio Brochure.pdf
 
Smart Data for Smart Labs
Smart Data for Smart Labs Smart Data for Smart Labs
Smart Data for Smart Labs
 

More from Alan Morrison

The FAIR data movement and 22 Feb 2023.pdf
The FAIR data movement and 22 Feb 2023.pdfThe FAIR data movement and 22 Feb 2023.pdf
The FAIR data movement and 22 Feb 2023.pdfAlan Morrison
 
DCA Symposium 6 Feb 2023.pdf
DCA Symposium 6 Feb 2023.pdfDCA Symposium 6 Feb 2023.pdf
DCA Symposium 6 Feb 2023.pdfAlan Morrison
 
Graph Foundations for Advanced Analytics and Collaboration
Graph Foundations for Advanced Analytics and CollaborationGraph Foundations for Advanced Analytics and Collaboration
Graph Foundations for Advanced Analytics and CollaborationAlan Morrison
 
Dcaf transformation & kg adoption 2022 -alan morrison
Dcaf transformation & kg adoption 2022 -alan morrisonDcaf transformation & kg adoption 2022 -alan morrison
Dcaf transformation & kg adoption 2022 -alan morrisonAlan Morrison
 
Paths to more personal and collaborative knowledge graphs
Paths to more personal and collaborative knowledge graphsPaths to more personal and collaborative knowledge graphs
Paths to more personal and collaborative knowledge graphsAlan Morrison
 
Blockchain demystified
Blockchain demystifiedBlockchain demystified
Blockchain demystifiedAlan Morrison
 

More from Alan Morrison (6)

The FAIR data movement and 22 Feb 2023.pdf
The FAIR data movement and 22 Feb 2023.pdfThe FAIR data movement and 22 Feb 2023.pdf
The FAIR data movement and 22 Feb 2023.pdf
 
DCA Symposium 6 Feb 2023.pdf
DCA Symposium 6 Feb 2023.pdfDCA Symposium 6 Feb 2023.pdf
DCA Symposium 6 Feb 2023.pdf
 
Graph Foundations for Advanced Analytics and Collaboration
Graph Foundations for Advanced Analytics and CollaborationGraph Foundations for Advanced Analytics and Collaboration
Graph Foundations for Advanced Analytics and Collaboration
 
Dcaf transformation & kg adoption 2022 -alan morrison
Dcaf transformation & kg adoption 2022 -alan morrisonDcaf transformation & kg adoption 2022 -alan morrison
Dcaf transformation & kg adoption 2022 -alan morrison
 
Paths to more personal and collaborative knowledge graphs
Paths to more personal and collaborative knowledge graphsPaths to more personal and collaborative knowledge graphs
Paths to more personal and collaborative knowledge graphs
 
Blockchain demystified
Blockchain demystifiedBlockchain demystified
Blockchain demystified
 

Recently uploaded

Dev Dives: Streamline document processing with UiPath Studio Web
Dev Dives: Streamline document processing with UiPath Studio WebDev Dives: Streamline document processing with UiPath Studio Web
Dev Dives: Streamline document processing with UiPath Studio WebUiPathCommunity
 
Training state-of-the-art general text embedding
Training state-of-the-art general text embeddingTraining state-of-the-art general text embedding
Training state-of-the-art general text embeddingZilliz
 
New from BookNet Canada for 2024: BNC CataList - Tech Forum 2024
New from BookNet Canada for 2024: BNC CataList - Tech Forum 2024New from BookNet Canada for 2024: BNC CataList - Tech Forum 2024
New from BookNet Canada for 2024: BNC CataList - Tech Forum 2024BookNet Canada
 
Tampa BSides - Chef's Tour of Microsoft Security Adoption Framework (SAF)
Tampa BSides - Chef's Tour of Microsoft Security Adoption Framework (SAF)Tampa BSides - Chef's Tour of Microsoft Security Adoption Framework (SAF)
Tampa BSides - Chef's Tour of Microsoft Security Adoption Framework (SAF)Mark Simos
 
Human Factors of XR: Using Human Factors to Design XR Systems
Human Factors of XR: Using Human Factors to Design XR SystemsHuman Factors of XR: Using Human Factors to Design XR Systems
Human Factors of XR: Using Human Factors to Design XR SystemsMark Billinghurst
 
WordPress Websites for Engineers: Elevate Your Brand
WordPress Websites for Engineers: Elevate Your BrandWordPress Websites for Engineers: Elevate Your Brand
WordPress Websites for Engineers: Elevate Your Brandgvaughan
 
Integration and Automation in Practice: CI/CD in Mule Integration and Automat...
Integration and Automation in Practice: CI/CD in Mule Integration and Automat...Integration and Automation in Practice: CI/CD in Mule Integration and Automat...
Integration and Automation in Practice: CI/CD in Mule Integration and Automat...Patryk Bandurski
 
Story boards and shot lists for my a level piece
Story boards and shot lists for my a level pieceStory boards and shot lists for my a level piece
Story boards and shot lists for my a level piececharlottematthew16
 
Advanced Test Driven-Development @ php[tek] 2024
Advanced Test Driven-Development @ php[tek] 2024Advanced Test Driven-Development @ php[tek] 2024
Advanced Test Driven-Development @ php[tek] 2024Scott Keck-Warren
 
Vector Databases 101 - An introduction to the world of Vector Databases
Vector Databases 101 - An introduction to the world of Vector DatabasesVector Databases 101 - An introduction to the world of Vector Databases
Vector Databases 101 - An introduction to the world of Vector DatabasesZilliz
 
Install Stable Diffusion in windows machine
Install Stable Diffusion in windows machineInstall Stable Diffusion in windows machine
Install Stable Diffusion in windows machinePadma Pradeep
 
Scanning the Internet for External Cloud Exposures via SSL Certs
Scanning the Internet for External Cloud Exposures via SSL CertsScanning the Internet for External Cloud Exposures via SSL Certs
Scanning the Internet for External Cloud Exposures via SSL CertsRizwan Syed
 
Anypoint Exchange: It’s Not Just a Repo!
Anypoint Exchange: It’s Not Just a Repo!Anypoint Exchange: It’s Not Just a Repo!
Anypoint Exchange: It’s Not Just a Repo!Manik S Magar
 
Connect Wave/ connectwave Pitch Deck Presentation
Connect Wave/ connectwave Pitch Deck PresentationConnect Wave/ connectwave Pitch Deck Presentation
Connect Wave/ connectwave Pitch Deck PresentationSlibray Presentation
 
"Federated learning: out of reach no matter how close",Oleksandr Lapshyn
"Federated learning: out of reach no matter how close",Oleksandr Lapshyn"Federated learning: out of reach no matter how close",Oleksandr Lapshyn
"Federated learning: out of reach no matter how close",Oleksandr LapshynFwdays
 
Powerpoint exploring the locations used in television show Time Clash
Powerpoint exploring the locations used in television show Time ClashPowerpoint exploring the locations used in television show Time Clash
Powerpoint exploring the locations used in television show Time Clashcharlottematthew16
 
The Future of Software Development - Devin AI Innovative Approach.pdf
The Future of Software Development - Devin AI Innovative Approach.pdfThe Future of Software Development - Devin AI Innovative Approach.pdf
The Future of Software Development - Devin AI Innovative Approach.pdfSeasiaInfotech2
 
Beyond Boundaries: Leveraging No-Code Solutions for Industry Innovation
Beyond Boundaries: Leveraging No-Code Solutions for Industry InnovationBeyond Boundaries: Leveraging No-Code Solutions for Industry Innovation
Beyond Boundaries: Leveraging No-Code Solutions for Industry InnovationSafe Software
 

Recently uploaded (20)

Dev Dives: Streamline document processing with UiPath Studio Web
Dev Dives: Streamline document processing with UiPath Studio WebDev Dives: Streamline document processing with UiPath Studio Web
Dev Dives: Streamline document processing with UiPath Studio Web
 
E-Vehicle_Hacking_by_Parul Sharma_null_owasp.pptx
E-Vehicle_Hacking_by_Parul Sharma_null_owasp.pptxE-Vehicle_Hacking_by_Parul Sharma_null_owasp.pptx
E-Vehicle_Hacking_by_Parul Sharma_null_owasp.pptx
 
Training state-of-the-art general text embedding
Training state-of-the-art general text embeddingTraining state-of-the-art general text embedding
Training state-of-the-art general text embedding
 
New from BookNet Canada for 2024: BNC CataList - Tech Forum 2024
New from BookNet Canada for 2024: BNC CataList - Tech Forum 2024New from BookNet Canada for 2024: BNC CataList - Tech Forum 2024
New from BookNet Canada for 2024: BNC CataList - Tech Forum 2024
 
Tampa BSides - Chef's Tour of Microsoft Security Adoption Framework (SAF)
Tampa BSides - Chef's Tour of Microsoft Security Adoption Framework (SAF)Tampa BSides - Chef's Tour of Microsoft Security Adoption Framework (SAF)
Tampa BSides - Chef's Tour of Microsoft Security Adoption Framework (SAF)
 
Human Factors of XR: Using Human Factors to Design XR Systems
Human Factors of XR: Using Human Factors to Design XR SystemsHuman Factors of XR: Using Human Factors to Design XR Systems
Human Factors of XR: Using Human Factors to Design XR Systems
 
WordPress Websites for Engineers: Elevate Your Brand
WordPress Websites for Engineers: Elevate Your BrandWordPress Websites for Engineers: Elevate Your Brand
WordPress Websites for Engineers: Elevate Your Brand
 
Integration and Automation in Practice: CI/CD in Mule Integration and Automat...
Integration and Automation in Practice: CI/CD in Mule Integration and Automat...Integration and Automation in Practice: CI/CD in Mule Integration and Automat...
Integration and Automation in Practice: CI/CD in Mule Integration and Automat...
 
Story boards and shot lists for my a level piece
Story boards and shot lists for my a level pieceStory boards and shot lists for my a level piece
Story boards and shot lists for my a level piece
 
DMCC Future of Trade Web3 - Special Edition
DMCC Future of Trade Web3 - Special EditionDMCC Future of Trade Web3 - Special Edition
DMCC Future of Trade Web3 - Special Edition
 
Advanced Test Driven-Development @ php[tek] 2024
Advanced Test Driven-Development @ php[tek] 2024Advanced Test Driven-Development @ php[tek] 2024
Advanced Test Driven-Development @ php[tek] 2024
 
Vector Databases 101 - An introduction to the world of Vector Databases
Vector Databases 101 - An introduction to the world of Vector DatabasesVector Databases 101 - An introduction to the world of Vector Databases
Vector Databases 101 - An introduction to the world of Vector Databases
 
Install Stable Diffusion in windows machine
Install Stable Diffusion in windows machineInstall Stable Diffusion in windows machine
Install Stable Diffusion in windows machine
 
Scanning the Internet for External Cloud Exposures via SSL Certs
Scanning the Internet for External Cloud Exposures via SSL CertsScanning the Internet for External Cloud Exposures via SSL Certs
Scanning the Internet for External Cloud Exposures via SSL Certs
 
Anypoint Exchange: It’s Not Just a Repo!
Anypoint Exchange: It’s Not Just a Repo!Anypoint Exchange: It’s Not Just a Repo!
Anypoint Exchange: It’s Not Just a Repo!
 
Connect Wave/ connectwave Pitch Deck Presentation
Connect Wave/ connectwave Pitch Deck PresentationConnect Wave/ connectwave Pitch Deck Presentation
Connect Wave/ connectwave Pitch Deck Presentation
 
"Federated learning: out of reach no matter how close",Oleksandr Lapshyn
"Federated learning: out of reach no matter how close",Oleksandr Lapshyn"Federated learning: out of reach no matter how close",Oleksandr Lapshyn
"Federated learning: out of reach no matter how close",Oleksandr Lapshyn
 
Powerpoint exploring the locations used in television show Time Clash
Powerpoint exploring the locations used in television show Time ClashPowerpoint exploring the locations used in television show Time Clash
Powerpoint exploring the locations used in television show Time Clash
 
The Future of Software Development - Devin AI Innovative Approach.pdf
The Future of Software Development - Devin AI Innovative Approach.pdfThe Future of Software Development - Devin AI Innovative Approach.pdf
The Future of Software Development - Devin AI Innovative Approach.pdf
 
Beyond Boundaries: Leveraging No-Code Solutions for Industry Innovation
Beyond Boundaries: Leveraging No-Code Solutions for Industry InnovationBeyond Boundaries: Leveraging No-Code Solutions for Industry Innovation
Beyond Boundaries: Leveraging No-Code Solutions for Industry Innovation
 

Scaling the mirrorworld with knowledge graphs

  • 1. Alan Morrison SWC Webinar 23 October 2019 Scaling the mirrorworld with knowledge graphs
  • 2. PwC |Scaling the mirrorworld with the knowledge graph Agenda 2 The mirrorworld vision How graphs will begin to underlay the mirrorworld Why semantic graphs are more efficient Use cases that point the way forward Conclusion: Efficiencies throughout the data lifecycle
  • 4. PwC |Scaling the mirrorworld with the knowledge graph Definitions Content = Meaningful, human-readable data + logic in the form of text, images, audio, video (or combinations of these) Knowledge graphs = Meaningful, machine readable data + logic in the form of any-to-any connected, contextualized entities, their properties and relationships Content can be modeled and then read by machines the same way as other data + logic. The same techniques can apply.
  • 5. PwC |Scaling the mirrorworld with the knowledge graph In the mirrorworld, everything will have a paired twin. Kevin Kelly in Wired Feb 12, 2019 June 2019 5
  • 6. PwC |Scaling the mirrorworld with the knowledge graph What’s a digital twin? Depends on who you ask 6 GE: “At its core, the Digital Twin consists of sophisticated models or system of models based on deep domain knowledge of specific industrial assets. The Digital Twin is informed by a massive amount of design, manufacturing, inspection, repair, online sensor and operational data.” Goals: Predictive analytics, knowledge representation, etc. From “What is a digital twin?” GE Digital, 2019 Finger Food, “We Are Industry-leading Digital Twin Holographic Service Providers…. Imagine taking all of your disparate data sets from multiple spreadsheets and diagrams and combining them into one live-streaming visual holographic representation of your data – at full scale.” Goals: “We can take your data from your spreadsheets and turn it into clear, actionable context like never before…” From “Digital Twin Solutions to Improve your Bottom Line,” Finger Food Advanced Technology Group,“ 2019
  • 7. PwC |Scaling the mirrorworld with the knowledge graph Consider how long it took to build out the world’s oil & gas infrastructure. Now think about where we are with traditional data management: • How do we free ourselves from legacy IT? • How do we build sharable digital twins? • How do we scale a shared data infrastructure? The mirrorworld poses a massive global data infrastructure challenge 7
  • 8. PwC |Scaling the mirrorworld with the knowledge graph Why treating smart data as a strategic asset is so critical right now 8 Challenge of the 2020s: Feeding your AIs enough relevant, quality data • Emerging tech often gets adopted just in pockets, • That’s particularly the case with AI. • Retraining, hiring new people, or buying more tools isn’t enough. • Many never figure out how to take advantage of important AI-enabling tech. They’ll just use it in ad- hoc projects or subscribe to AI-enhanced apps. • But the impact on decision making will be minimal without an industrial-scale approach to data and flow. Opportunity of the 2020s: Pipelines, distribution networks and volumes of quality, contextualized smart data flowing to the point of need The challenge we face is the same as the oil and gas industry faced in the 1920s: • Collecting enough raw material • Refining and enriching it • Distributing it to the places that need it most • Creating enough supply to generate massive demand and drive down the cost of AI
  • 9. How graphs will begin to underlay the mirrorworld
  • 10. PwC |Scaling the mirrorworld with the knowledge graph Emerging techs – How are all these things interrelated? Are they addressable too? Knowledge graphs—the manifestation of a data- centric architecture--can empower the other technologies in these ways: 1. Accelerate machine learning training set development 2. Enable multi-domain virtual assistants/chatbots 3. Add reasoning to conversational ai platforms 4. Become means of sharing and interoperation of digital twins 10
  • 11. PwC |Scaling the mirrorworld with the knowledge graph Emerging markets — related to most relevant hype cycle techs 11 Total projected revenue: $58.2 billion (2021) Source: Tractica, Grandview Research and PwC analysis, 2019
  • 12. PwC |Scaling the mirrorworld with the knowledge graph Summary: A very large available market, but of course there’s a catch…. 12 4% 5% 5% 8% 8% 9% 14% 13% 8% 26% Summary of global target markets for knowledge graph technology, 2021 Digital twins PaaS--data mgmt. DaaS (org. domain) Virtual assistants Conversational AI Deep learning PaaS--integration, orchestration Info mgmt software Integration software DBMS software Total: $205 Billion Sources: Gartner (hype cycle only), IDC, Tractica, PwC analysis, 2019
  • 13. Why semantic graphs are more efficient
  • 14. PwC |Scaling the mirrorworld with the knowledge graph Why traditional data management doesn’t scale 14 1. Relational databases don’t treat relationship data as a first-class citizen 2. As a result, most companies have buried or are missing the relationship data they need for contextualization 3. Tables alone don’t help you dynamically model your data or share the models 4. Managing large numbers of tables soon gets unwieldy 5. Limiting your database resources to tabular methods ensures you won’t take full advantage of today’s compute, networking and storage Relationship richness Relationship sparseness Static selective fragmented labor intensive Additive Index friendly Immutable versioning possible More dynamic More inclusive More integrated More machine assisted Relational: Row and column headers And up-front taxonomies Document: Nested, cumulative hierarchies Graph: Any-to-any relationships PwC, 2016 When overused, RDBMSes perpetuate the provincial data mentality of the 1980s, back when computing didn’t scale Lots of data is missing from relational datasets—namely the contextual clues needed for disambiguation via entity resolution and, therefore, large-scale integration
  • 15. PwC |Scaling the mirrorworld with the knowledge graph The consequence of logic and data siloing – App-centric system-level complexity and disconnectedness spinning out of control (Result – Table and code sprawl) 15 Hardware DBMS OS Custom code Hardware Lots of OSes 1,000+ SQL/ NoSQL DBs Custom code ERP+ suites Hardware A few more OSes More DBMSes Custom code ERP+ suites Hardware Lots more OSes 5,000+ databases Componentized suites Custom code Cloud layer Hardware More types of OSes 10,000+ DBs + blockchains Multicloud layer Suites as services Various SaaSes Custom code Hardware A few DBMSes A few OSes ERP+ suites Custom code Threat of more application centric sprawl Early1990s Late 1990s 2000s 2010s1973-1990sPre 1970 2020s
  • 16. PwC |Scaling the mirrorworld with the knowledge graph Implications of semantic knowledge graphs 16 • Data modeling in graph form can become dynamic, reusable, and scalable. • The same data model can be readily used conceptually, logically and physically, in a write-once, use-anywhere fashion, and can be reused as semantic metadata. • Semantic metadata is both machine- and human-readable, can be encoded as data and can live with the rest of the data at the data layer. • With the help of knowledge graphs, techniques born in the world of web content can be applied to other data + logic, across boundaries. • Logic does not have to be trapped in applications, but can remain universally accessible and callable via the data layer as part of reusable data models. • Knowledge graph-driven development in this world can become a highly efficient and scalable means of development, eliminating application and data silo sprawl.
  • 17. PwC |Scaling the mirrorworld with the knowledge graph Data-centric design at the micro level brings human and machines together, with the humans helping the machines build and scale relationship data 17 Relationship logic to shared at scale needs to be created in human-machine feedback loops and embedded in a standard form at the data layer for full reuse—not trapped in app silos Relationship- sparse, but highly articulated data context that humans need to help machines refine and enrich Relationship- rich smart data that uses description or predicate logic to scale integration, context and interoperation
  • 18. PwC |Scaling the mirrorworld with the knowledge graph The key opportunity – Large-scale integration and model-driven intelligence in a de-siloed and de-duplicated way 18 Previously dominant Rule-based systems (includes KR) Handcrafted knowledge” is the term DARPA uses; rule-based programming + procedure replication in process automation, + some knowledge representation (KR) • Strong on logical reasoning in specific concrete contexts - Procedural + declarative programming + set theory, etc. - Deterministic • Can’t learn or abstract • Still exceptionally common and useful On the rise and rapidly improving Statistical machine learning • Probabilistic • From Bayesian algorithms to neural nets (yes, deep learning also) • Strong on perceiving and learning (classifying, predicting) • Weak on abstracting and reasoning • Quite powerful in the aggregate but individually (instance by instance) unreliable • Can require lots of data Perceiving Learning Abstracting Reasoning Perceiving Learning Abstracting Reasoning Perceiving Learning Abstracting Reasoning Example: Consumer tax software Example: Facial recognition using deep learning/neural nets John Launchbury of DARPA (https://www.youtube.com/watch?v=N2L8AqkEDLs), Estes Park Group and PwC research, 2017 Nascent, just beginning Contextualized, model-driven approach • Contextualized modeling approach-allows efficiency, precision and certainty • Combines power of deterministic, probabilistic and description logic • Allows explanations to be added to decisions • Accelerates the training process with the help of specific, contextual human input • Takes less data Example: Explains first how handwritten letters are formed so machines can decide- less data needed, more transparency.
  • 19. PwC |Scaling the mirrorworld with the knowledge graph The solution – Data-centric architecture reduces both application and database sprawl 19 Trapped app code and databases Application centric versus Data centric Semantic model/rules Data lake or hub Applets    Applications for execution only Models exposed with the data
  • 20. Use cases that point the way forward
  • 21. PwC |Scaling the mirrorworld with the knowledge graph Largest changes in market cap by global company, cross industry, 2018 21 1. Change in market cap from IPO date 2. Market cap at IPO date Source: Bloomberg and PwC analysis • Other major tech, FS and pharma cos. are also working on cross-enterprise knowledge graphs • Many have cross-enterprise knowledge graph ambitions, but most are focused on a single use case • S&P does cross-enterprise data management using relational tech Company name Location Industry Change in market cap 2009 – 2018 ($bn) Market cap 2018 ($bn) 1 Apple United States Technology 757 851 2 Amazon.Com United States Consumer Services 670 701 3 Alphabet United States Technology 609 719 4 Microsoft Corp United States Technology 540 703 5 Tencent Holdings China Technology 483 496 6 Facebook United States Technology 3831 464 7 Berkshire Hathaway United States Financial 358 492 8 Alibaba China Consumer Services 3021 470 9 JPMorgan Chase United States Financials 275 375 10 Bank of America United States Financials 263 307 Known knowledge graph builders Operator of Taobao and AliBot KG builder Known KG builders The most value-creating companies in the world are using knowledge graphs
  • 22. PwC |Scaling the mirrorworld with the knowledge graph State of the art knowledge graph – Blue Brain Nexus (1 of 2) 22 How do scientists record the provenance, curate, share in open source and collaborate on what they’re documented using 3D imaging techniques generated with the help of a supercomputer, such as the slices of a rat’s brain? From the EPFL Blue Brain Portal Gallery, https://portal.bluebrain.epfl.ch/gallery-2/
  • 23. PwC |Scaling the mirrorworld with the knowledge graph Morgan Stanley’s operational risk model (simplified) 23 Jason Marburg, Morgan Stanley, and Michael Uschold, Semantic Arts, “Representing Operational Risk in an RDF Graph,” presented at Graphorum, October 16, 2019. 3p vendor/supplier 3P service ProcessTechnology asset Risk & control self-assessment Risk in context of a process Control Incident Issue Action plan This simplified diagram illustrates some of the main concepts and relationships articulated in Morgan Stanley’s Operational Risk Ontology (ORO), which consists of 350 classes, 350 properties, and 800 relationships. Semantic Arts, a PwC partner, led the development of the ORO. PwC advised Morgan Stanley on risk strategy and information governance. Is realization of Is assessment of Is assessment of Depends upon Depends upon Is part of Pertains to failure of Depends upon Provided by RemediatesIs identified Issue with Is identified Issue with Has root cause
  • 24. PwC |Scaling the mirrorworld with the knowledge graph A semantic knowledge graph could enable the model-driven organization (a digital twin) at the data layer 24 Step One: Model the relevant elements of the organization, how they relate to one another and interoperate Step Two: Embed the model where it lives as machine-readable data Step Three: Integrate the source datasets as a target knowledge graph with model-driven mappings Step Four: Browse, query, disambiguate, detect and discover via the resulting knowledge graph Capability enables process Process uses information https://virtualdutchman.com/2018/10/14/moving-to-a-model-based-enterprise-the-business-model/ Clearvision, 2019. Used with permission. Prog/proj creates information Prog/proj Supports process Prog/proj Has person Prog/proj creates technology Person uses process Person uses information Person creates information Person uses technology Person uses capability Capability uses technology Information uses technology Technology Supports process Prog/proj has risk Portfolio has person Risk owned by personPerson Identified risk Company employs person Portfolio Has prog/proj Prog/proj outputs Work package Prog/proj Has role Prog/proj Has parente prog/pro Company Has prog/proj Prog/proj Delivers strategy Prog/proj Has milestone Company has portfolio Strategy has milestone Company Has role Role needs competenceWork package Needs competence Work package Process Information Person Risk Portfolio Milestone Strategy Company Role Competence Technology Capability Capability uses information Prog/proj Uses information Prog/proj Uses technology Prog/proj delivers capability Prog/proj Work Package has person Person has competence
  • 26. PwC |Scaling the mirrorworld with the knowledge graph Knowledge graphs complete the picture of your transformed data lifecycle and how it’s managed 26
  • 27. pwc.com Thanks for attending! © 2019 PwC. All rights reserved. PwC refers to the US member firm or one of its subsidiaries or affiliates, and may sometimes refer to the PwC network. Each member firm is a separate legal entity. Please see www.pwc.com/structure for further details. Alan Morrison PwC | Emerging Tech | Sr. Research Fellow +1 (408) 205 5109 alan.s.morrison@pwc.com https://www.linkedin.com/in/alanmorrison/ https://twitter.com/AlanMorrison https://www.quora.com/profile/Alan-Morrison