This document presents a study on automating the classification of satellite and land cover images using deep learning techniques, specifically convolutional neural networks (CNNs). The proposed system integrates various tools like TensorFlow and other deep learning libraries to enhance the accuracy and efficiency of object detection and classification in satellite imagery. It also details the methodology, system architecture, and the importance of dataset quality for improving model performance, alongside experimental results demonstrating the system's capabilities.
![International Journal of Trend in Scientific Research and Development (IJTSRD)
Volume 4 Issue 5, July-August 2020 Available Online: www.ijtsrd.com e-ISSN: 2456 – 6470
@ IJTSRD | Unique Paper ID – IJTSRD32912 | Volume – 4 | Issue – 5 | July-August 2020 Page 651
Satellite and Land Cover Image
Classification using Deep Learning
Roshni Rajendran1, Liji Samuel2
1M Tech Student, 2Assistant Professor,
1,2Department of Computer Science and Engineering,
1,2Sree Buddha College of Engineering, Padanilam, Kerala, India
ABSTRACT
Satellite imagery is very significant for many applications including disaster
response, law enforcement and environmental monitoring.Theseapplications
require the manual identification of objects and facilities in the imagery.
Because the geographic area to be covered are greatand the analystsavailable
to conduct the searchesare few, automation is required. Thetraditionalobject
detection and classification algorithms are too inaccurate, takes a lot of time
and unreliable to solve the problem. Deep learning is a family of machine
learning algorithms that can be used for the automation of such tasks. It has
achieved success in image classification by using convolutional neural
networks. The problem of objectand facility classification in satellite imagery
is considered. The system is developed by using various facilities like Tensor
Flow, XAMPP, FLASK and other various deep learning libraries.
KEYWORDS: Deep Learning, Convolutional neural network, VGG, GPU, Tensor
Flow, Random forest algorithm
How to cite this paper: Roshni Rajendran
| Liji Samuel "Satellite and Land Cover
Image Classification usingDeepLearning"
Published in
International Journal
of Trend in Scientific
Research and
Development(ijtsrd),
ISSN: 2456-6470,
Volume-4 | Issue-5,
August 2020, pp.651-
655, URL:
www.ijtsrd.com/papers/ijtsrd32912.pdf
Copyright © 2020 by author(s) and
International Journal of TrendinScientific
Research and Development Journal. This
is an Open Access article distributed
under the terms of
the Creative
Commons Attribution
License (CC BY 4.0)
(http://creativecommons.org/licenses/by
/4.0)
INTRODUCTION
Deep learning is a class of machine learning models that
represent data at different levels of abstraction by means of
multiple processing layers. It has achieved astonishing
success in object detection and classification by combining
large neural network models, called CNN withpowerfulGPU.
A CNN isa deep learningalgorithmwhich can takeinaninput
image, assign importance (learnable weights and biases) to
various aspects/objects in the image and be able to
differentiateone from the other. The pre-processingrequired
in a CNN is much lower as compared to other classification
algorithms. While in primitive methods filters are hand-
engineered, with enough training, CNN have the ability to
learn these filters/characteristics.
The architecture of a CNN is analogous to that of the
connectivity pattern ofNeuronsinthe HumanBrainandwas
inspired by the organization of the Visual Cortex. Individual
neurons respond to stimuli only in a restricted region of the
visualfield knownas theReceptiveField. Acollection of such
fields overlaps to cover the entire visual area.
CNN-based algorithms have dominatedtheannualImageNet
Large Scale Visual Recognition Challenge for detecting and
classifying objectsin photographs.This success hascauseda
revolution in image understanding, and the major
technology companies, including Google, Microsoft and
Facebook, have already deployed CNN-based products and
services.
A CNN consists of a series of processing layers as shown in
Fig. 1. Each layer isa family of convolution filters that detect
image features.Near the end of the series, the CNNcombines
the detector outputs in fully connected “dense” layers,finally
producing a set of predicted probabilities, one for eachclass.
The objective of the convolution operation is to extract the
high-level features suchas edges,from the input image. CNN
need not be limited to only one Convolutional Layer.
Conventionally, thefirstCNN is responsibleforcapturingthe
Low-Levelfeaturessuchasedges, color, gradientorientation,
etc [3]. With added layers, the architecture adapts to the
High-Level features as well, giving us a network, which has
the wholesome understanding of images in the dataset,
similar tohow wewould. Unlike older methods like SIFTand
HOG, CNNs do not require the algorithm designer to
engineer feature detectors. The network itself learns which
features to detect, and how to detect them, as it trains.
Figure 1 System model
IJTSRD32912](https://image.slidesharecdn.com/118satelliteandlandcoverimageclassificationusingdeeplearning-200919105359/85/Satellite-and-Land-Cover-Image-Classification-using-Deep-Learning-1-320.jpg)
![International Journal of Trend in Scientific Research and Development (IJTSRD) @ www.ijtsrd.com eISSN: 2456-6470
@ IJTSRD | Unique Paper ID – IJTSRD32912 | Volume – 4 | Issue – 5 | July-August 2020 Page 652
Such large CNNs require computational power, which is
provided by advanced GPUs. Open source deep learning
software libraries suchas Tensor Flow and Keras,alongwith
fast GPUs, have helped fuel continuing advances in deep
learning.
RELATED WORK
Liang Zhang et al. [4] says that in the field of aerospace
measurement and control field, optical equipmentgenerates
a large amount of data as image. Thus, it has great research
value for how to process a huge number of image data
quickly and effectively. With the development of deep
learning, great progress has been made in the task of image
classification. The task images are generated by optical
measurement equipment are classified using the deep
learning method. Firstly, based on residual network, a
general deep learning image classification framework, a
binary image classification network namely rocket image
and other image is built. Secondly, on the basis of the binary
cross entropy loss function, the modified loss function is
used to achieves a better generalization effect on those
images difficult to classify. Then, the visible image data
downloaded from optical equipment is randomly divided
into training set, validation set and test set. The data
augmentation method is used to train the binary
classification model on a relatively small training set. The
optimal model weight is selected according to the loss value
on the validation set. This method has certain value for
exploring the application of deep learning method in the
intelligent and rapid processing of optical equipment task
image in aerospace measurement and control field.
T. Postadjiana et al. [5] proposes that supervised
classification is the basic taskfor landcover mapgeneration.
From semantic segmentation to speech recognition deep
neural networks has outperformed the state-of-the-art
classifiers in many machine learning challenges. Such
strategies are now commonly employed in the literature for
the purpose of land-cover mapping. The systemdevelopsthe
strategy for the use of deep networks to label very high-
resolution satellite images, with the perspective of mapping
regions at country scale. Therefore, a super pixel-based
method is introduced in order to (i) ensure correct
delineation of objects and (ii) perform the classification in a
dense way but with decent computing times.
Chaomin Shen et al. [6] discuss that the percentage of cloud
cover is one of the key indices for satellite imagery analysis.
To date, cloud cover assessment has performed manually in
most ground stations. To facilitate the process, a deep
learning approach for cloud cover assessment in quick look
satellite images is proposed. Same as the manual operation,
given a quick look image, the algorithm returns 8 labels
ranging from A to E and *, indicating the cloud percentages
in different areas of the image. This is achieved by
constructing 8improved VGG-16models, where parameters
such as the loss function, learning rate and dropout are
tailored for better performance. The procedure of manual
assessment can be summarized as follows. First, determine
whether there is cloud cover in the scene by visual
inspection. Some prior knowledge, e.g., shape, color and
shadow, may be used. Second, estimate the percentage of
cloud presence. Although in reality, the labels are often
determined as follows. If there is no cloud, then A; If a very
small amount of clouds exist, then B; C and D are given to
escalating levels of clouds; and E is given when the whole
part is almost covered by clouds. There is also a label * for
no-data. This mostly happens when the sensor switches,
causing no data for several seconds. The disadvantages of
manual assessment are obvious. First of all, it is tedious
work. Second, results may be inaccurate due to subjective
judgement.
Qingshan Liu et al. [7] discuss about a multiscale deep
feature learning method for high-resolution satellite image
scene classification. However, satellite images with high
spatial resolution pose many challenging issues in image
classification. First, the enhanced resolution brings more
details; thus, simple lowlevel features (e.g., intensity and
textures) widely used in the case of low-resolution images
are insufficient in capturing efficiently discriminative
information. Second, objects in the same type of scene might
have different scales and orientations. Besides, high
resolution satellite images often consist of many different
semantic classes, which makes further classification more
difficult. Taking the commercial scene comprises roads,
buildings, trees, parking lots, and so on. Thus, developing
effective feature representations is critical for solving these
issues.
METHODOLOGY
The proposed system is a deep learning system that
classifies objects and facilities in high-resolution multi-
spectral satellite imagery.
Figure 2 System Architecture
The system consists of an ensemble of CNNs with post-
processing neural networks that combine the predictions
from the CNNs with satellite metadata. Combined with a
detection component, the system couldsearchlargeamounts
of satellite imagery for objects or facilities of interest.
The proposed system mainly consists of four modules:
Image Preparation
CNN
Training
Classification
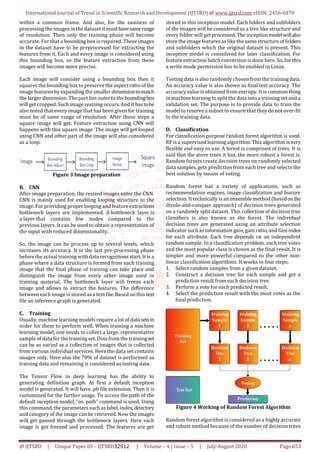
A. Image Preparation
The first step that has to be performed is image preparation.
This is a most important step because any small changes
from this step can cause a vital change to overall output.
Initially, images in the dataset may contain different sizes
and resolution. Therefore, images had to be resized before
training [2]. Because every image has to be considered](https://image.slidesharecdn.com/118satelliteandlandcoverimageclassificationusingdeeplearning-200919105359/85/Satellite-and-Land-Cover-Image-Classification-using-Deep-Learning-2-320.jpg)
![International Journal of Trend in Scientific Research and Development (IJTSRD) @ www.ijtsrd.com eISSN: 2456-6470
@ IJTSRD | Unique Paper ID – IJTSRD32912 | Volume – 4 | Issue – 5 | July-August 2020 Page 654
participating in the process. It does not suffer from the over
fitting problem. The main reason is that it takes the average
of all the predictions, which cancels out the biases. Random
forests can also handle missing values. There are two ways
to handle these: using median values to replace continuous
variables, andcomputing the proximity-weightedaverageof
missing values [15]. The relative feature importancewillalso
get, which helps in selecting the most contributing features
for the classifier.
The inception model will contain the features of the image.
When an input image is got, the features of this input image
is alsogot extracted. These features are gotmatchedwiththe
features of images that has been stored as the dataset. For
that imagewhich have the higher probability value with this
input image, then the corresponding label of the image or
root_node_label from the inception model will be returned.
There will be a single phase that allows interface with the
user. That is the area to login and provide an input image to
check. From there itself the information regarding theimage
will be provided. The login is usually provided to admin.
Because this system doesn’t require many users. But if any
application wants then there is no problem for providing it.
The accuracy ofthe system ismore depend uponthetraining
dataset. As much as the dataset is accurate then the output
will also show that property. So, the training dataset must
contain clear and also a large number of images in a folder
itself. Because in deep learning as the number of accurate
images in a class increases the accuracy of the output also
increases.
Experimental Results
This section discusses the experimental results of the
proposed system. The system that uses the Linux operating
system and visual studio as platform. The proposed system
uses aerial images for results assessment.
Figure 5 Image classified with high accuracy
Figure 6 Image classified with low accuracy
This system uses Tensor Flow for training the dataset. After
the training, the results will be stored as inception model
that is pb file. The user is able to upload an aerial image for
identifying the content of the image. The web page which
actsas user interface iswritten using php and also to enable
it in python XAMPP is used. From there the image that the
user uploaded, the pb file and the label file which contains
the category ofimages from dataset is loaded to the memory
of Tensor Flow. Actually, the path of the uploaded imagewill
be loaded to Tensor Flow. The algorithm is applied in this
phase. The classification is done using RF algorithm. The
algorithm is implemented using scikit learn.
In RF algorithm, multiple trees are constructed. The number
of trees constructed will be depend upon the number of
categories in the trained dataset. The most probable value
will present at the root node of each category. So, eachtreeis
considered to find the most probable one. For that each
probability value is considered. For each tree, the labels are
also numbered from label 0 to n. The values of each root
nodes will be sent to an array ordered from 0 to n (as same
as the labels numbered). Then this array is subjected for
sorting. After sorting the highest element from the arraycan
be taken. This will be matched to the category, where the
label itself of the category is the result. Also, the correctness
of the output also has to be displayed to user. Because the
applications of the proposed system have a major
importance in the accuracy of the result. So, the probability
value is used to displayas percentage to the user asaccuracy
of the result. The output must have to be passed to the web
page. Because the output has to be displayed to the user. For
that a framework of python called FLASK is used. It is used
for the construction and maintenance ofweb applicationsin
python.
Conclusion
The proposed method shows a deep learning system that
classifies objects and facilities in high resolution multi-
spectral satellite imagery. The system consists of an
ensemble of CNNs with deep learning libraries that combine
the predictions from the RF algorithm with satellite
metadata. Combined witha detectioncomponent,thesystem
could search large amounts of satellite imageryforobjectsor
facilities of interest. In this way it could solve the problems
in various fields.
By proper monitoring of satellite imagery, it could help law
enforcement officers to detect unlicensed miningoperations
or illegal fishing vessels, assist natural disaster response
teams with the proper mapping of mud slides and enable
investors to monitor crop growth or oil well development
more effectively.
Future work
This proposed work uses images that have been already
taken by any satellite. So, the images may be taken before a
long time can challenge the security. For that to enable
accuracy and security live streaming from satellite can be
enabled by using high quality cameras. Theproposedworkis
based on images, but it can also extend for videos taken by
satellite by using efficient streaming equipment.
Acknowledgment
I undersigned hereby declare that the project “Satellite and
Land Cover Image Classification Using Deep Learning”,
submitted for partial fulfillment of the requirements for the
award of degree of Master of Technology of the APJ Abdul
Kalam Technological University, Kerala is a bonafide work
done by me under supervision of Ms. Liji Samuel. This
submission represents my ideas in my own words and
where ideas or words ofothers have been included,Ihavean
adequately and accurately cited and referenced the original
sources. I also declare that I have adhered to ethics of
academic honesty and integrityandhavenotmisrepresented
or fabricated any data or idea or fact or source in my
submission.](https://image.slidesharecdn.com/118satelliteandlandcoverimageclassificationusingdeeplearning-200919105359/85/Satellite-and-Land-Cover-Image-Classification-using-Deep-Learning-4-320.jpg)
![International Journal of Trend in Scientific Research and Development (IJTSRD) @ www.ijtsrd.com eISSN: 2456-6470
@ IJTSRD | Unique Paper ID – IJTSRD32912 | Volume – 4 | Issue – 5 | July-August 2020 Page 655
References
[1] Roshni Rajendran, Liji Samuel, “Satellite Image
Classification with Deep Learning:Survey”Publishedin
International Journal of Trend in Scientific Researchand
Development (IJTSRD), ISSN: 2456-6470, Volume-4,
Issue-2, February 2020, pp.583-587.
[2] Roshni Rajendran, Liji Samuel, “Satellite and Land
Cover Image Classification with Deep Learning”,
International Journal of Innovative Research in Science,
Engineering and Technology (IJIRSET), e-ISSN: 2319-
8753, p-ISSN: 2320-6710, Volume 9, Issue 7, July2020.
[3] M. Pritt and G. Chern, "Satellite Image Classification
with Deep Learning," 2017 IEEE Applied Imagery
Pattern Recognition Workshop (AIPR), Washington,DC,
2017, pp. 1-7.
[4] L. Zhang, Z. Chen, J. Wang and Z. Huang, "Rocket Image
Classification Based on Deep Convolutional Neural
Network," 2018 10th International Conference on
Communications, Circuits and Systems (ICCCAS),
Chengdu, China, 2018, pp. 383-386.
[5] T. Postadjian, A. L. Bris, C. Mallet and H. Sahbi,
"Superpixel Partitioning of Very High Resolution
Satellite Images for Large-Scale Classification
Perspectives with Deep Convolutional Neural
Networks," IGARSS 2018 - 2018 IEEE International
Geoscience and Remote Sensing Symposium, Valencia,
2018, pp. 1328-1331.
[6] C. Shen, C. Zhao, M. Yu and Y. Peng, "Cloud Cover
Assessment in Satellite Images Via Deep Ordinal
Classification," IGARSS 2018 - 2018 IEEE International
Geoscience and Remote Sensing Symposium, Valencia,
2018, pp. 3509-3512.
[7] Q. Liu, R. Hang, H. Song and Z. Li, "Learning Multiscale
Deep Features for High-Resolution Satellite Image
Scene Classification," in IEEE Transactions on
Geoscience and Remote Sensing, vol. 56, no. 1, pp. 117-
126, Jan. 2018.
[8] P. Helber, B. Bischke, A. Dengel and D. Borth,
"Introducing Eurosat: A Novel Dataset and Deep
Learning Benchmark for Land Use and Land Cover
Classification," IGARSS 2018 - 2018 IEEE International
Geoscience and Remote Sensing Symposium, Valencia,
2018, pp. 204-207.
[9] K. Cai and H. Wang, "Cloud classification of satellite
image based on convolutional neural networks," 2017
8th IEEE International Conference on Software
Engineering and Service Science (ICSESS),Beijing,2017,
pp. 874-877.
[10] A. O. B. Özdemir, B. E. Gedik and C. Y. Y. Çetin,
"Hyperspectral classification using stacked
autoencoders with deep learning," 2014 6th Workshop
on Hyperspectral Image and Signal Processing:
Evolution in Remote Sensing (WHISPERS), Lausanne,
2014, pp. 1-4.
[11] M. Lavreniuk, N. Kussuland A. Novikov,"DeepLearning
Crop Classification Approach Based on Sparse Coding
of Time Series of Satellite Data," IGARSS 2018 - 2018
IEEE International Geoscience and Remote Sensing
Symposium, Valencia, 2018, pp. 4812-4815.
[12] L. Bragilevsky and I. V. Bajić, "Deep learning for
Amazon satellite image analysis," 2017IEEEPacificRim
Conference on Communications, Computers and Signal
Processing (PACRIM), Victoria, BC, 2017, pp. 1-5.
[13] R. F. Berriel, A. T. Lopes, A. F. de Souza and T. Oliveira-
Santos, "Deep Learning-Based Large-Scale Automatic
Satellite Crosswalk Classification," in IEEE Geoscience
and Remote Sensing Letters, vol. 14, no. 9, pp. 1513-
1517, Sept. 2017.
[14] https://www.academia.edu/12916130/A_Comparativ
e_Study_of_SVM_RF_and_CART_Algorithms_for_Image_
Classification
[15] https://www.datacamp.com/community/tutorials/ran
dom-forests-classifier-python](https://image.slidesharecdn.com/118satelliteandlandcoverimageclassificationusingdeeplearning-200919105359/85/Satellite-and-Land-Cover-Image-Classification-using-Deep-Learning-5-320.jpg)