Sasaki Parks Master Plan Presentation
•
2 likes•2,913 views

The document outlines the master plan process for Bridgeport's parks and recreation system. It includes an introduction and sections on assessment, community need, the future vision, project schedule, stakeholder groups, previous planning efforts, a needs assessment, and potential scenarios for the future. The process involves stakeholder interviews, an inventory and needs assessment, developing concepts and scenarios, and creating a final master plan and implementation strategy. It analyzes areas like parks spending, operations, and access and identifies needs such as more neighborhood parks and accessible waterfront. Three potential scenarios will be developed to envision how Bridgeport's parks future might unfold.

Recommended
More Related Content
What's hot
What's hot (14)
Similar to Sasaki Parks Master Plan Presentation
Similar to Sasaki Parks Master Plan Presentation (20)
More from City of Bridgeport, Connecticut
More from City of Bridgeport, Connecticut (9)
Recently uploaded
Recently uploaded (20)
Sasaki Parks Master Plan Presentation
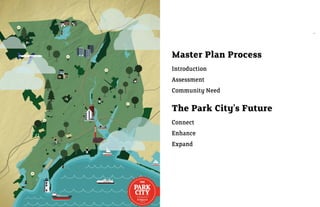
- 1. 1 Master Plan Process Introduction Assessment Community Need The Park City’s Future Connect Enhance Expand
- 2. Project Schedule 4 5 1: Framework 2: Concepts 3: Master Plan • Kick-off & Stakeholder Interviews • Develop 3 Scenarios • Final Master Plan • 2011 Parks Inventory • Plan Refinement • Implementation Strategy • Needs Assessment • Draft Action Plan • Existing Conditions Analysis • Launch Public Outreach • Community Survey Development APRIL MAy JUNE JULy AUGUST SEPTEMBER OCTOBER Community Public Survey Meeting #1 Public Public Meeting #1 Meeting #2 #1 Kick Off Client Parks Board Stakeholder Client Stakeholder Client Stakeholder Review WorkSession Review Worksession Review Worksession
- 3. Client Leadership Stakeholder Group 6 7 • Mayor Bill Finch • Board of Parks Commissioners • Charles Carroll, Parks Director & Public Facilities Director • Public Facilities-Charles Carroll + Ted Grabarz • Ted Grabarz, Sustainability Director & Deputy Director of • Parks Manager-Andy Valeri Public Works • Recreation Superintendent-Luann Conine • Steve Hladun, Project Coordinator • Tree Warden/Urban Forester-Steve Hladun • Mike Nidoh, Director of Planning • Planning & Economic Development-Bill Coleman; Donald • Board of Parks Commissioners: James Brideau, James Giles, Eversley, Director of Planning and Economic Development Banjed Labrador, Mark Marko, Frank A. Mercaldi, Ann E. Owens, • Neighborhood/NRZ Coordination-Angie Staltero Rosa, Cruz • Downtown Special Services District-Rick Myers Sasaki • Bridgeport Regional Business Council-Paul Timpanelli • Historic Preservation Commission-Stuart Sachs • Jason Hellendrung-Managing Principal • Small and Minority Business Resource Office-Deborah Caviness • Gina Ford-Design Principal • Lighthouse Program, Office of Education and youth-Tammy Pappa • Brie Hensold-Project Manager, Planner • Greater Bridgeport Regional Business Council-Brian Bidolli • Eamonn Hutton-Landscape Architect • City Council-Lydia Martinez, Martin C. McCarthy, Susan Brannelly, • Stephen Gray-Urban Designer Denese Taylor-Moye, Anderson Ayala, Robert S. Walsh, M. Evette Brantley, Howard Austin, Sr., Thomas C. McCarthy, Michelle Lyons, AmyMarie Vizzo-Paniccia, Warren Blunt, Richard Bonney, Heller & Heller Angel M. DePara, Jr., Carlos Silva, Manuel Ayala, Richard M. Paoletto, Jr., Robert Curwen, James Holloway, Andre F. Baker • Barbara Heller-Parks & Recreation Planner
- 4. Previous Planning & Ongoing 8 Projects 9 Master Plan of Conservation and Development (2008) BGreen 2020 Waste, Green Energy Greenfields & Water Businesses downtown Jobs Neighborhoods Education Infrastructure Environment Green Spaces Materials & Marketing & Buildings Green Wheels resources & Jobs recycling New Parks Amenities 2011 Parks and Improvements Master Plan New Signage 7 NRZ Plans Schools Renovations Complete Streets Complete Streets Knowlton Park Potential Downtown “Surprise, it’s Bridgeport” Black Rock & South End Bike Paths Playground CDBG Public Park Glenwood Tennis Improvements: Svirha, Washington Park and Court Improvements Waterview, McGovern Knowlton Park Funds
- 5. Community Survey 66 67 • 114 online responses to date • Top 3 parks for improvement - Seaside, Pleasure Beach, Veteran’s Memorial Park • Popular future amenties - playgrounds, splash pads, picnic shelters, swimming facilities
- 6. PArKS ProGrAM Needs Assessment and Potential Program
- 7. 2011 Inventory Assessment 32 33 Standards Parks Inventory • 2011 Parks data updated through consultations with Client, site visits, GIS and other data Need Z - X Parks Classification • Based on MP Conservation and Development: Mini-parks, neighborhood, community, regional, and special use parks X y Z System Benchmarking BPT NRPA SA/HH • Park acreage for system and types benchmarked against peer cities (similar population) and aspirant, large systems nationally NPRA standards adjusted for Park Assessment Bridgeport’s specific needs • Park types compared against national standards and recommendations by consultant team National Parks and Recreation standards Park Element Assessment • Park Elements compared against national standards and Existing condition in recommendations by consultant team Bridgeport Today
- 8. 34 45+ parks 1,346 acres Park System Mini parks speCial Use regional parks CoMMUniTY parks neigHBorHooD parks Lawrence Miami City Comparisons Lowell Lawrence National Standards Hartford Providence Waterbury Lowell Providence Baltimore Bridgeport Buffalo 96 Miami Bridgeport BPT 1,436 Worcester Boston Buffalo Hartford Oakland totAl ACreAge New Haven totAl ACreAge Pittsburgh Pittsburgh NRPA ACreS / 1,000 reSIDentS 1,442 Oakland Worcester Baltimore Waterbury Minneapolis Washington, DC Boston Minneapolis SA/HH 1,442 Washington, DC New Haven 0 0 10 20 8,000 4,000 35
- 9. Parks Diversity 36 37 • Mini-park <1% • Neighborhood Park 6% • Community Park 22% • Regional Park 65% • Special Use Park 7% % of total Acreage Mini Special Use Neighborhood COMMUNITy REGIONAL 5 Park types regional parks CoMMUniTY parks neigHBorHooD parks Mini parks speCial Use
- 10. Park Type Assessment 38 39 Mini-park • Strategic interventions 67 NA 203 Neighborhood Park 216 289 • Highest need for more neighborhood parks 86 72 4.4 bPt nrPA SA/hh Community Park bPt nrPA SA/hh • Full city is within the service radius of a community park, but mInI-PArK neIghborhooD PArK totAl ACreAge totAl ACreAge additional need exists due to dense population base regional Park • Minor need for additional regional park space Special use Park 286 1,082 26 286 1,082 • Recommendations will vary according to opportunity and 577 577 community input 291 551 bPt nrPA SA/hh bPt nrPA SA/hh CommunIty PArK regIonAl PArK totAl ACreAge totAl ACreAge
- 11. Field Sports 4 42 43 25 29 29 17 14 14 BPT NRPA SA/HH BPT NRPA SA/HH bASebAll/ SoFtbAll FootbAll/ SoCCer Court Sports 24 1 17 29 29 24 72 48 4 NA 5 11 BPT NRPA SA/HH BPT NRPA SA/HH BPT NRPA SA/HH bASKetbAll tennIS volleybAll Play 2 53 1 2 2 19 115 72 1 1 2 3 5 5 1 7 3 1 7 3 BPT NRPA SA/HH BPT NRPA SA/HH BPT NRPA SA/HH BPT NRPA SA/HH BPT NRPA SA/HH PlAy grounDS ICe SKAtIng rInK SPrAy PAD InDoor Pool outDoor Pool Leisure # leISure ACtIvItIeS # PlAy FACIlItIeS # CourtS # FIelDS 2 3 3 12 3 3 7 6 6 1 BPT NRPA SA/HH BPT NRPA SA/HH BPT NRPA SA/HH boCCe horSeShoeS ShelterS
- 12. 44 Park Need “ Nearly half of City neighborhoods are underserved (under 10% land area for parks)—Black Rock, Boston 45 Ave/ Mill Hill, Brooklawn/St. Vincent, Population Density Downtown, East Side, Hollow, Reservoir/ Whiskey Hill, West End/ West Side. ” -2008 Master Plan Car Access Needs Assessment • 6.8 acres of open space per 1000 residents vs. the regional average of 8.5 / 1000 • 12% of the population does not live within a 10-minute walk of any Diversity open space. • Only approximately 4 of its 22 miles of waterfront are currently publicly accessible. Income
- 13. Access and Need 46 47 BGreen 2020, Need Assessment 14 5 30 1 16 23 36 Access to 20 35 Parkland Within 2 15 the City 6 8 4 37 Bridgeport Parks Depart- 19 ment, US Census, RPA 22 24 33 10 12 7 38 18 3 25 27 17 26 39 40 29 41 11 28 21 13 32 Parcels Park Need 31 within a 1/3-mile walk of a park 0 – 20 Bridgeport Parks 20 – 40 40 – 50 within a 1/3-mile walk of a school 60 – 80 Bridgeport Public Schools 80 – 100 *Park need is a composite index of income, race/ethnicity, age, 9 residential density, and auto ownership, based on census data. BGreen 2020 • A Sustainability Plan for Bridgeport, Connecticut 31 15 minute walk HIGH LOW
- 14. Parks Spending & Revenue Operations/Staff 58 • Parks spending is low as measured against peers and other cities • Parks Maintenance Staff-14 59 • Revenues largely come from the Golf Course, with other revenues • Recreation Staff-3 from checkpoints, rentals, and annual stickers • Best Practice Maintenance Standard -1 employee / 15 acres $25,000 $300 • Usual Maintenance Standard-1 employee / 18-22 acres $12,500 $150 $1,530 $14 0 0 Washington, DC Minneapolis Boston Oakland Miami Baltimore Pittsburgh New Haven Hartford Waterbury Bridgeport Buffalo Washington, DC Minneapolis Boston Oakland Miami Baltimore Pittsburgh New Haven Hartford Waterbury Bridgeport Buffalo SPenDIng Per ACre oF PArKS SPenDIng Per reSIDent on PArKS 20 $2.5 M $2 M $1.5 M reCreAtIon 3 $1 M GOLF COURSE mAIntenAnCe 14 22 47 63 0.5 M BPT NATL. USUAL STND. BEST COMPS PRACTICE OTHER 0 2005 2006 2007 2008 2009 2010 2011 totAl AnnuAl revenueS
- 15. tHE FuturE oF PArK CItY 3 Potential Scenarios for Bridgeport Parks & Recreation
- 16. 3 Plan Scenarios Scenarios 70 71 • Stories about how Bridgeport’s future might unfold • A method for finding appropriate movements down each path Needs Assessment Stakeholder Interviews Community Input & Refinement Community Survey Client Direction
- 17. Connect Connect by Water • Pequonnock River & yellow Mill Creek • Pleasure Beach link & Captain’s Cove / South End access Connect by Infrastructure • Implement bike lanes, complete streets, sidewalks maintenance • Focus on east-west connections Connect with New Parks • Create a linear park system east-west across the city and the Pequonnock River LINEAR PARK ALONG INFRASTRUCTURE (COMMONS PARK, DENVER)
- 18. HELEN ST Yellow Mill Creek Today... N AVE BOSTO REMINGTON ARMS DAMS DISRUPT FISH MIGRATION (GLENWOOD PARK) LACK OF PUBLIC ACCESS ALONG CREEK CORRIDOR CHANNELIZED WATER CORRIDOR
- 19. Imagine Yellow Mill Creek... 80 81 N AVE BOSTO REMINGTON ARMS DEVELOPMENT SPURRED ALONG RESTORED CREEK PUBLIC RECREATION AND ACCESS UNIQUE LANDSCAPE
- 20. ‘Sliver by the River’ Today... R WATE BUS STATION TRAIN STATION ‘SLIVER By THE RIVER’ 95 RD F O AT R ST FUTURE RELATIONSHIP TO KNOWLTON PARK POTENTIAL BOATING ACCESS ADJACENT TO MULTIMODAL TERMINAL
- 21. Imagine ‘Sliver by the River’... 84 WATERFRONT PARK 85 RD DESTINATION PLAy F O AT R ST WATERFRONT AMPHITHEATER PROM ENAD E ACCESSIBLE WATER’S EDGE INFORMAL AMPHITHEATER DESTINATION PLAyGROUND
- 22. 90 91 ENHANCE ... Restore and transform the Bridgeport Parks System
- 23. Enhance 92 93 Seek Big Wins Renaturalized large parks Renaturalized water’s edge Buffered highway/train corridors and infrastructure Hyper Parks serve high need areas Durable materials and a high number of family and child-oriented park amenities Low Maintenance small parks and infill DURABLE PLAy FIELD, BROOKLyN
- 24. MAIN Old Mill Green Today... OKS BRO LAKEVIEW CEMETERy D HAR ORC BO STO N AV E KE BRO PEM N HELE LUIS MUNOZ MARIN OPEN, UNDERUTILIZED PARK SPACE DIFFICULT TO ACCESS DUE TO TRAFFIC PATTERNS HISTORIC TREE CANOPy
- 25. MAIN STREET CLOSING Imagine Old Mill Green... SK AT 96 E PA 97 RK OKS BRO IMPROVED CROSSWALKS DO G P AR K LAKEVIEW CEMETERy D BA HAR SKE TB ALL ORC BO BA STO SKE KE N AV TB ALL BRO E PEM PLA STREET CLOSING y F IEL D N HELE LUIS MUNOZ MARIN DOG PARK, COLORADO PLAy ACTIVITIES DESTINATION PLAy GROUND
- 26. Beardsley Today... MAIN ZOO NO BL E 8 / 25 BUNNELLS POND GLENWOOD OPEN LAWNS ARE MAINTENANCE-INTENSIVE NATURAL FEATURES STREET AND TRAIL CONNECTIONS
- 27. Imagine Beardsley... 100 101 MAIN ZOO NO BL E 8 / 25 BUNNELLS POND GLENWOOD NATURALIZED LANDSCAPE, MA TRAILS PROVIDE ACCESS MINIMAL MOWED EDGES
- 28. 106 107 ExPANd ... Network and partner to find new opportunities and more efficient maintenance
- 29. Expand 108 109
- 30. ... Pleasure Beach Waterfront 110 111
- 31. ... Volunteer Clean-ups 112 113
- 32. ... Public parks, schools, and 114 multi-family housing share 115 common grounds
- 33. ... Expanded hours, increased 116 access, & maintenance 117 efficiencies
- 34. Expand - Website & 122 Communications 123 Increase website user’s access to information with increased San Francisco worked access to information out successfully - LIN organization and a more accessible interface many links are available but a strong visual hierarchy makes DEN sorting through them easy AV WAL E D EME R E AV E VE R K A PA ACCESS TO TOO MUCH INFORMATION CAN BE OVERWHELMING FOR A USER HAVING A PREDICTABLE LAyOUT MAKES READING THROUGH A WEBSITE ENJOyABLE
- 35. The Branded System 126 Freshkills Park NYC 127 Examples of a complete branded identity system including product packaging, website/newsletter, signage, and advertising billboard.
- 36. 3 Scenarios for Bridgeport’s Parks & Recreation System CoNNECt ENHANCE ExPANd