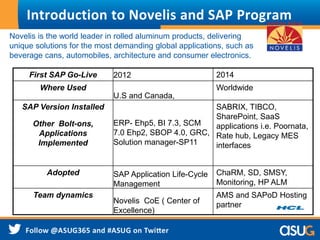
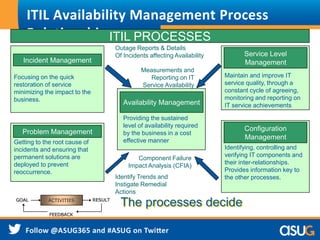
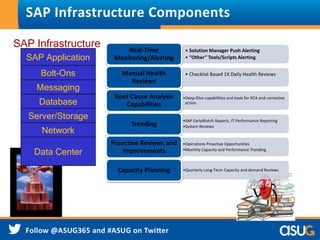
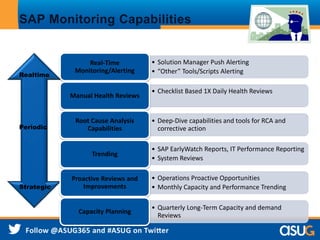
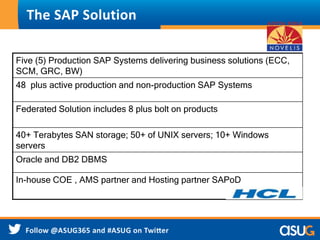
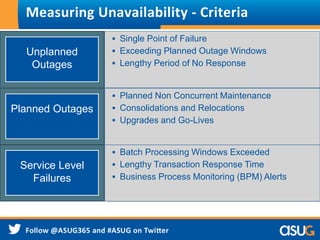
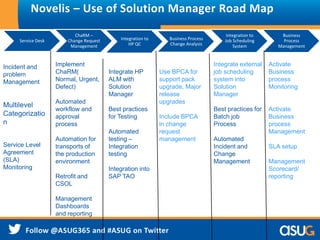
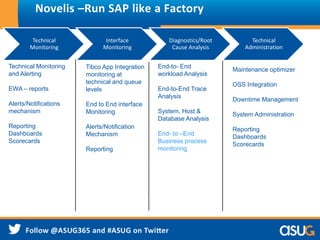
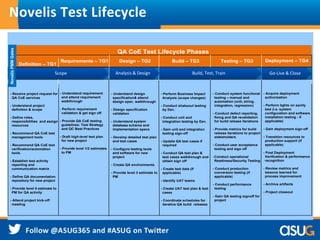
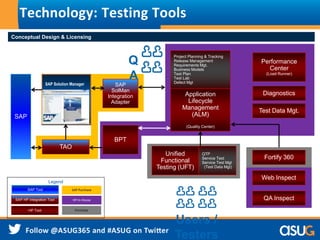
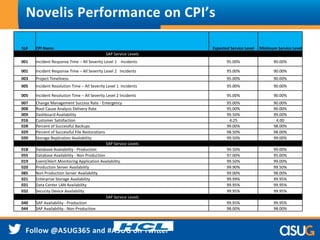
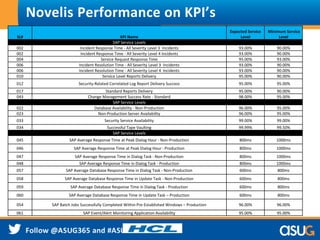
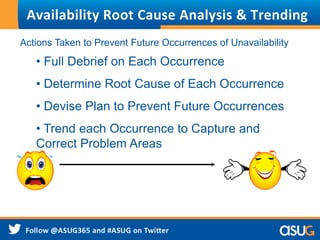
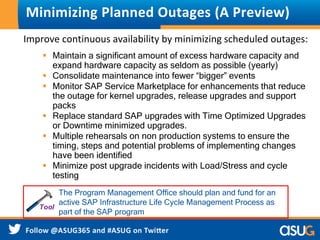
ITM 119 
ITM119 Delivering Continuous SAP Solution Availability 
Lovnish Mahajan, Basis Architect & Robert Max, 
Application Technology Manager, Novelis
Agenda 
Lovnish Mahajan, SAP Basis Architect 
Robert Max, Global Applications Technology Manager 
Availability Management, BASIS Technologies 
ITIL Availability Management Process 
SAP Infrastructure Components 
Investment in Solution Manager 
Summary/References
About – Lovnish Mahajan 
 Partner in Parvotech Inc.- SAP consulting boutique - 
specializing in remote BASIS, Solution Manager and 
HANA consulting . 
 SAP Certified BASIS, HANA and Solution Manager 
Architect. 
 Over 15 years of experience in SAP BASIS Technologies, 
ALM, ITSM and Security with SMBs and Fortune 500 
companies. 
 Extensive Experience in strategy, design, development 
and successful deployment of Application Life Cycle 
Mgmt. and IT service Mgmt. 
 Speaker at various conferences including SAPPHIRE, 
ASUG Annual conference and SAP TechEd.
About – Robert Max 
 Is currently responsible for the technical support of 
Novelis’ portfolio of global applications including the 
teams supporting Solution Manager and delivering SAP 
Basis and Security Administration services. 
 He has had a key role in the construction of two of the 
world’s largest SAP Implementations for Fortune 500 
consumer products companies. 
 Active in ASUG, Robert was the founding leader of the 
Solution Manager SIG, has spoken at numerous ASUG 
Annual Conference, SAP Active Global Support and 
TechEd Conferences as well as many regional events. 
 He has presented at ASUG events, TechEd and 
SAPPHIRE and awarded best presenter at an SAP AGS 
event in Walldorf
Learning Objectives 
As a result of this session, you will be able to: 
 Describe the ITIL Process for improving Availability 
 Identify potential Infrastructure Availability issues 
 Investment in SAP Solution Manager Functionality to improve availability 
 Minimize Planned Outages 
Since Go-Live in Oct 2012, SAP Application availability at Novelis has been 
99.96% with only TWO scheduled maintenance days annually
Novelis Global Footprint 
9 
1,800 
Countries 
25 
2,786 Kt 
Employees 
Revenues 
North 
America 
3,100 
$3.4 Billion 
Europe 
$3.2 Billion 
1,800 
Employees Shipments 
Operations 
$9.8b 
Revenues 
11,000 
FRP Shipments 
988 kt 
and Sales Based on FY 2013 Results; Employees as of March 31, 2013 
4,300 
847 kt 
Asia 
$1.8 Billion 
556 kt 
South 
America 
$1.4 Billion 
395 kt 
Shipments and Sales Based on FY 2013 Results; Employees as of March 31, 2013
Introduction to Novelis and SAP Program 
Novelis is the world leader in rolled aluminum products, delivering 
unique solutions for the most demanding global applications, such as 
beverage cans, automobiles, architecture and consumer electronics. 
First SAP Go-Live 2012 2014 
Where Used 
U.S and Canada, 
Worldwide 
SAP Version Installed 
Other Bolt-ons, 
Applications 
Implemented 
ERP- Ehp5, BI 7.3, SCM 
7.0 Ehp2, SBOP 4.0, GRC, 
Solution manager-SP11 
SABRIX, TIBCO, 
SharePoint, SaaS 
applications i.e. Poornata, 
Rate hub, Legacy MES 
interfaces 
Adopted SAP Application Life-Cycle 
Management 
ChaRM, SD, SMSY, 
Monitoring, HP ALM 
Team dynamics 
Novelis CoE ( Center of 
Excellence) 
AMS and SAPoD Hosting 
partner
ITIL Availability Management Process 
SAP Infrastructure Components 
Investment in Solution Manager 
Summary/References
ITIL Service Delivery Processes 
Service Desk 
IT Infrastructure 
Service Level 
Management 
Maintain and improve IT 
service quality, through a 
constant cycle of agreeing, 
monitoring and reporting on 
IT service achievements 
Availability 
Management 
Providing the sustained 
level of availability required 
by the business in a cost 
effective manner 
Capacity Management 
Ensuring that the capacity 
and performance needs of 
the business are being met 
IT Service Continuity 
Management 
Ensuring that the necessary 
IT services can be 
recovered within the agreed 
business timescales 
Financial Management 
for IT Services 
Cost-effective control and 
management of the IT 
assets and the financial 
resources used in delivering 
IT Services
ITIL Availability Management Process 
RelationshipsITIL PROCESSES 
Outage Reports & Details 
Of Incidents affecting Availability 
Measurements and 
Reporting on IT 
Service Availability 
Availability Management 
Providing the sustained 
level of availability required 
by the business in a cost 
effective manner 
Incident Management 
Focusing on the quick 
restoration of service 
minimizing the impact to the 
business. 
Service Level 
Management 
Maintain and improve IT 
service quality, through a 
constant cycle of agreeing, 
monitoring and reporting on 
IT service achievements 
Configuration 
Management 
Identifying, controlling and 
verifying IT components and 
their inter-relationships. 
Provides information key to 
the other processes. 
Component Failure 
Impact Analysis (CFIA) 
Problem Management 
Getting to the root cause of 
incidents and ensuring that 
permanent solutions are 
deployed to prevent 
reoccurrence. 
Identify Trends and 
Instigate Remedial 
Actions 
The processes decide 
GOAL ACTIVITIES RESULT 
FEEDBACK
ITIL Availability Management Process 
SAP Infrastructure Components 
Investment in Solution Manager 
Summary/References
SAP Infrastructure Components 
SAP Infrastructure 
SAP Application 
Bolt-Ons 
Messaging 
Database 
Server/Storage 
Network 
Data Center 
• Solution Manager Push Alerting 
• “Other” Tools/Scripts Alerting 
Real-Time 
Monitoring/Alerting 
• Checklist Manual Health Based 1X Daily Health Reviews 
Reviews 
•Deep-Dive capabilities and tools for RCA and corrective 
action 
Root Cause Analysis 
Capabilities 
•SAP EarlyWatch Reports, IT Performance Reporting 
•System Reviews Trending 
•Operations Proactive Opportunities 
•Monthly Capacity and Performance Trending 
Proactive Reviews and 
Improvements 
Capacity Planning •Quarterly Long-Term Capacity and demand Reviews
SAP Monitoring Capabilities 
Realtime 
Periodic 
Strategic 
• Solution Manager Push Alerting 
• “Other” Tools/Scripts Alerting 
Real-Time 
Monitoring/Alerting 
• Checklist Based 1X Daily Health Reviews 
Manual Health Reviews 
• Deep-Dive capabilities and tools for RCA and 
corrective action 
Root Cause Analysis 
Capabilities 
• SAP EarlyWatch Reports, IT Performance Reporting 
• System Reviews 
Trending 
• Operations Proactive Opportunities 
• Monthly Capacity and Performance Trending 
Proactive Reviews and 
Improvements 
• Quarterly Long-Term Capacity and demand 
Reviews 
Capacity Planning
The SAP Solution 
Five (5) Production SAP Systems delivering business solutions (ECC, 
SCM, GRC, BW) 
48 plus active production and non-production SAP Systems 
Federated Solution includes 8 plus bolt on products 
40+ Terabytes SAN storage; 50+ of UNIX servers; 10+ Windows 
servers 
Oracle and DB2 DBMS 
In-house COE , AMS partner and Hosting partner SAPoD
Measuring Unavailability - Criteria 
Unplanned 
Outages 
 Single Point of Failure 
 Exceeding Planned Outage Windows 
 Lengthy Period of No Response 
Consistent, repeatable end user transactions from multiple locations 
Proactively find availability and performance issues before customers 
do 
Reduce end user outages by proactively managing with performance 
and availability trends 
Planned Outages 
 Planned Non Concurrent Maintenance 
 Consolidations and Relocations 
 Upgrades and Go-Lives 
Consistent, repeatable end user transactions from multiple locations 
Proactively find availability and performance issues before customers 
do 
Reduce end user outages by proactively managing with performance 
and availability trends 
Service Level 
Failures 
 Batch Processing Windows Exceeded 
 Lengthy Transaction Response Time 
 Business Process Monitoring (BPM) Alerts 
Consistent, repeatable end user transactions from multiple locations 
Proactively find availability and performance issues before customers 
do 
Reduce end user outages by proactively managing with performance 
and availability trends
Measuring Unavailability 
A system is unavailable when: 
 A Critical event has been declared (critical event criteria has been 
defined per SLA) 
 Root cause of the critical event is attributed to the Basis area of 
responsibility versus the business process or functionality layer. 
 No new users can log on to the system 
Notes: 
 Each key group measures the hours their resource is off line. 
 If a component has failed and the system remains accessible, this 
is not measured. 
 In some cases number of outages may be a more reliable 
measurement than hours of unavailability 
 Worker Hours lost can be a good measurement of business 
impact (e.g. Resource Outage plus time necessary to restart the 
manufacturing line).
SAP Solution Availability Monitoring Tools 
SAP 
Infrastructure 
SAP Application 
Bolt-Ons 
Messaging 
Database 
Server/Storage 
Network 
Data Center 
Monitoring 
Business 
Processes 
Service 
Levels 
Events 
Alerts 
Tools 
HCL- Nimsoft 
Solution Manager
ITIL Availability Management Process 
SAP Infrastructure Components 
Investment in Solution Manager 
Summary/References
Solution Manager
Novelis- Road Map to BPML 
Review 
Solution 
Documentation 
Global Template 
Setup 
Setup for 
Implementation 
Projects 
• Review Business 
process/Document 
ation in SolMan 
• Identifying lag of 
usage of 
SOLAR01/02 
(transactions, IMG 
activities, test 
procedure; process 
owner, user…) 
• How to link 
SharePoint with 
SOLAR01/02 
• Business 
processes mapped 
• Current 
objects/programs/ 
interfaces added 
• Map custom 
programs into the 
Solutions 
• Import/Link 
Business Process 
Documents into 
SolMan 
• Maintenance 
Project Setup 
• Setup up Global 
template 
• Global landscape, 
business process 
information, test 
scripts and 
Training document 
• Create 
Implementation 
Projects for 
country/region 
specific roll outs 
• Setup Solution 
Manager for 
Business blueprint, 
configuration, 
documentation 
• Centralized 
configuration and 
development 
• Testing integration 
with HP ALM & 
TAO
Novelis – Use of Solution Manager Road Map 
Service Desk 
ChaRM – 
Change Request 
Management 
Business Process 
Change Analysis 
Integration to 
HP QC 
Integration to 
Job Scheduling 
System 
Business 
Process 
Management 
Incident and 
problem 
Management 
Multilevel 
Categorizatio 
n 
Service Level 
Agreement 
(SLA) 
Monitoring 
Implement 
ChaRM( 
Normal, Urgent, 
Defect) 
Automated 
workflow and 
approval 
process 
Automation for 
transports of 
the production 
environment 
Retrofit and 
CSOL 
Management 
Dashboards 
and reporting 
Integrate HP 
ALM with 
Solution 
Manager 
Best practices 
for Testing 
Automated 
testing – 
Integration 
testing 
Integration into 
SAP TAO 
Integrate external 
job scheduling 
system into 
Solution 
Manager 
Best practices for 
Batch job 
Process 
Automated 
Incident and 
Change 
Management 
Activate 
Business 
process 
Monitoring 
Activate 
Business 
process 
Management 
SLA setup 
Management 
Scorecard/ 
reporting 
Use BPCA for 
support pack 
upgrade, Major 
release 
upgrades 
Include BPCA 
in change 
request 
management
Novelis –Run SAP like a Factory 
Technical 
Monitoring 
Interface 
Monitoring 
Diagnostics/Root 
Cause Analysis 
Technical 
Administration 
Technical Monitoring 
and Alerting 
EWA – reports 
Alerts/Notifications 
mechanism 
Reporting 
Dashboards 
Scorecards 
Tibco App Integration 
monitoring at 
technical and queue 
levels 
End to End interface 
Monitoring 
Alerts/Notification 
Mechanism 
Reporting 
Maintenance optimizer 
OSS Integration 
Downtime Management 
System Administration 
Reporting 
Dashboards 
Scorecards 
End-to- End 
workload Analysis 
End-to-End Trace 
Analysis 
System, Host & 
Database Analysis 
End- to –End 
Business process 
monitoring
Novelis Test Lifecycle 
QA CoE Test Lifecycle Phases 
Definition – TG1 
Requirements – TG1 Design – TG2 Build – TG3 Testing – TG3 Deployment – TG4 
- Receive project request for 
QA CoE services 
- Understand project 
definition & scope 
- Define roles, 
responsibilities and assign 
resources 
- Recommend QA CoE test 
management tools 
- Recommend QA CoE test 
verification/automation 
tools 
- Establish test activity 
reporting and 
communication matrix 
- Define QA documentation 
repository for new project 
- Provide level 0 estimate to 
PM for QA activity 
- Attend project kick-off 
meeting 
- Understand requirement 
and attend requirement 
walkthrough 
- Perform requirement 
validation & get sign off 
- Provide QA CoE testing 
guidelines: Test Strategy 
and QC Best Practices 
- Draft high-level test plan 
for new project 
- Provide level 1/2 estimates 
to PM 
- Understand design 
specification& attend 
design spec. walkthrough 
- Design specification 
validation 
- Understand system 
database schema and 
implementation specs 
- Develop detailed test plan 
and test cases 
- Configure testing tools 
and software for new 
project 
- Create QA environments 
- Provide level 3 estimate to 
PM 
- Perform Business Impact 
Analysis (scope changes) 
- Conduct shakeout testing 
by Dev. 
- Conduct unit and 
integration testing by Dev. 
- Gain unit and integration 
testing sign-off 
- Update QA test cases if 
required 
- Conduct QA test plan & 
test cases walkthrough and 
obtain sign off 
- Create test data (if 
applicable) 
- Identify UAT teams 
- Create UAT test plan & test 
cases 
- Coordinate schedules for 
iterative QA build releases 
- Conduct system functional 
testing – manual and 
automation (unit, string, 
integration, regression) 
- Conduct defect reporting, 
fixing and QA revalidation 
for build release iterations 
- Provide metrics for build 
release iterations to project 
stakeholders 
- Conduct user acceptance 
testing and sign off 
-Conduct operational 
Readiness/Security Testing 
- Conduct production 
conversion testing (if 
applicable) 
- Conduct performance 
testing 
- Gain QA testing signoff for 
project 
- Acquire deployment 
authorization 
- Perform lights on sanity 
test (i.e. system 
configuration and software 
installation testing - if 
applicable) 
- Gain deployment sign-off 
- Transition resources to 
production support (if 
applicable) 
- Post Deployment 
Verification & performance 
recognition 
- Review metrics and 
lessons learned for 
process improvement 
- Archive artifacts 
- Project closeout 
Novelis PMM Gates 
Scope Analysis & Design Build, Test, Train Go-Live & Close
Technology: Testing Tools 
Conceptual Design & Licensing 
Project Planning & Tracking 
Release Management 
Requirements Mgt. 
Business Models 
Test Plan 
Test Lab 
Defect Mgt 
Application 
Lifecycle 
Management 
(ALM) 
(Quality Center) 
Define 
Application 
Requirements 
SAP Solution Manager SAP 
SolMan 
Integration 
Adapter 
BPT 
QTP 
Service Test 
Service Test Mgt 
(Test Data Mgt) 
TAO 
Diagnostics 
Fortify 360 
QA Inspect 
Unified 
Functional 
Testing (UFT) 
Web Inspect 
SAP 
Legend 
SAP Tool SAP Purchase 
SAP HP Integration Tool 
HP Tool 
HP In-House 
Purchase 
Performance 
Center 
(Load Runner) 
Test Data Mgt. 
Q 
A 
Users / 
Testers
Novelis Performance on CPI’s 
SL# CPI Name Expected Service Level Minimum Service Level 
SAP Service Levels 
001 Incident Response Time – All Severity Level 1 Incidents 95.00% 90.00% 
001 Incident Response Time – All Severity Level 2 Incidents 95.00% 90.00% 
003 Project Timeliness 95.00% 90.00% 
005 Incident Resolution Time – All Severity Level 1 Incidents 95.00% 90.00% 
005 Incident Resolution Time – All Severity Level 2 Incidents 95.00% 90.00% 
007 Change Management Success Rate - Emergency 95.00% 90.00% 
008 Root Cause Analysis Delivery Rate 95.00% 90.00% 
009 Dashboard Availability 99.50% 99.00% 
016 Customer Satisfaction 4.25 4.00 
028 Percent of Successful Backups 99.00% 98.00% 
029 Percent of Successful File Restorations 98.50% 98.00% 
039 Storage Replication Availability 99.50% 99.00% 
SAP Service Levels 
018 Database Availability - Production 99.50% 99.00% 
055 Database Availability - Non Production 97.00% 95.00% 
019 Event/Alert Monitoring Application Availability 99.50% 99.00% 
020 Production Server Availability 99.90% 99.50% 
085 Non Production Server Availability 99.00% 98.00% 
021 Enterprise Storage Availability 99.99% 99.95% 
031 Data Center LAN Availability 99.95% 99.95% 
032 Security Device Availability 99.95% 99.95% 
SAP Service Levels 
040 SAP Availability - Production 99.95% 99.95% 
044 SAP Availability - Non-Production 98.00% 98.00%
Novelis Performance on KPI’s 
SL# KPI Name 
Expected Service 
Level 
Minimum Service 
Level 
SAP Service Levels 
002 Incident Response Time - All Severity Level 3 Incidents 93.00% 90.00% 
002 Incident Response Time - All Severity Level 4 Incidents 93.00% 90.00% 
004 Service Request Response Time 95.00% 93.00% 
006 Incident Resolution Time - All Severity Level 3 Incidents 93.00% 90.00% 
006 Incident Resolution Time - All Severity Level 4 Incidents 93.00% 90.00% 
010 Service Level Reports Delivery 95.00% 90.00% 
012 Security-Related Correlated Log Report Delivery Success 95.00% 95.00% 
017 Standard Reports Delivery 95.00% 90.00% 
043 Change Management Success Rate - Standard 98.00% 95.00% 
SAP Service Levels 
022 Database Availability - Non-Production 96.00% 95.00% 
023 Non-Production Server Availability 96.00% 95.00% 
033 Security Service Availability 99.00% 99.00% 
034 Successful Tape Vaulting 99.99% 99.50% 
SAP Service Levels 
045 SAP Average Response Time at Peak Dialog Hour - Non-Production 800ms 1000ms 
046 SAP Average Response Time at Peak Dialog Hour - Production 800ms 1000ms 
047 SAP Average Response Time in Dialog Task - Non-Production 800ms 1000ms 
048 SAP Average Response Time in Dialog Task - Production 800ms 1000ms 
057 SAP Average Database Response Time in Dialog Task - Non-Production 600ms 800ms 
058 SAP Average Database Response Time in Update Task - Non-Production 600ms 800ms 
059 SAP Average Database Response Time in Dialog Task - Production 600ms 800ms 
060 SAP Average Database Response Time in Update Task – Production 600ms 800ms 
054 SAP Batch Jobs Successfully Completed Within Pre-Established Windows – Production 96.00% 96.00% 
061 SAP Event/Alert Monitoring Application Availability 95.00% 95.00%
Availability Root Cause Analysis & Trending 
Actions Taken to Prevent Future Occurrences of Unavailability 
• Full Debrief on Each Occurrence 
• Determine Root Cause of Each Occurrence 
• Devise Plan to Prevent Future Occurrences 
• Trend each Occurrence to Capture and 
Correct Problem Areas
Minimizing Planned Outages (A Preview) 
Improve continuous availability by minimizing scheduled outages: 
 Maintain a significant amount of excess hardware capacity and 
expand hardware capacity as seldom as possible (yearly) 
 Consolidate maintenance into fewer “bigger” events 
 Monitor SAP Service Marketplace for enhancements that reduce 
the outage for kernel upgrades, release upgrades and support 
packs 
 Replace standard SAP upgrades with Time Optimized Upgrades 
or Downtime minimized upgrades. 
 Multiple rehearsals on non production systems to ensure the 
timing, steps and potential problems of implementing changes 
have been identified 
 Minimize post upgrade incidents with Load/Stress and cycle 
testing 
The Program Management Office should plan and fund for an 
active SAP Infrastructure Life Cycle Management Process as 
part of the SAP program
ITIL Availability Management Process 
SAP Infrastructure Components 
Availability Results & Analysis 
Summary/References
Summary 
 Utilize the ITIL Service Delivery Processes for Availability 
and Service Level Management 
 Implement Guidelines and Tools for measuring 
Availability and Service Levels 
 Identify the Infrastructure Components Critical to the 
Delivery of the SAP Solution 
 Use Solution manager functionality to streamline SAP 
operations 
 Conduct Risk Assessment of Potential Unplanned 
Outages 
 Minimizing Planned Outages
Further Information 
 
Public Web: 
SAP Service Marketplace References: 
http://service.sap.com/solutionmanager 
http://wiki.sdn.sap.com/wiki/display/SAPITSM 
http://service.sap.com/alm 
http://wiki.sdn.sap.com/wiki/display/SMSETUP/Home 
ITIL References 
http://itsmfusa.org 
http://www.itil.co.uk/index.htm 
 Americas’ SAP Users’ Group (ASUG) 
www.asug.com – Business Integration, Technology & Infrastructure (BITI) Communities Page
THANK YOU FOR YOUR 
ATTENTION ! 
QUESTIONS – SUGGESTIONS – DISCUSSION

Sap tech ed_Delivering Continuous SAP Solution Availability

  • 1.
    ITM 119 ITM119Delivering Continuous SAP Solution Availability Lovnish Mahajan, Basis Architect & Robert Max, Application Technology Manager, Novelis
  • 2.
    Agenda Lovnish Mahajan,SAP Basis Architect Robert Max, Global Applications Technology Manager Availability Management, BASIS Technologies ITIL Availability Management Process SAP Infrastructure Components Investment in Solution Manager Summary/References
  • 3.
    About – LovnishMahajan  Partner in Parvotech Inc.- SAP consulting boutique - specializing in remote BASIS, Solution Manager and HANA consulting .  SAP Certified BASIS, HANA and Solution Manager Architect.  Over 15 years of experience in SAP BASIS Technologies, ALM, ITSM and Security with SMBs and Fortune 500 companies.  Extensive Experience in strategy, design, development and successful deployment of Application Life Cycle Mgmt. and IT service Mgmt.  Speaker at various conferences including SAPPHIRE, ASUG Annual conference and SAP TechEd.
  • 4.
    About – RobertMax  Is currently responsible for the technical support of Novelis’ portfolio of global applications including the teams supporting Solution Manager and delivering SAP Basis and Security Administration services.  He has had a key role in the construction of two of the world’s largest SAP Implementations for Fortune 500 consumer products companies.  Active in ASUG, Robert was the founding leader of the Solution Manager SIG, has spoken at numerous ASUG Annual Conference, SAP Active Global Support and TechEd Conferences as well as many regional events.  He has presented at ASUG events, TechEd and SAPPHIRE and awarded best presenter at an SAP AGS event in Walldorf
  • 5.
    Learning Objectives Asa result of this session, you will be able to:  Describe the ITIL Process for improving Availability  Identify potential Infrastructure Availability issues  Investment in SAP Solution Manager Functionality to improve availability  Minimize Planned Outages Since Go-Live in Oct 2012, SAP Application availability at Novelis has been 99.96% with only TWO scheduled maintenance days annually
  • 6.
    Novelis Global Footprint 9 1,800 Countries 25 2,786 Kt Employees Revenues North America 3,100 $3.4 Billion Europe $3.2 Billion 1,800 Employees Shipments Operations $9.8b Revenues 11,000 FRP Shipments 988 kt and Sales Based on FY 2013 Results; Employees as of March 31, 2013 4,300 847 kt Asia $1.8 Billion 556 kt South America $1.4 Billion 395 kt Shipments and Sales Based on FY 2013 Results; Employees as of March 31, 2013
  • 7.
    Introduction to Novelisand SAP Program Novelis is the world leader in rolled aluminum products, delivering unique solutions for the most demanding global applications, such as beverage cans, automobiles, architecture and consumer electronics. First SAP Go-Live 2012 2014 Where Used U.S and Canada, Worldwide SAP Version Installed Other Bolt-ons, Applications Implemented ERP- Ehp5, BI 7.3, SCM 7.0 Ehp2, SBOP 4.0, GRC, Solution manager-SP11 SABRIX, TIBCO, SharePoint, SaaS applications i.e. Poornata, Rate hub, Legacy MES interfaces Adopted SAP Application Life-Cycle Management ChaRM, SD, SMSY, Monitoring, HP ALM Team dynamics Novelis CoE ( Center of Excellence) AMS and SAPoD Hosting partner
  • 8.
    ITIL Availability ManagementProcess SAP Infrastructure Components Investment in Solution Manager Summary/References
  • 9.
    ITIL Service DeliveryProcesses Service Desk IT Infrastructure Service Level Management Maintain and improve IT service quality, through a constant cycle of agreeing, monitoring and reporting on IT service achievements Availability Management Providing the sustained level of availability required by the business in a cost effective manner Capacity Management Ensuring that the capacity and performance needs of the business are being met IT Service Continuity Management Ensuring that the necessary IT services can be recovered within the agreed business timescales Financial Management for IT Services Cost-effective control and management of the IT assets and the financial resources used in delivering IT Services
  • 10.
    ITIL Availability ManagementProcess RelationshipsITIL PROCESSES Outage Reports & Details Of Incidents affecting Availability Measurements and Reporting on IT Service Availability Availability Management Providing the sustained level of availability required by the business in a cost effective manner Incident Management Focusing on the quick restoration of service minimizing the impact to the business. Service Level Management Maintain and improve IT service quality, through a constant cycle of agreeing, monitoring and reporting on IT service achievements Configuration Management Identifying, controlling and verifying IT components and their inter-relationships. Provides information key to the other processes. Component Failure Impact Analysis (CFIA) Problem Management Getting to the root cause of incidents and ensuring that permanent solutions are deployed to prevent reoccurrence. Identify Trends and Instigate Remedial Actions The processes decide GOAL ACTIVITIES RESULT FEEDBACK
  • 11.
    ITIL Availability ManagementProcess SAP Infrastructure Components Investment in Solution Manager Summary/References
  • 12.
    SAP Infrastructure Components SAP Infrastructure SAP Application Bolt-Ons Messaging Database Server/Storage Network Data Center • Solution Manager Push Alerting • “Other” Tools/Scripts Alerting Real-Time Monitoring/Alerting • Checklist Manual Health Based 1X Daily Health Reviews Reviews •Deep-Dive capabilities and tools for RCA and corrective action Root Cause Analysis Capabilities •SAP EarlyWatch Reports, IT Performance Reporting •System Reviews Trending •Operations Proactive Opportunities •Monthly Capacity and Performance Trending Proactive Reviews and Improvements Capacity Planning •Quarterly Long-Term Capacity and demand Reviews
  • 13.
    SAP Monitoring Capabilities Realtime Periodic Strategic • Solution Manager Push Alerting • “Other” Tools/Scripts Alerting Real-Time Monitoring/Alerting • Checklist Based 1X Daily Health Reviews Manual Health Reviews • Deep-Dive capabilities and tools for RCA and corrective action Root Cause Analysis Capabilities • SAP EarlyWatch Reports, IT Performance Reporting • System Reviews Trending • Operations Proactive Opportunities • Monthly Capacity and Performance Trending Proactive Reviews and Improvements • Quarterly Long-Term Capacity and demand Reviews Capacity Planning
  • 14.
    The SAP Solution Five (5) Production SAP Systems delivering business solutions (ECC, SCM, GRC, BW) 48 plus active production and non-production SAP Systems Federated Solution includes 8 plus bolt on products 40+ Terabytes SAN storage; 50+ of UNIX servers; 10+ Windows servers Oracle and DB2 DBMS In-house COE , AMS partner and Hosting partner SAPoD
  • 15.
    Measuring Unavailability -Criteria Unplanned Outages  Single Point of Failure  Exceeding Planned Outage Windows  Lengthy Period of No Response Consistent, repeatable end user transactions from multiple locations Proactively find availability and performance issues before customers do Reduce end user outages by proactively managing with performance and availability trends Planned Outages  Planned Non Concurrent Maintenance  Consolidations and Relocations  Upgrades and Go-Lives Consistent, repeatable end user transactions from multiple locations Proactively find availability and performance issues before customers do Reduce end user outages by proactively managing with performance and availability trends Service Level Failures  Batch Processing Windows Exceeded  Lengthy Transaction Response Time  Business Process Monitoring (BPM) Alerts Consistent, repeatable end user transactions from multiple locations Proactively find availability and performance issues before customers do Reduce end user outages by proactively managing with performance and availability trends
  • 16.
    Measuring Unavailability Asystem is unavailable when:  A Critical event has been declared (critical event criteria has been defined per SLA)  Root cause of the critical event is attributed to the Basis area of responsibility versus the business process or functionality layer.  No new users can log on to the system Notes:  Each key group measures the hours their resource is off line.  If a component has failed and the system remains accessible, this is not measured.  In some cases number of outages may be a more reliable measurement than hours of unavailability  Worker Hours lost can be a good measurement of business impact (e.g. Resource Outage plus time necessary to restart the manufacturing line).
  • 17.
    SAP Solution AvailabilityMonitoring Tools SAP Infrastructure SAP Application Bolt-Ons Messaging Database Server/Storage Network Data Center Monitoring Business Processes Service Levels Events Alerts Tools HCL- Nimsoft Solution Manager
  • 18.
    ITIL Availability ManagementProcess SAP Infrastructure Components Investment in Solution Manager Summary/References
  • 19.
  • 20.
    Novelis- Road Mapto BPML Review Solution Documentation Global Template Setup Setup for Implementation Projects • Review Business process/Document ation in SolMan • Identifying lag of usage of SOLAR01/02 (transactions, IMG activities, test procedure; process owner, user…) • How to link SharePoint with SOLAR01/02 • Business processes mapped • Current objects/programs/ interfaces added • Map custom programs into the Solutions • Import/Link Business Process Documents into SolMan • Maintenance Project Setup • Setup up Global template • Global landscape, business process information, test scripts and Training document • Create Implementation Projects for country/region specific roll outs • Setup Solution Manager for Business blueprint, configuration, documentation • Centralized configuration and development • Testing integration with HP ALM & TAO
  • 21.
    Novelis – Useof Solution Manager Road Map Service Desk ChaRM – Change Request Management Business Process Change Analysis Integration to HP QC Integration to Job Scheduling System Business Process Management Incident and problem Management Multilevel Categorizatio n Service Level Agreement (SLA) Monitoring Implement ChaRM( Normal, Urgent, Defect) Automated workflow and approval process Automation for transports of the production environment Retrofit and CSOL Management Dashboards and reporting Integrate HP ALM with Solution Manager Best practices for Testing Automated testing – Integration testing Integration into SAP TAO Integrate external job scheduling system into Solution Manager Best practices for Batch job Process Automated Incident and Change Management Activate Business process Monitoring Activate Business process Management SLA setup Management Scorecard/ reporting Use BPCA for support pack upgrade, Major release upgrades Include BPCA in change request management
  • 22.
    Novelis –Run SAPlike a Factory Technical Monitoring Interface Monitoring Diagnostics/Root Cause Analysis Technical Administration Technical Monitoring and Alerting EWA – reports Alerts/Notifications mechanism Reporting Dashboards Scorecards Tibco App Integration monitoring at technical and queue levels End to End interface Monitoring Alerts/Notification Mechanism Reporting Maintenance optimizer OSS Integration Downtime Management System Administration Reporting Dashboards Scorecards End-to- End workload Analysis End-to-End Trace Analysis System, Host & Database Analysis End- to –End Business process monitoring
  • 23.
    Novelis Test Lifecycle QA CoE Test Lifecycle Phases Definition – TG1 Requirements – TG1 Design – TG2 Build – TG3 Testing – TG3 Deployment – TG4 - Receive project request for QA CoE services - Understand project definition & scope - Define roles, responsibilities and assign resources - Recommend QA CoE test management tools - Recommend QA CoE test verification/automation tools - Establish test activity reporting and communication matrix - Define QA documentation repository for new project - Provide level 0 estimate to PM for QA activity - Attend project kick-off meeting - Understand requirement and attend requirement walkthrough - Perform requirement validation & get sign off - Provide QA CoE testing guidelines: Test Strategy and QC Best Practices - Draft high-level test plan for new project - Provide level 1/2 estimates to PM - Understand design specification& attend design spec. walkthrough - Design specification validation - Understand system database schema and implementation specs - Develop detailed test plan and test cases - Configure testing tools and software for new project - Create QA environments - Provide level 3 estimate to PM - Perform Business Impact Analysis (scope changes) - Conduct shakeout testing by Dev. - Conduct unit and integration testing by Dev. - Gain unit and integration testing sign-off - Update QA test cases if required - Conduct QA test plan & test cases walkthrough and obtain sign off - Create test data (if applicable) - Identify UAT teams - Create UAT test plan & test cases - Coordinate schedules for iterative QA build releases - Conduct system functional testing – manual and automation (unit, string, integration, regression) - Conduct defect reporting, fixing and QA revalidation for build release iterations - Provide metrics for build release iterations to project stakeholders - Conduct user acceptance testing and sign off -Conduct operational Readiness/Security Testing - Conduct production conversion testing (if applicable) - Conduct performance testing - Gain QA testing signoff for project - Acquire deployment authorization - Perform lights on sanity test (i.e. system configuration and software installation testing - if applicable) - Gain deployment sign-off - Transition resources to production support (if applicable) - Post Deployment Verification & performance recognition - Review metrics and lessons learned for process improvement - Archive artifacts - Project closeout Novelis PMM Gates Scope Analysis & Design Build, Test, Train Go-Live & Close
  • 24.
    Technology: Testing Tools Conceptual Design & Licensing Project Planning & Tracking Release Management Requirements Mgt. Business Models Test Plan Test Lab Defect Mgt Application Lifecycle Management (ALM) (Quality Center) Define Application Requirements SAP Solution Manager SAP SolMan Integration Adapter BPT QTP Service Test Service Test Mgt (Test Data Mgt) TAO Diagnostics Fortify 360 QA Inspect Unified Functional Testing (UFT) Web Inspect SAP Legend SAP Tool SAP Purchase SAP HP Integration Tool HP Tool HP In-House Purchase Performance Center (Load Runner) Test Data Mgt. Q A Users / Testers
  • 25.
    Novelis Performance onCPI’s SL# CPI Name Expected Service Level Minimum Service Level SAP Service Levels 001 Incident Response Time – All Severity Level 1 Incidents 95.00% 90.00% 001 Incident Response Time – All Severity Level 2 Incidents 95.00% 90.00% 003 Project Timeliness 95.00% 90.00% 005 Incident Resolution Time – All Severity Level 1 Incidents 95.00% 90.00% 005 Incident Resolution Time – All Severity Level 2 Incidents 95.00% 90.00% 007 Change Management Success Rate - Emergency 95.00% 90.00% 008 Root Cause Analysis Delivery Rate 95.00% 90.00% 009 Dashboard Availability 99.50% 99.00% 016 Customer Satisfaction 4.25 4.00 028 Percent of Successful Backups 99.00% 98.00% 029 Percent of Successful File Restorations 98.50% 98.00% 039 Storage Replication Availability 99.50% 99.00% SAP Service Levels 018 Database Availability - Production 99.50% 99.00% 055 Database Availability - Non Production 97.00% 95.00% 019 Event/Alert Monitoring Application Availability 99.50% 99.00% 020 Production Server Availability 99.90% 99.50% 085 Non Production Server Availability 99.00% 98.00% 021 Enterprise Storage Availability 99.99% 99.95% 031 Data Center LAN Availability 99.95% 99.95% 032 Security Device Availability 99.95% 99.95% SAP Service Levels 040 SAP Availability - Production 99.95% 99.95% 044 SAP Availability - Non-Production 98.00% 98.00%
  • 26.
    Novelis Performance onKPI’s SL# KPI Name Expected Service Level Minimum Service Level SAP Service Levels 002 Incident Response Time - All Severity Level 3 Incidents 93.00% 90.00% 002 Incident Response Time - All Severity Level 4 Incidents 93.00% 90.00% 004 Service Request Response Time 95.00% 93.00% 006 Incident Resolution Time - All Severity Level 3 Incidents 93.00% 90.00% 006 Incident Resolution Time - All Severity Level 4 Incidents 93.00% 90.00% 010 Service Level Reports Delivery 95.00% 90.00% 012 Security-Related Correlated Log Report Delivery Success 95.00% 95.00% 017 Standard Reports Delivery 95.00% 90.00% 043 Change Management Success Rate - Standard 98.00% 95.00% SAP Service Levels 022 Database Availability - Non-Production 96.00% 95.00% 023 Non-Production Server Availability 96.00% 95.00% 033 Security Service Availability 99.00% 99.00% 034 Successful Tape Vaulting 99.99% 99.50% SAP Service Levels 045 SAP Average Response Time at Peak Dialog Hour - Non-Production 800ms 1000ms 046 SAP Average Response Time at Peak Dialog Hour - Production 800ms 1000ms 047 SAP Average Response Time in Dialog Task - Non-Production 800ms 1000ms 048 SAP Average Response Time in Dialog Task - Production 800ms 1000ms 057 SAP Average Database Response Time in Dialog Task - Non-Production 600ms 800ms 058 SAP Average Database Response Time in Update Task - Non-Production 600ms 800ms 059 SAP Average Database Response Time in Dialog Task - Production 600ms 800ms 060 SAP Average Database Response Time in Update Task – Production 600ms 800ms 054 SAP Batch Jobs Successfully Completed Within Pre-Established Windows – Production 96.00% 96.00% 061 SAP Event/Alert Monitoring Application Availability 95.00% 95.00%
  • 27.
    Availability Root CauseAnalysis & Trending Actions Taken to Prevent Future Occurrences of Unavailability • Full Debrief on Each Occurrence • Determine Root Cause of Each Occurrence • Devise Plan to Prevent Future Occurrences • Trend each Occurrence to Capture and Correct Problem Areas
  • 28.
    Minimizing Planned Outages(A Preview) Improve continuous availability by minimizing scheduled outages:  Maintain a significant amount of excess hardware capacity and expand hardware capacity as seldom as possible (yearly)  Consolidate maintenance into fewer “bigger” events  Monitor SAP Service Marketplace for enhancements that reduce the outage for kernel upgrades, release upgrades and support packs  Replace standard SAP upgrades with Time Optimized Upgrades or Downtime minimized upgrades.  Multiple rehearsals on non production systems to ensure the timing, steps and potential problems of implementing changes have been identified  Minimize post upgrade incidents with Load/Stress and cycle testing The Program Management Office should plan and fund for an active SAP Infrastructure Life Cycle Management Process as part of the SAP program
  • 29.
    ITIL Availability ManagementProcess SAP Infrastructure Components Availability Results & Analysis Summary/References
  • 30.
    Summary  Utilizethe ITIL Service Delivery Processes for Availability and Service Level Management  Implement Guidelines and Tools for measuring Availability and Service Levels  Identify the Infrastructure Components Critical to the Delivery of the SAP Solution  Use Solution manager functionality to streamline SAP operations  Conduct Risk Assessment of Potential Unplanned Outages  Minimizing Planned Outages
  • 31.
    Further Information  Public Web: SAP Service Marketplace References: http://service.sap.com/solutionmanager http://wiki.sdn.sap.com/wiki/display/SAPITSM http://service.sap.com/alm http://wiki.sdn.sap.com/wiki/display/SMSETUP/Home ITIL References http://itsmfusa.org http://www.itil.co.uk/index.htm  Americas’ SAP Users’ Group (ASUG) www.asug.com – Business Integration, Technology & Infrastructure (BITI) Communities Page
  • 32.
    THANK YOU FORYOUR ATTENTION ! QUESTIONS – SUGGESTIONS – DISCUSSION