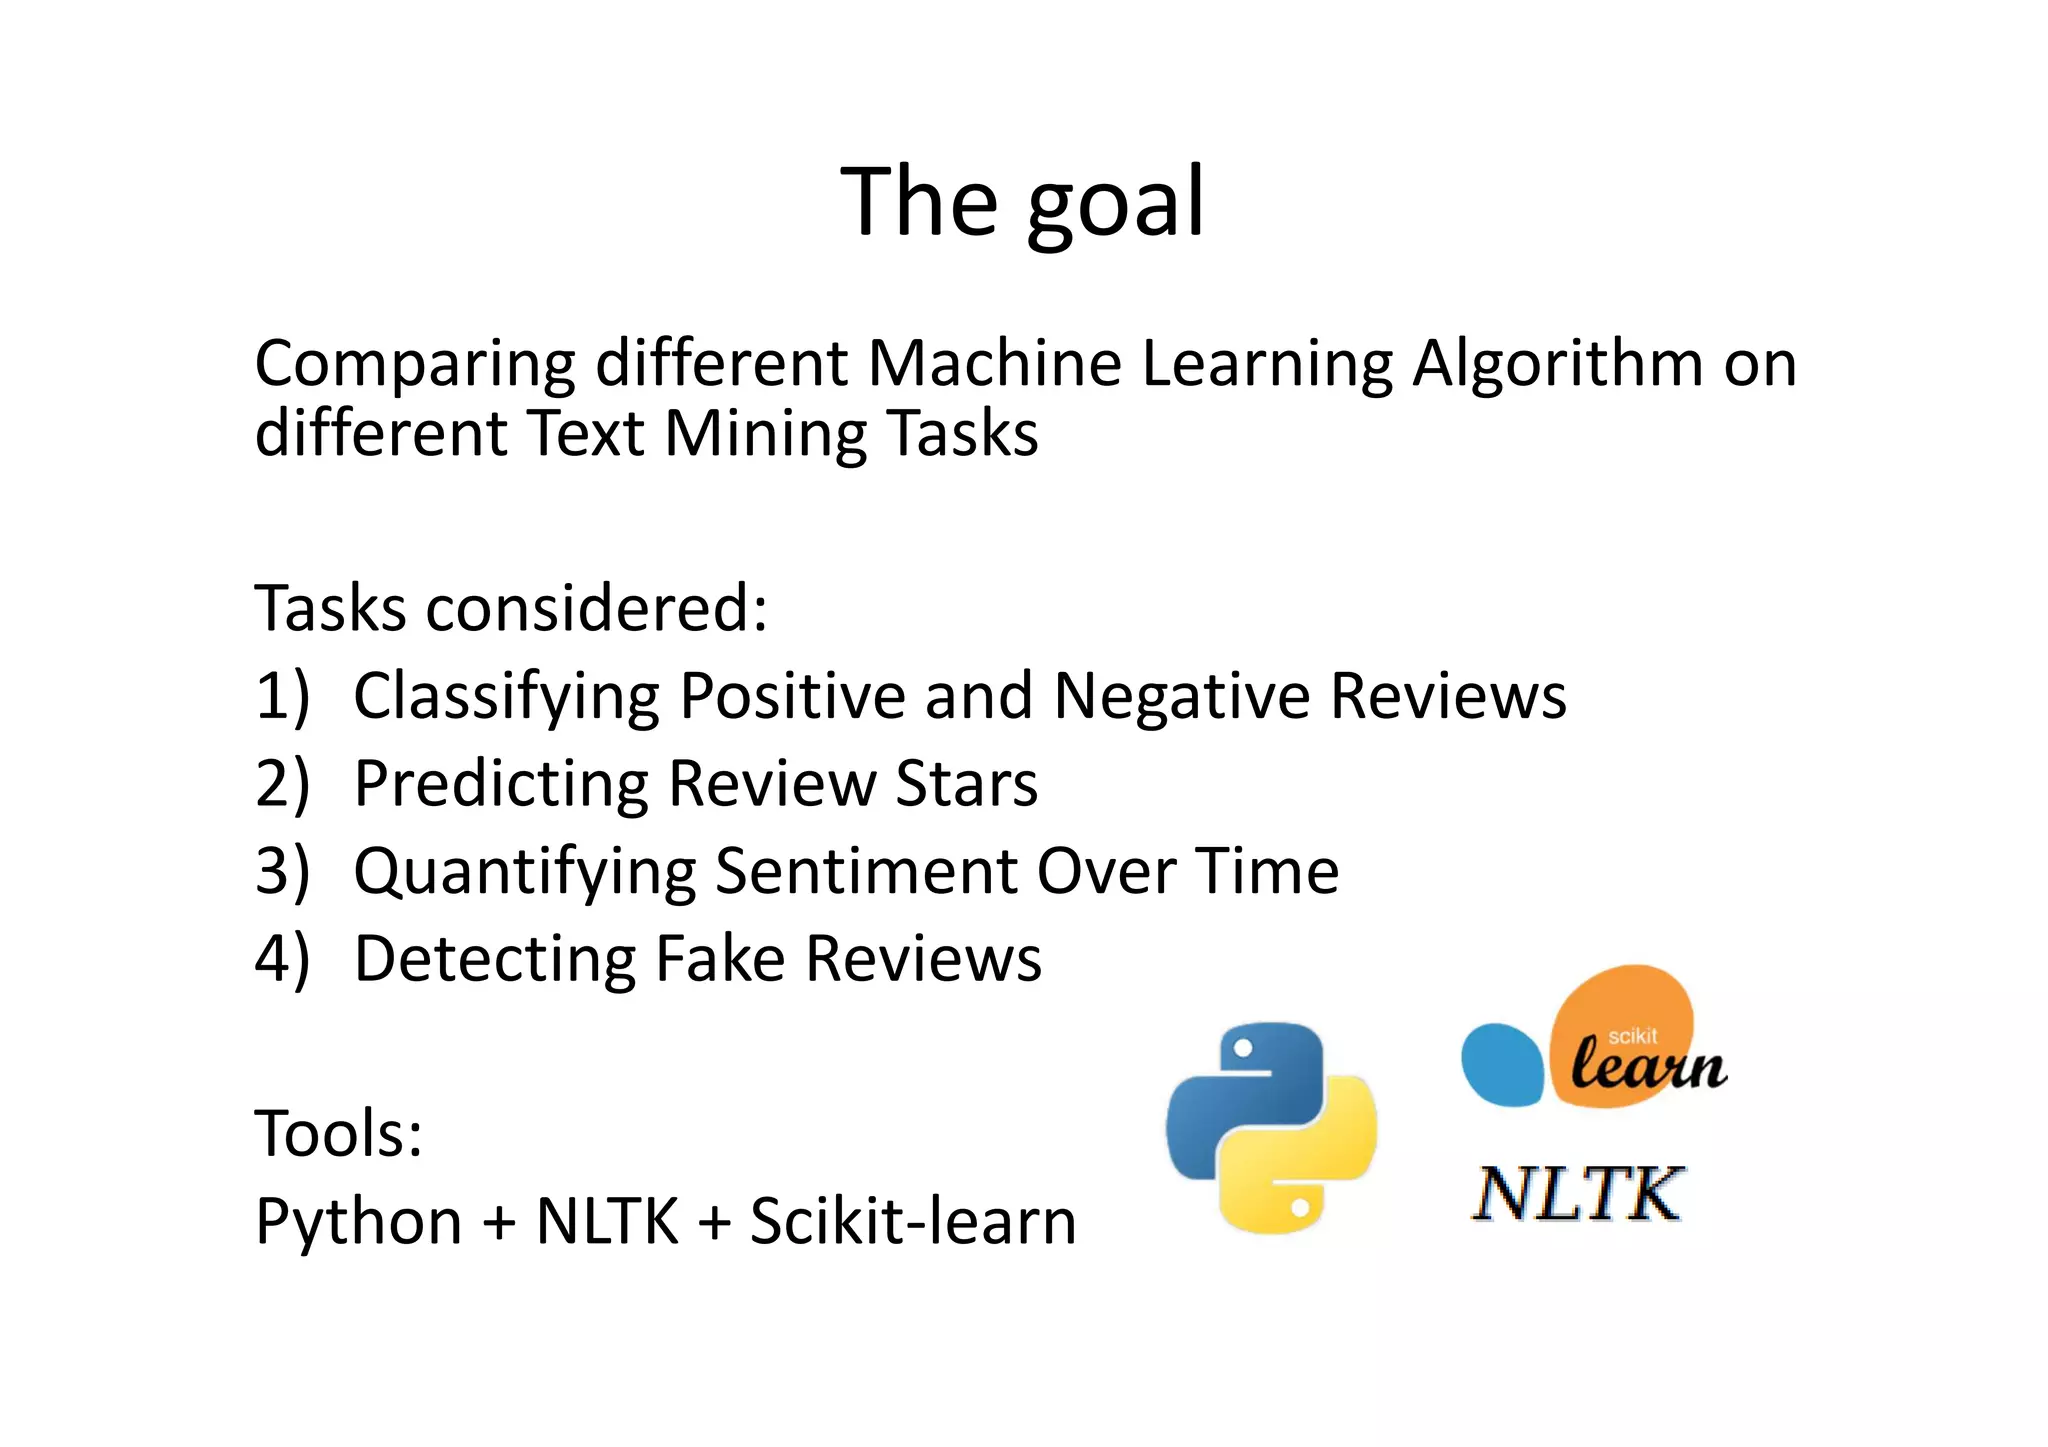
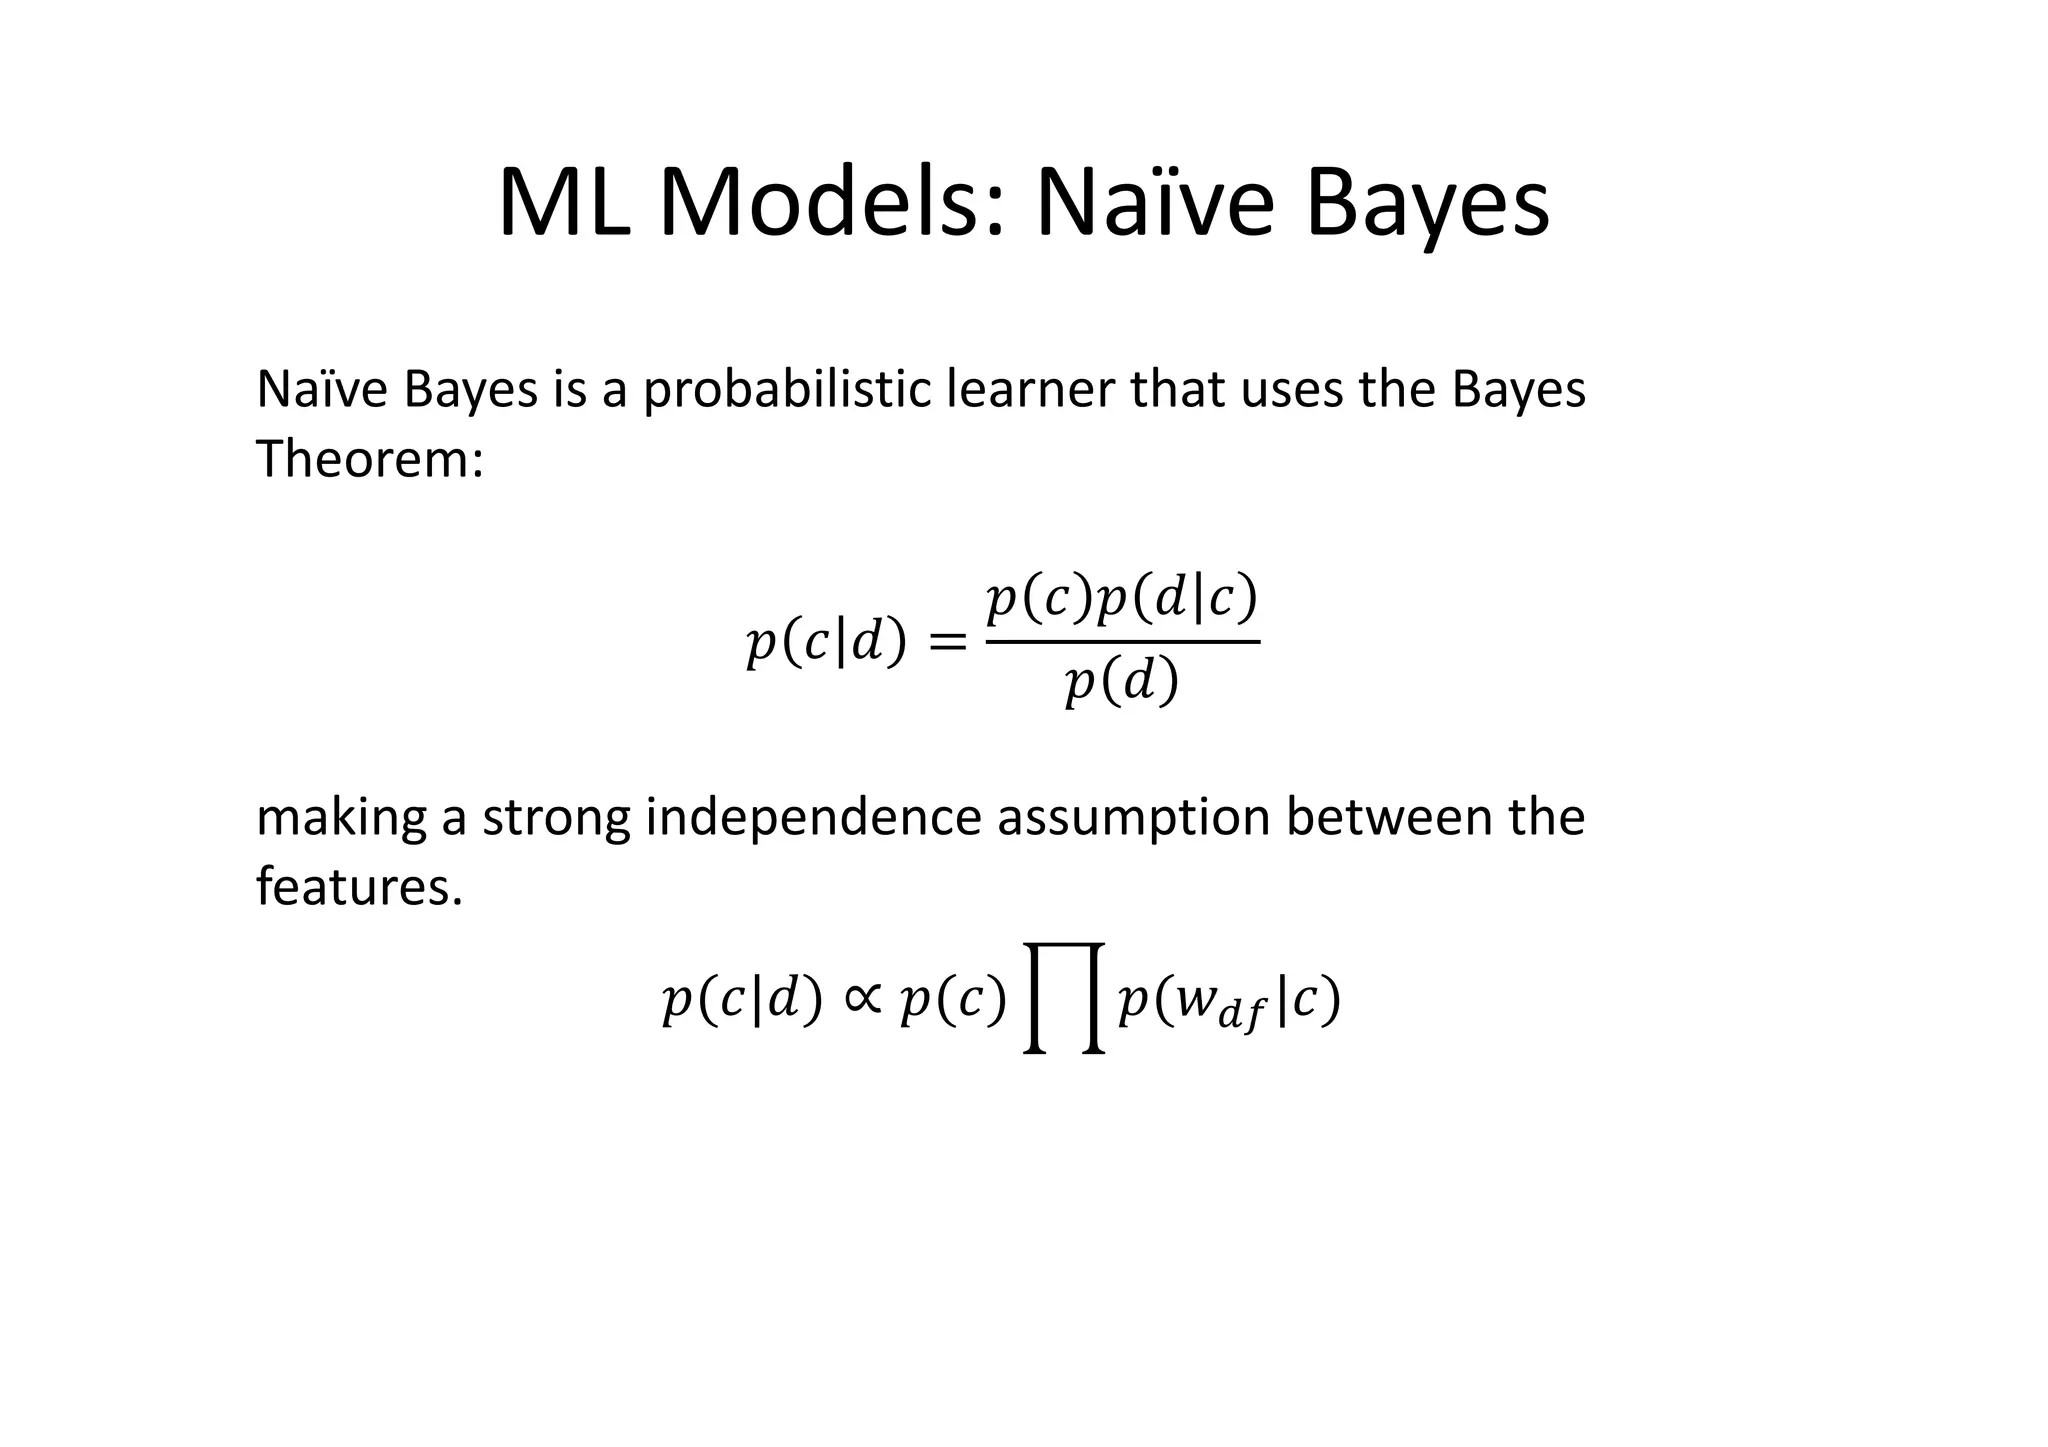
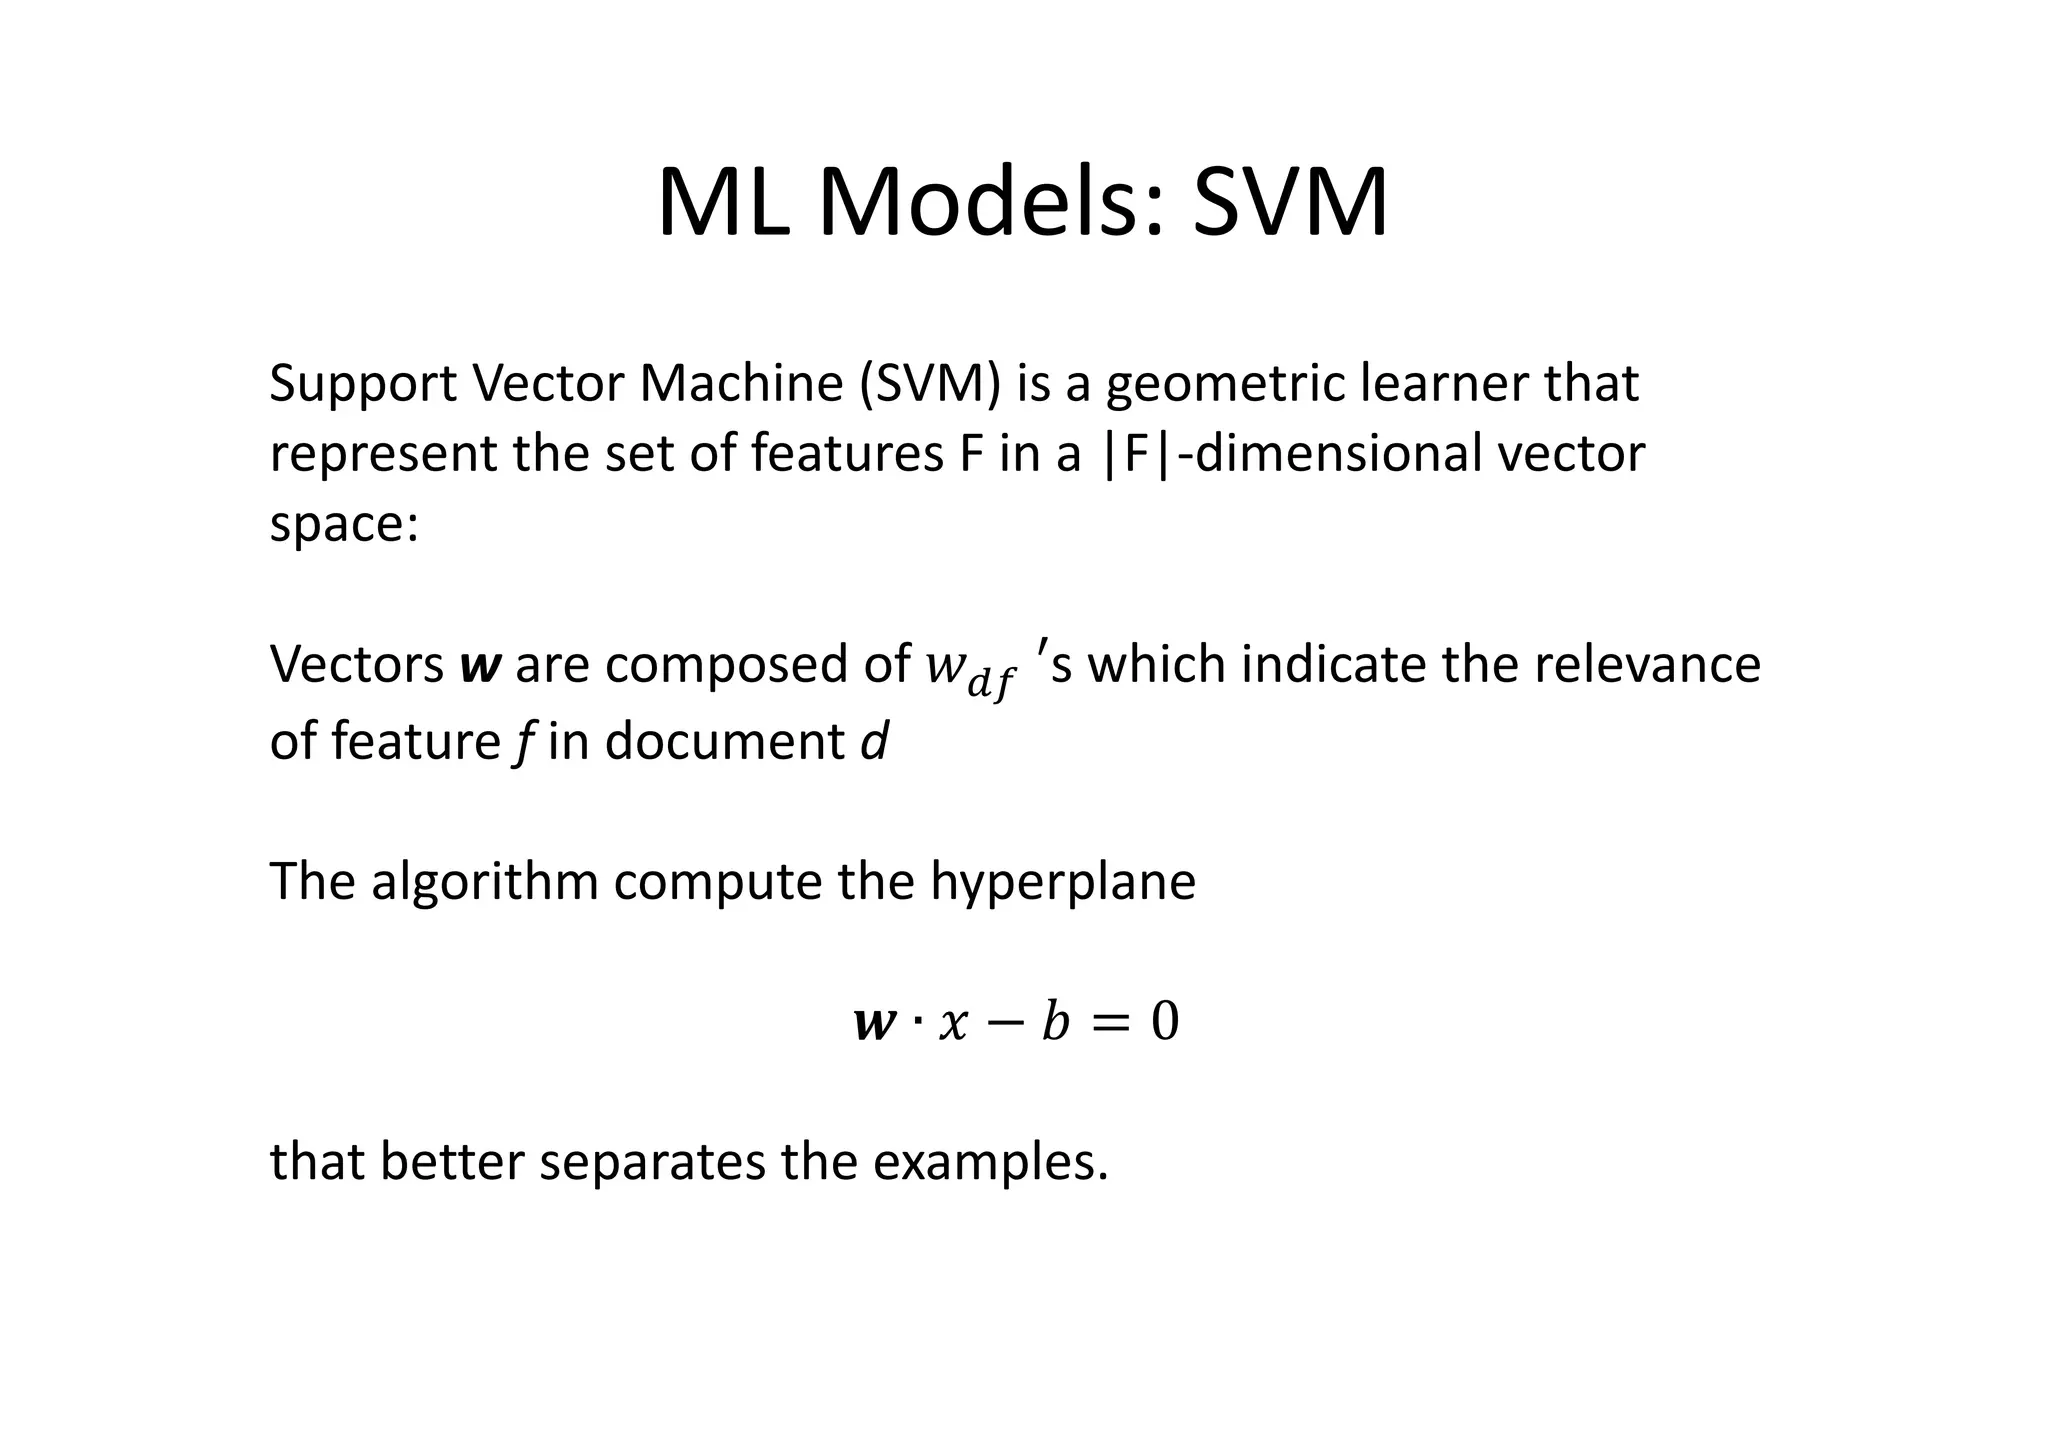
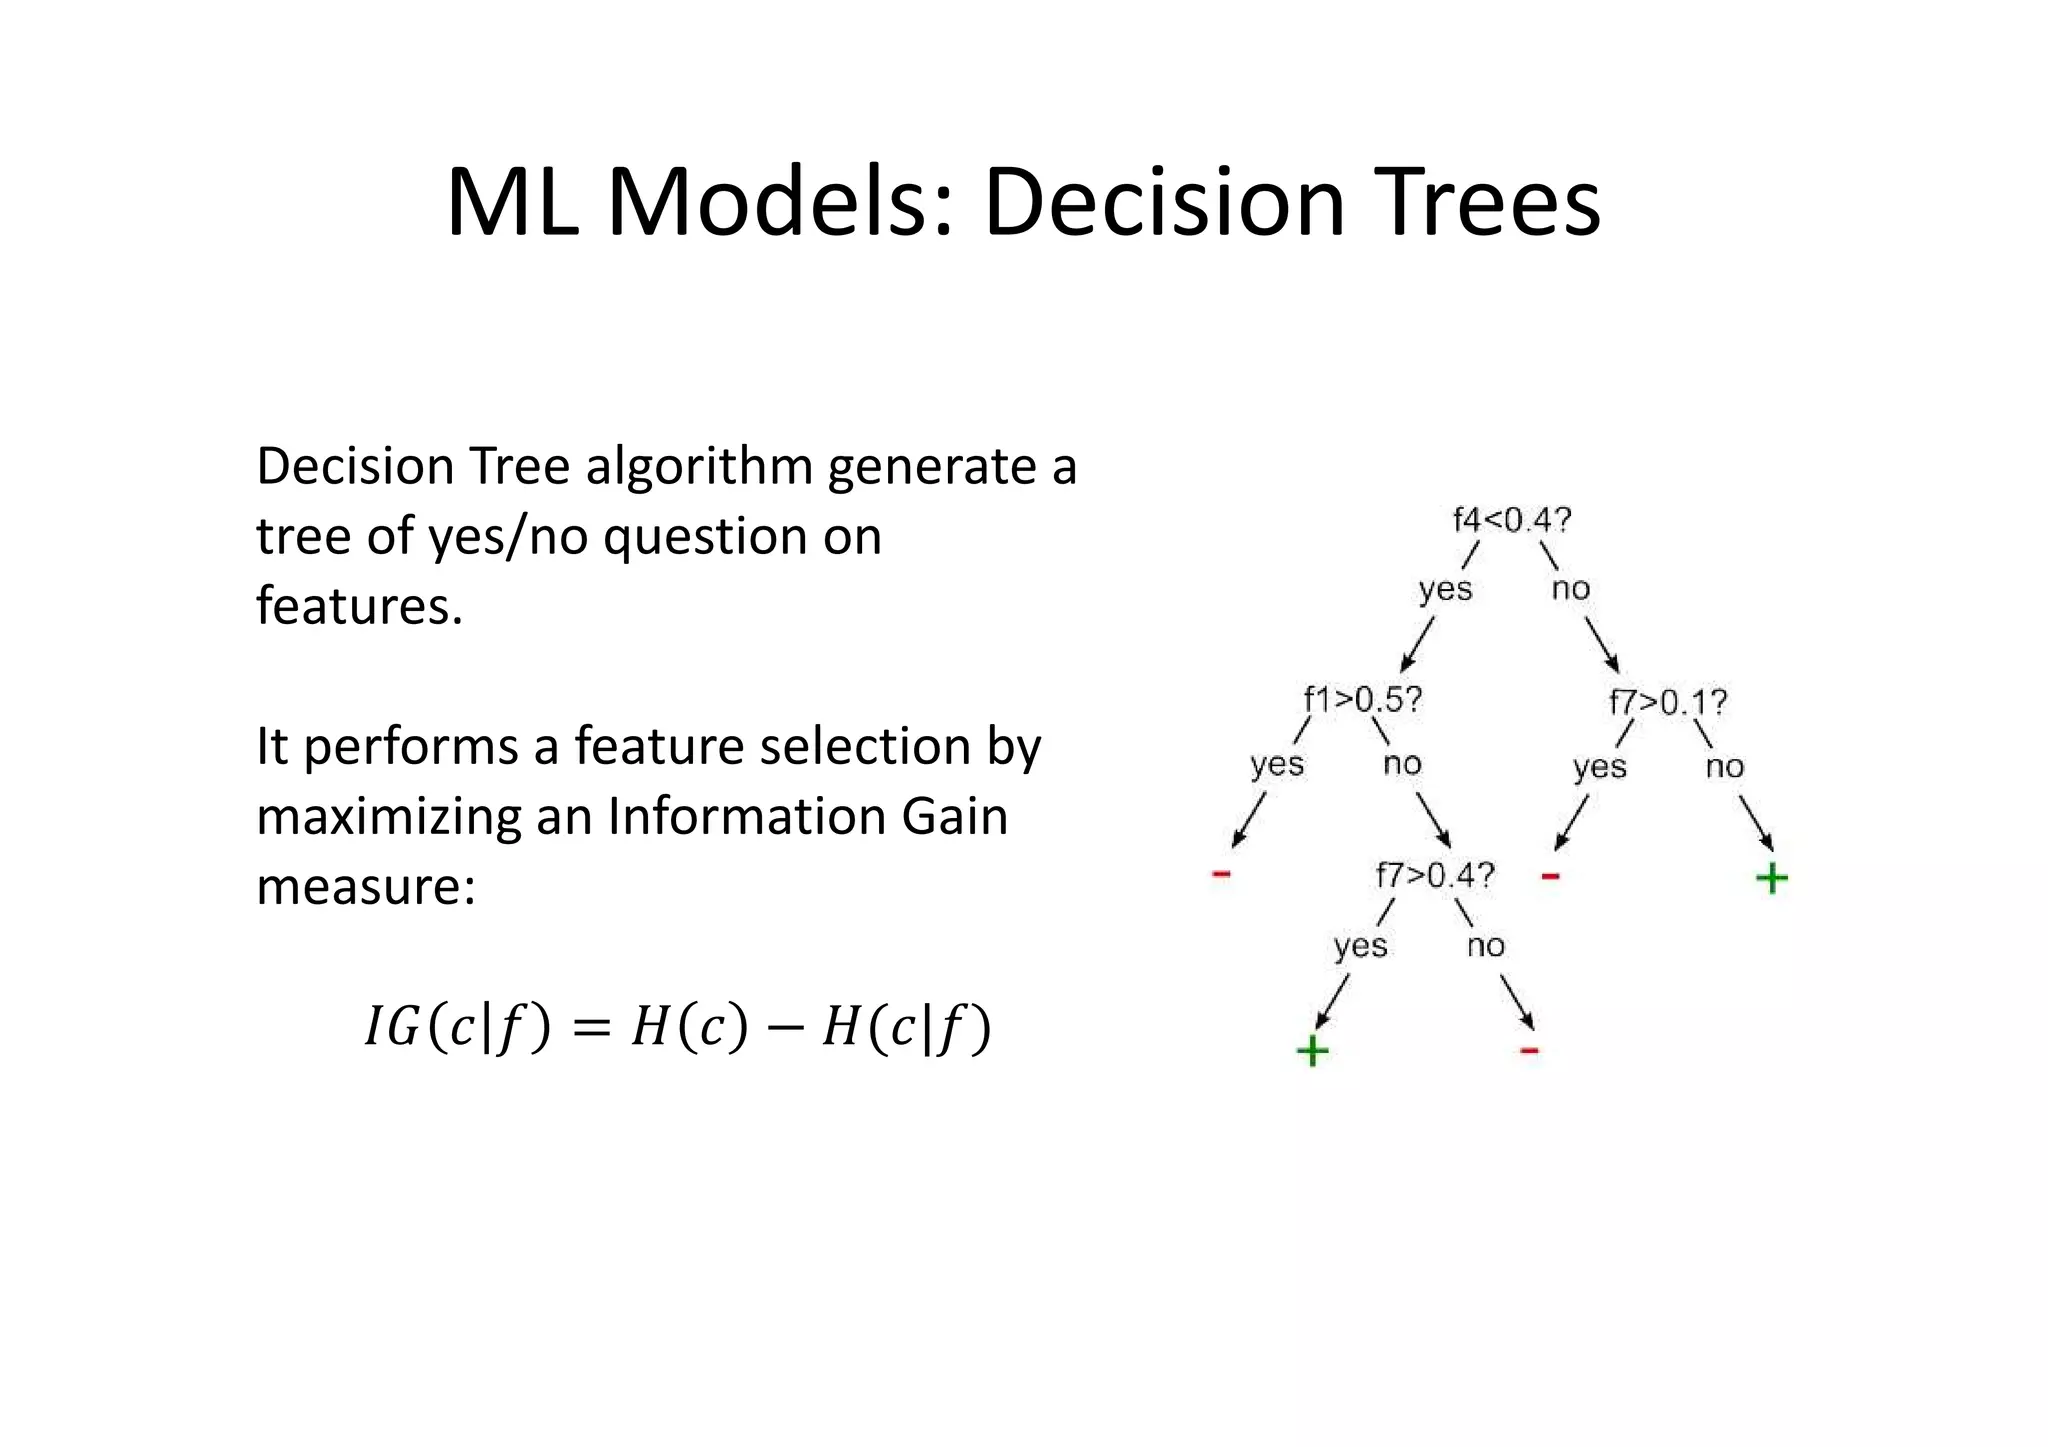
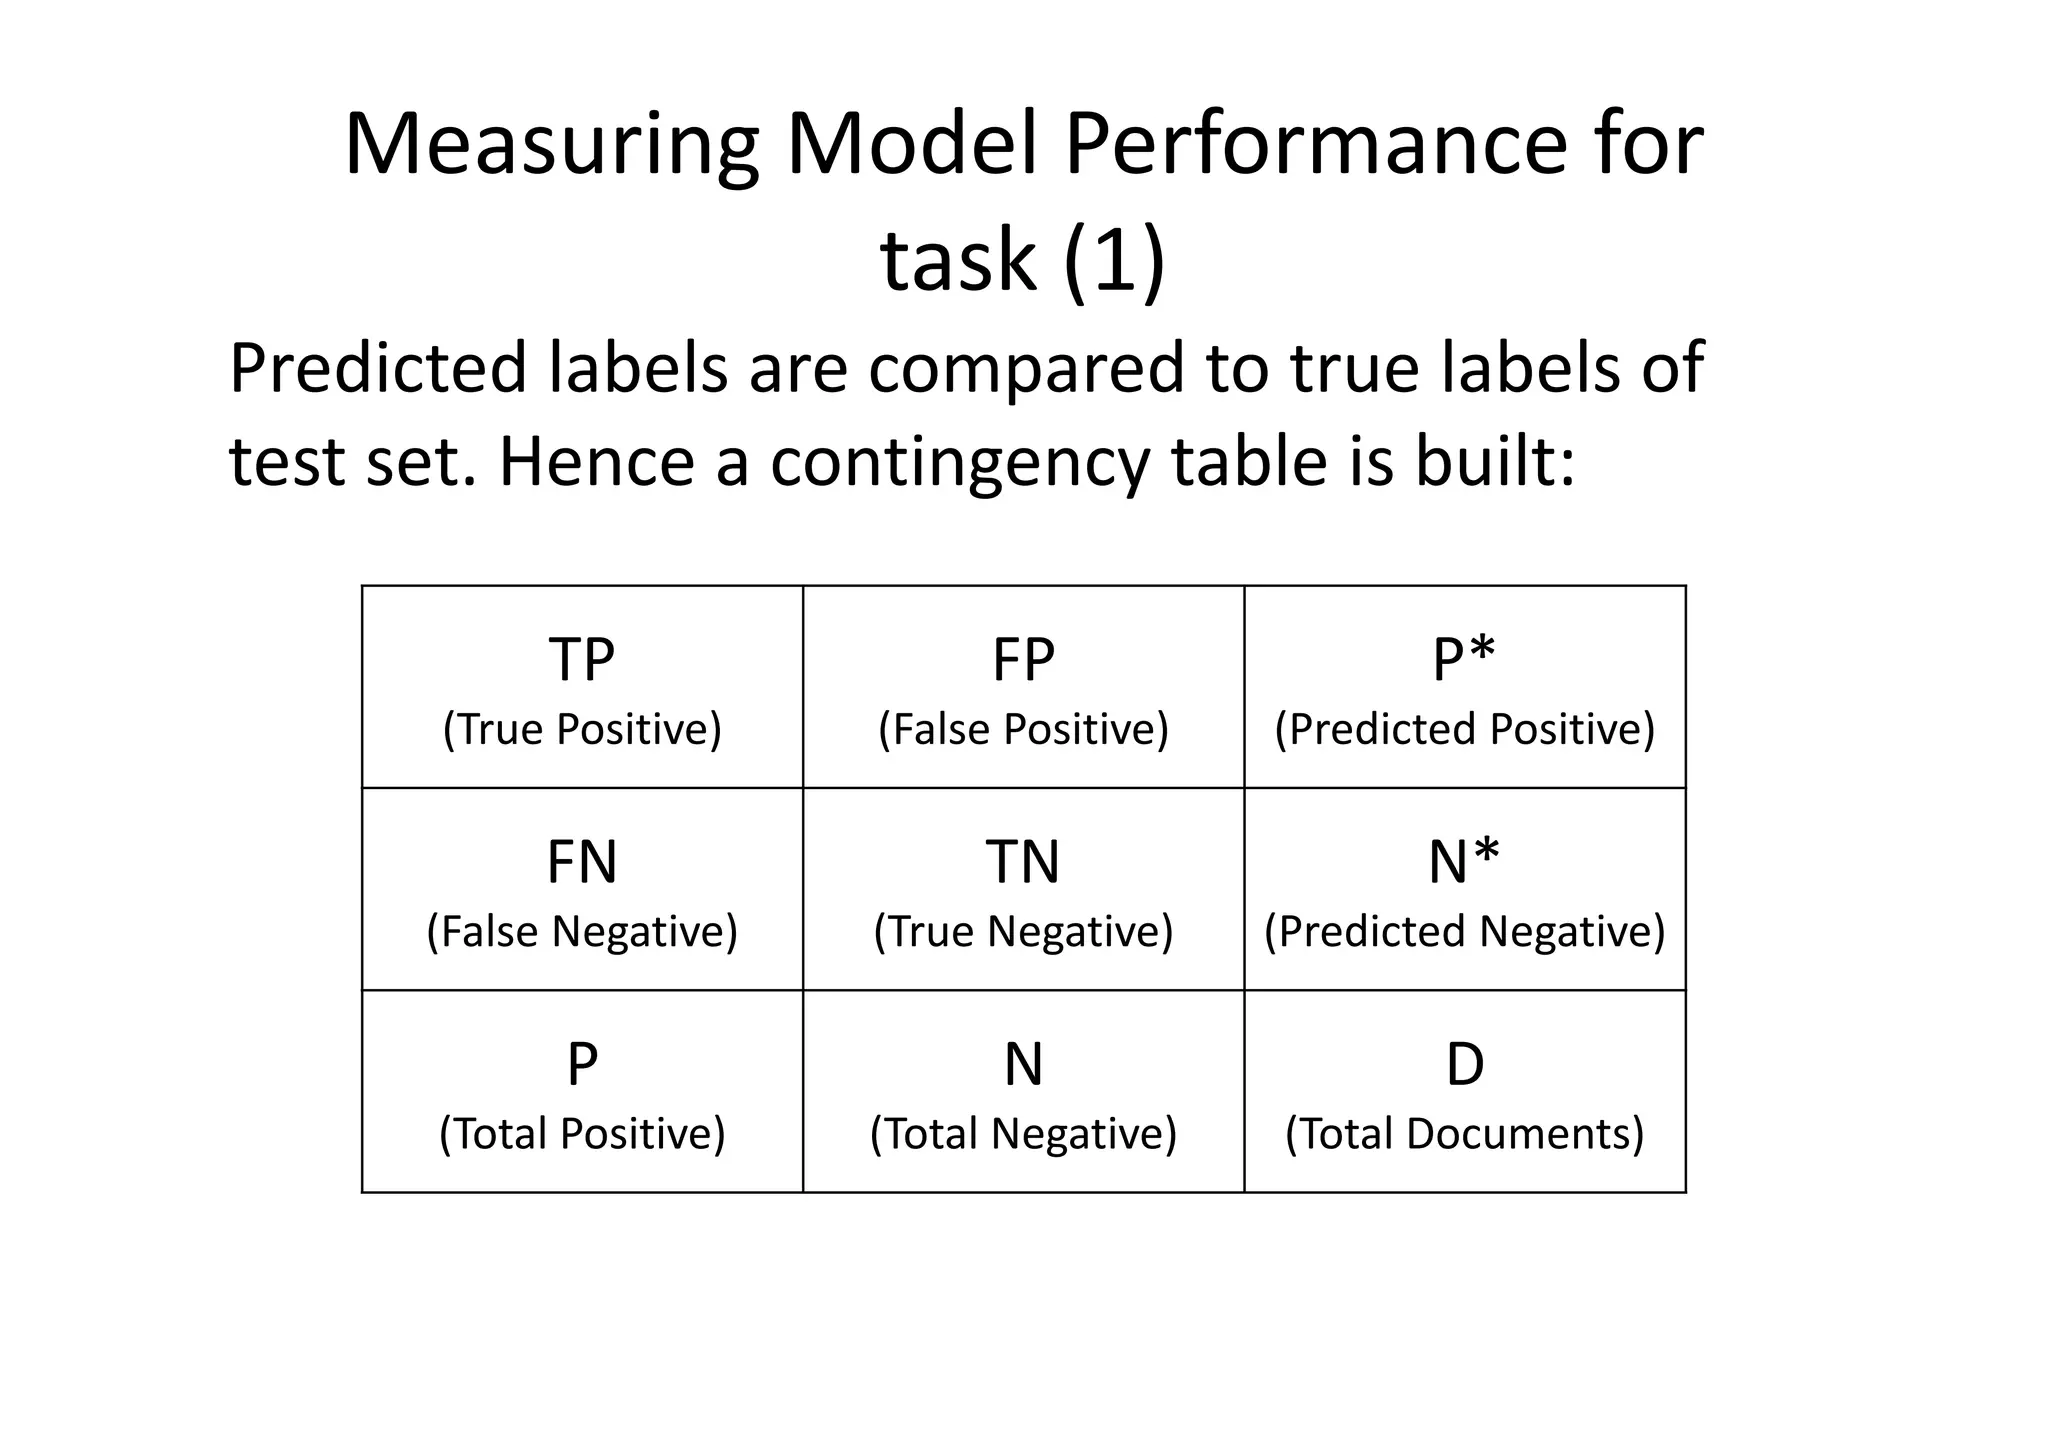
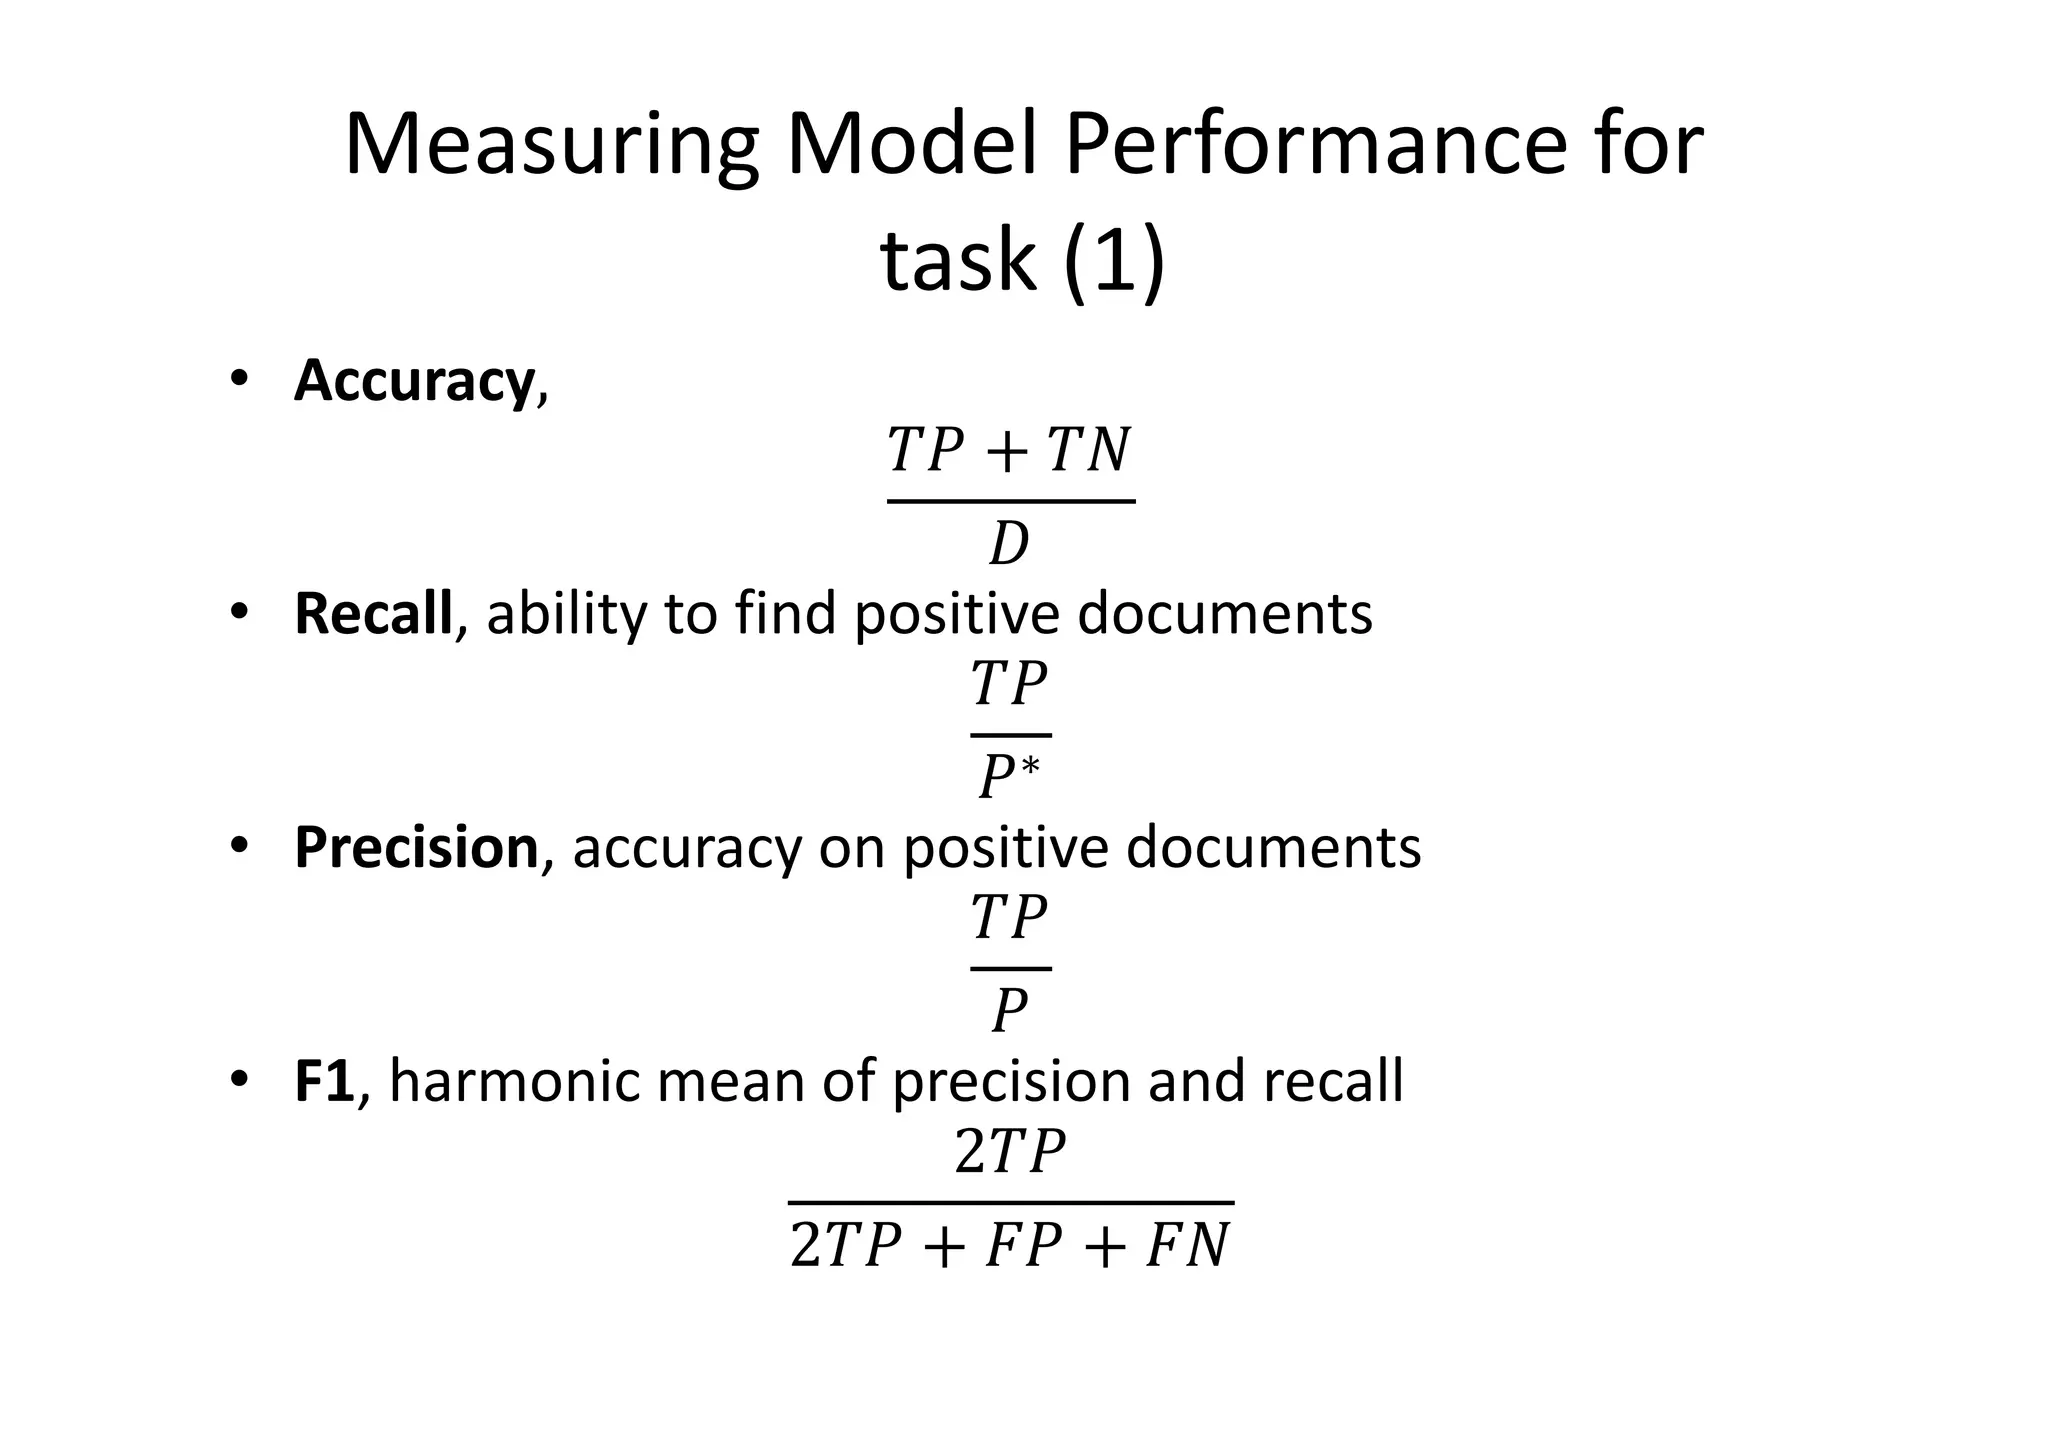
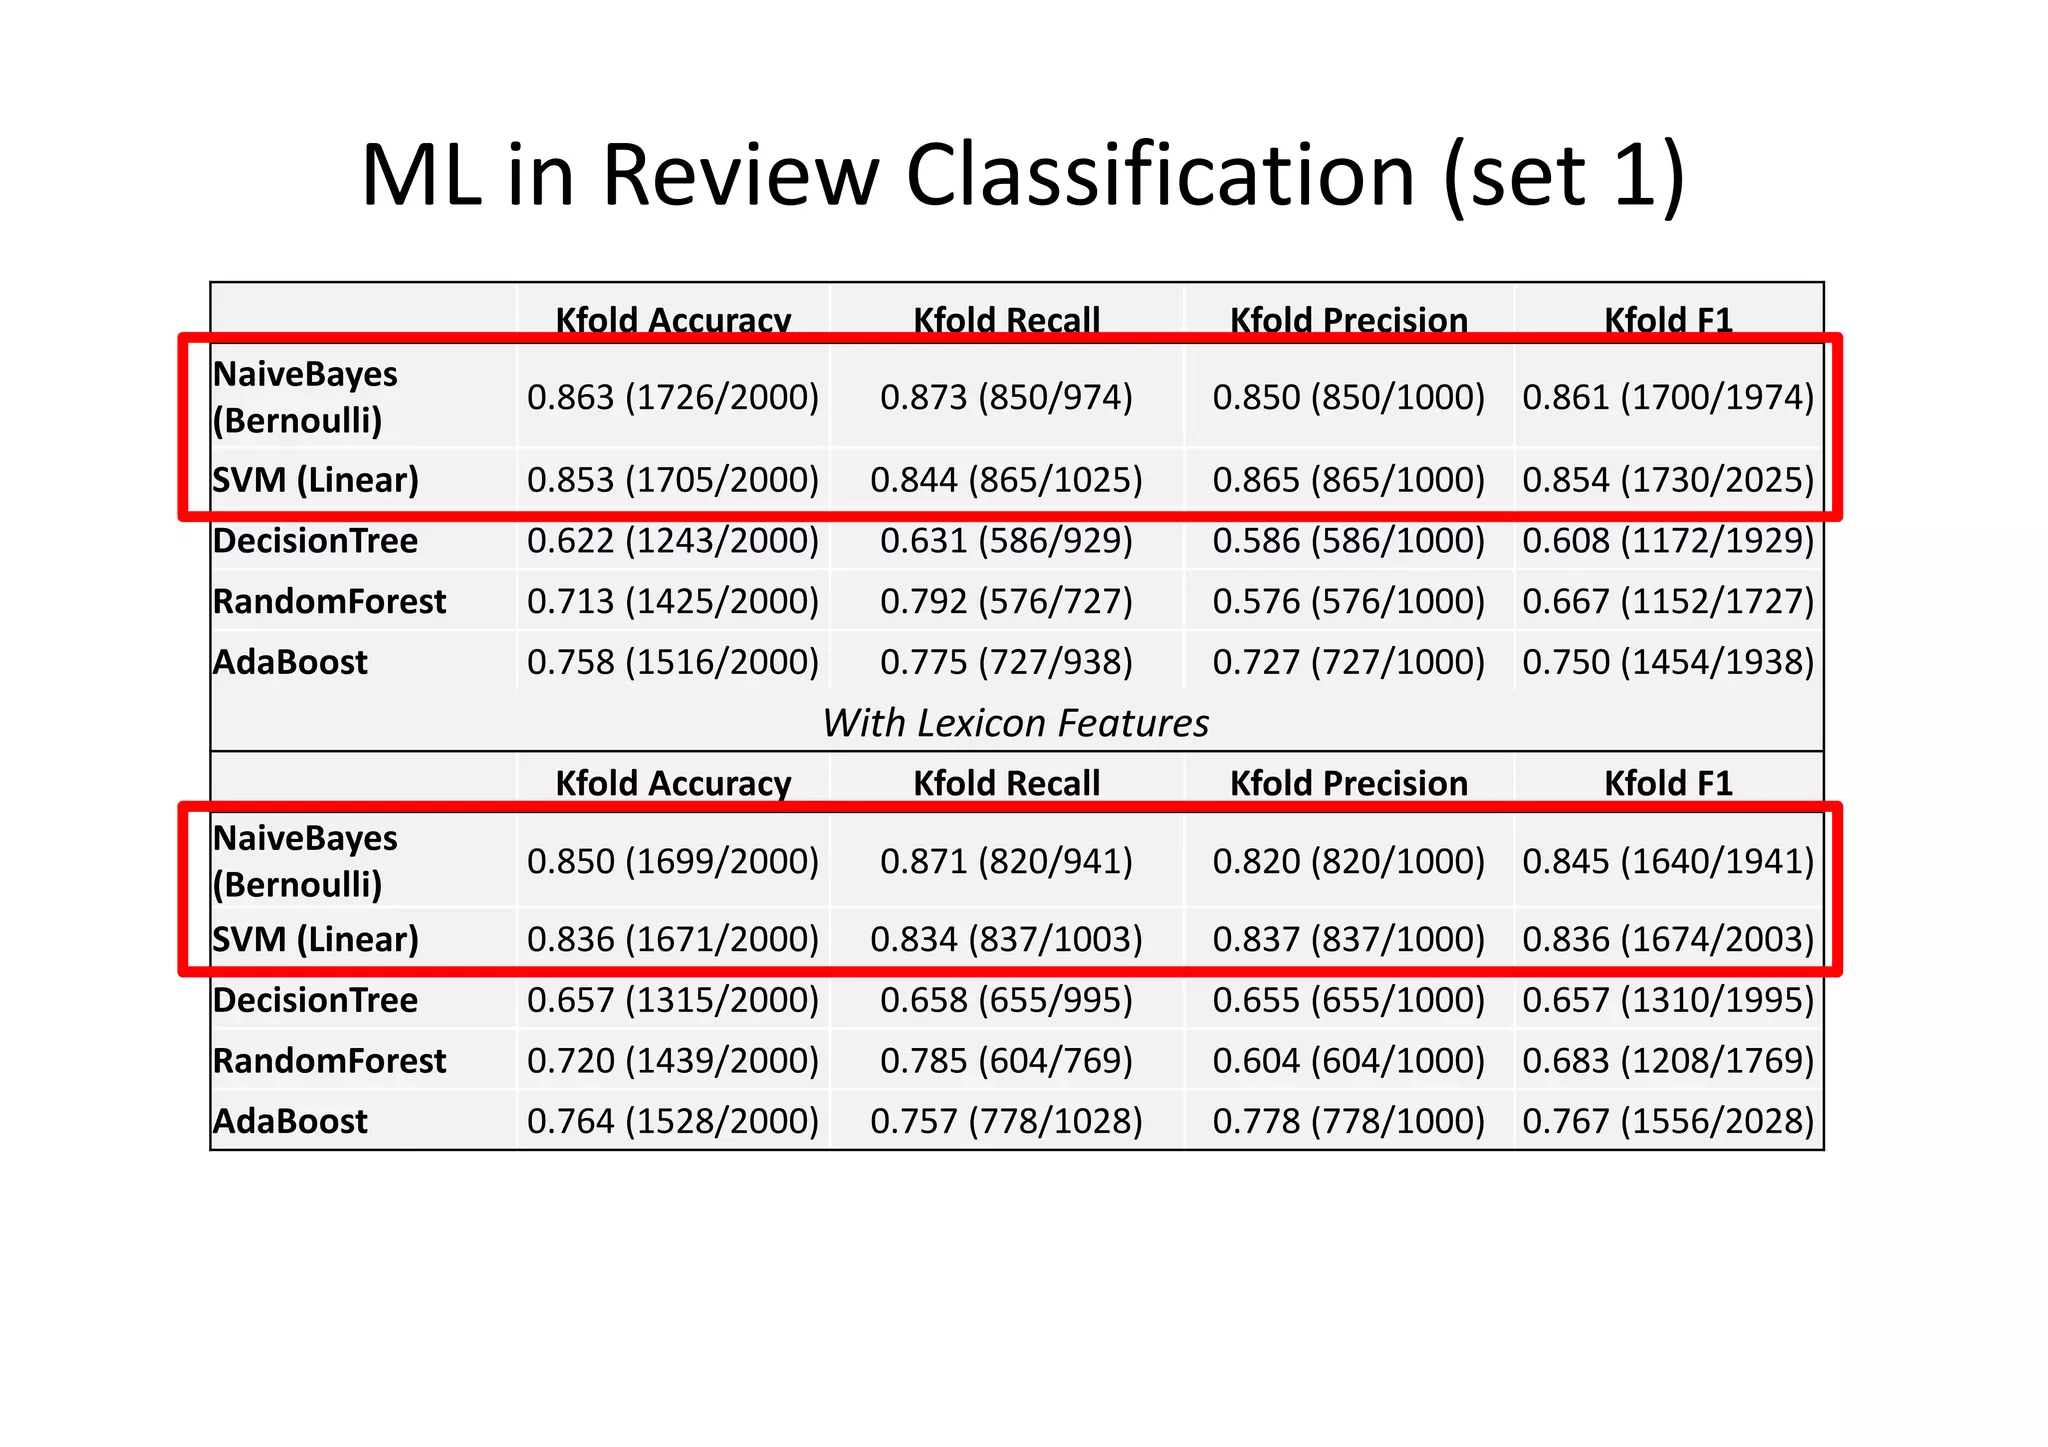
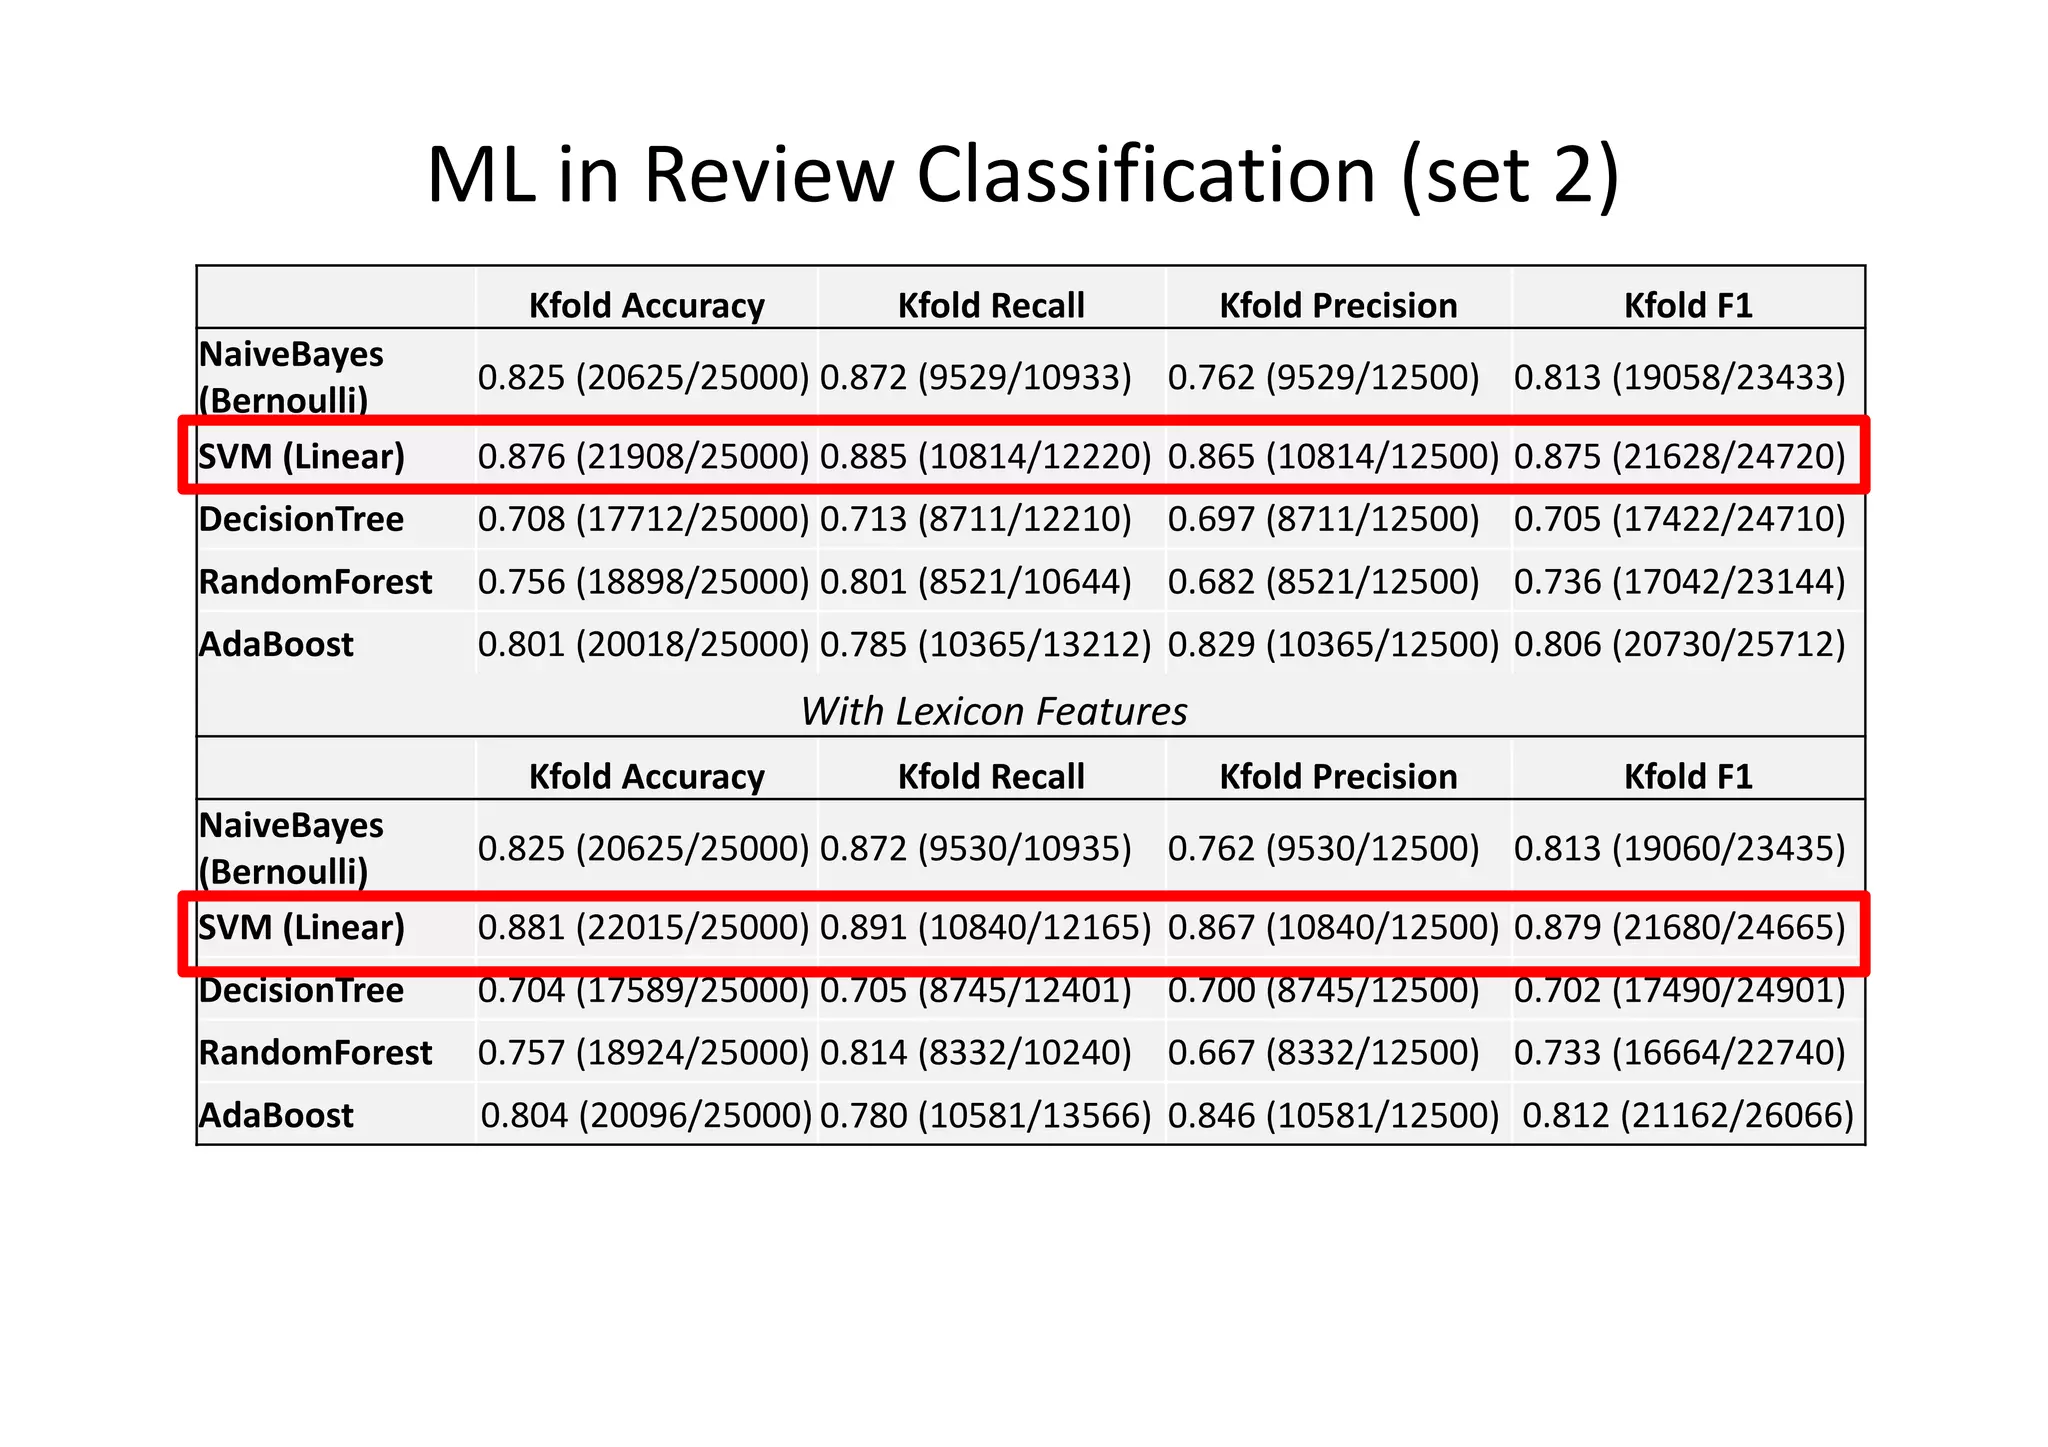
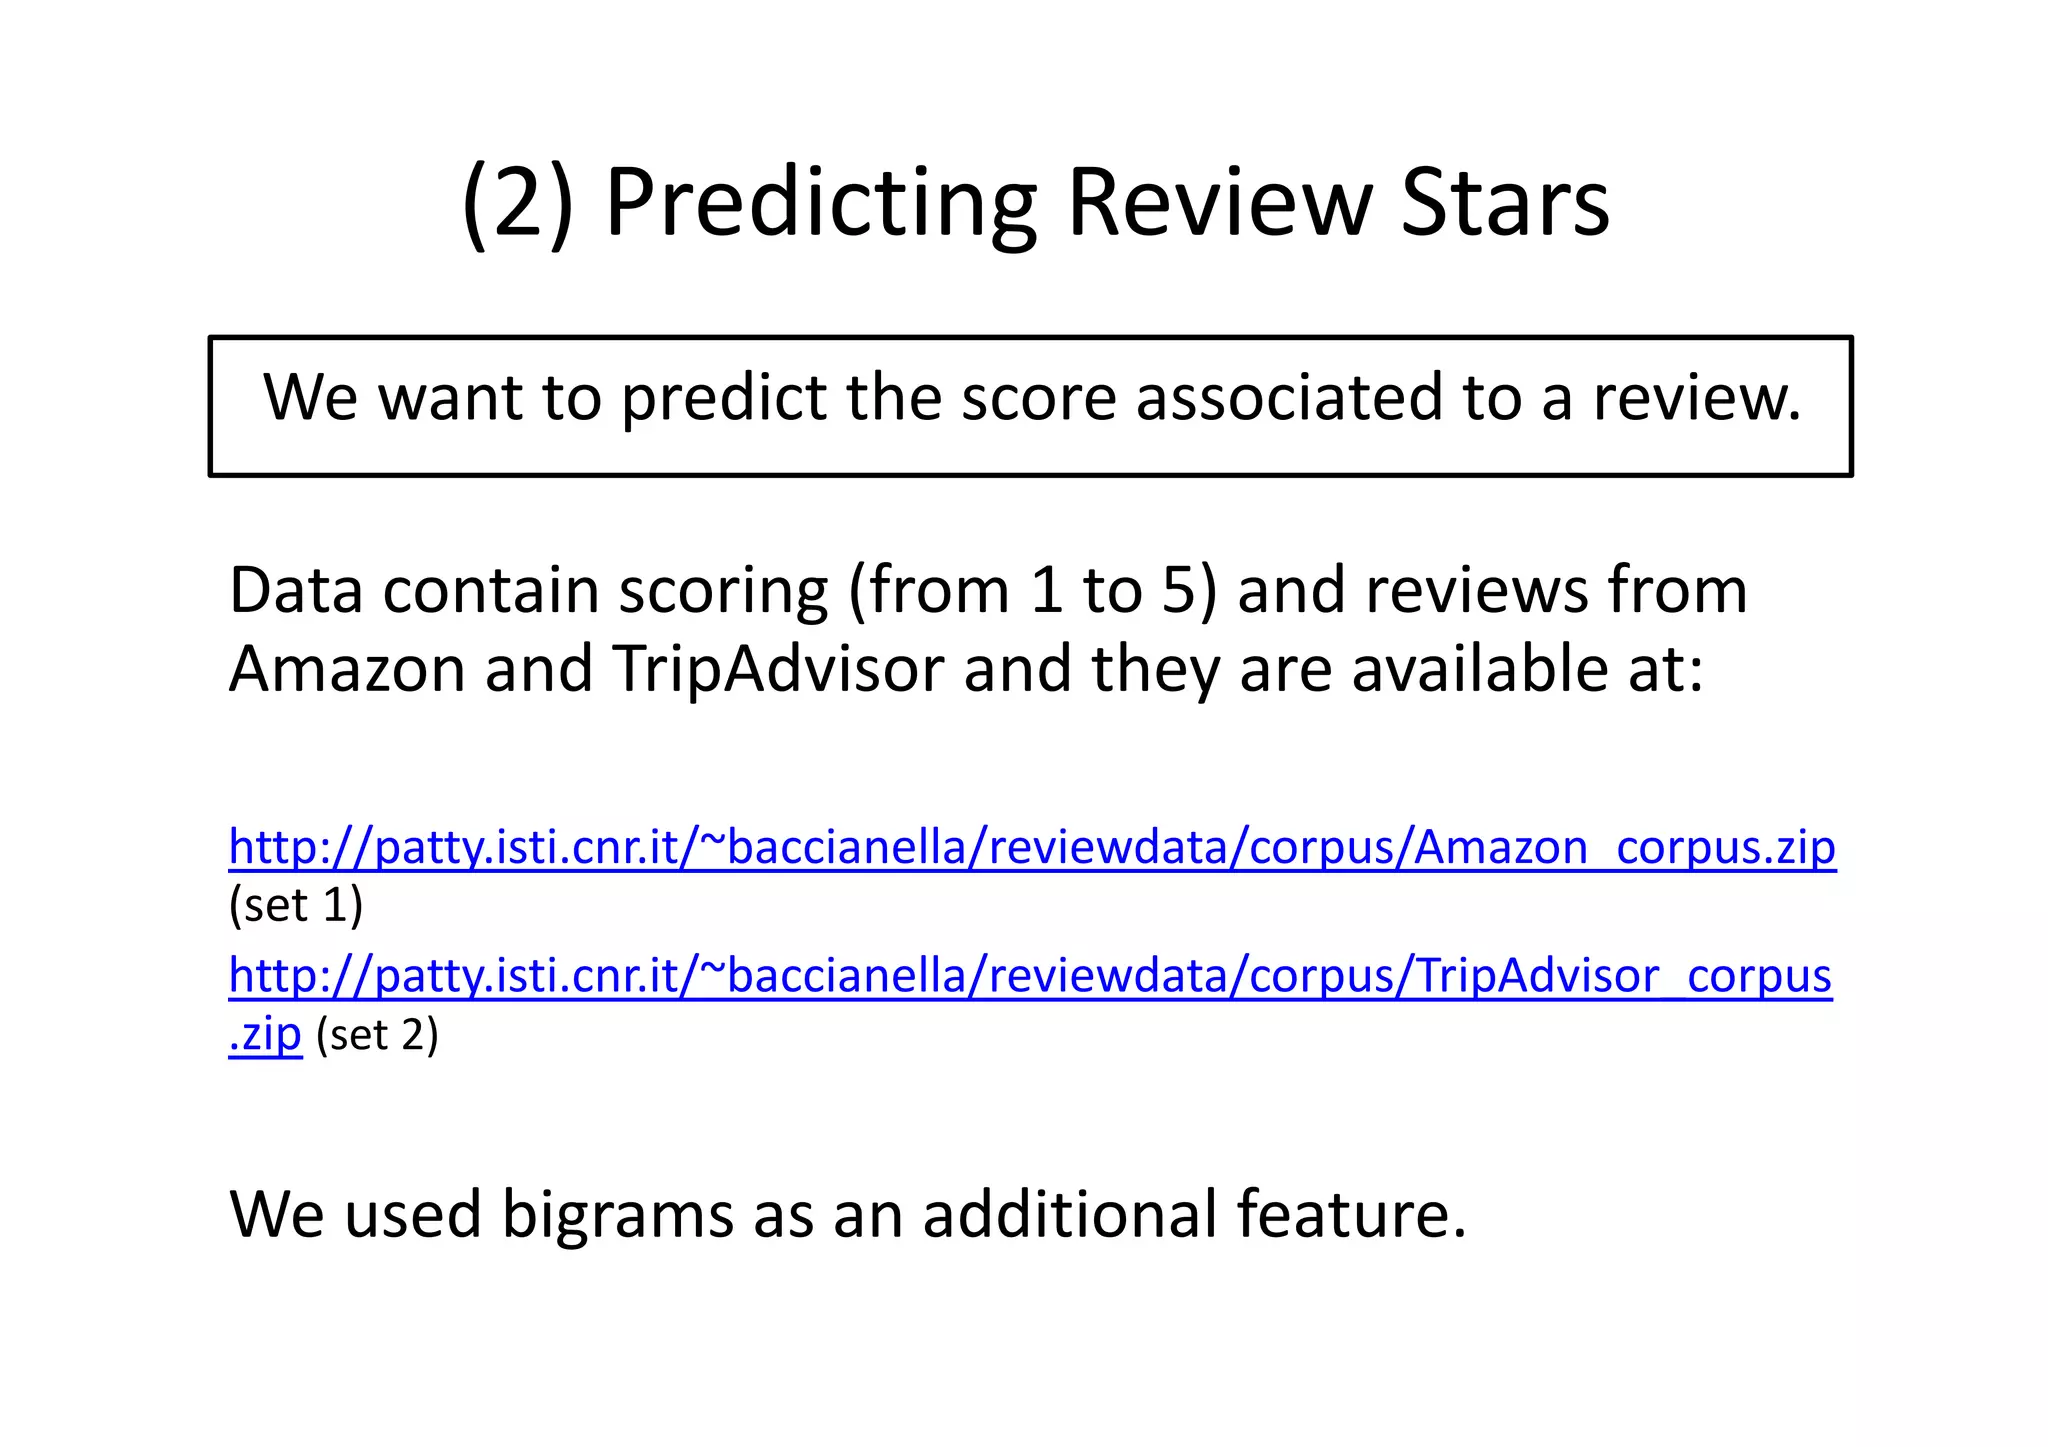
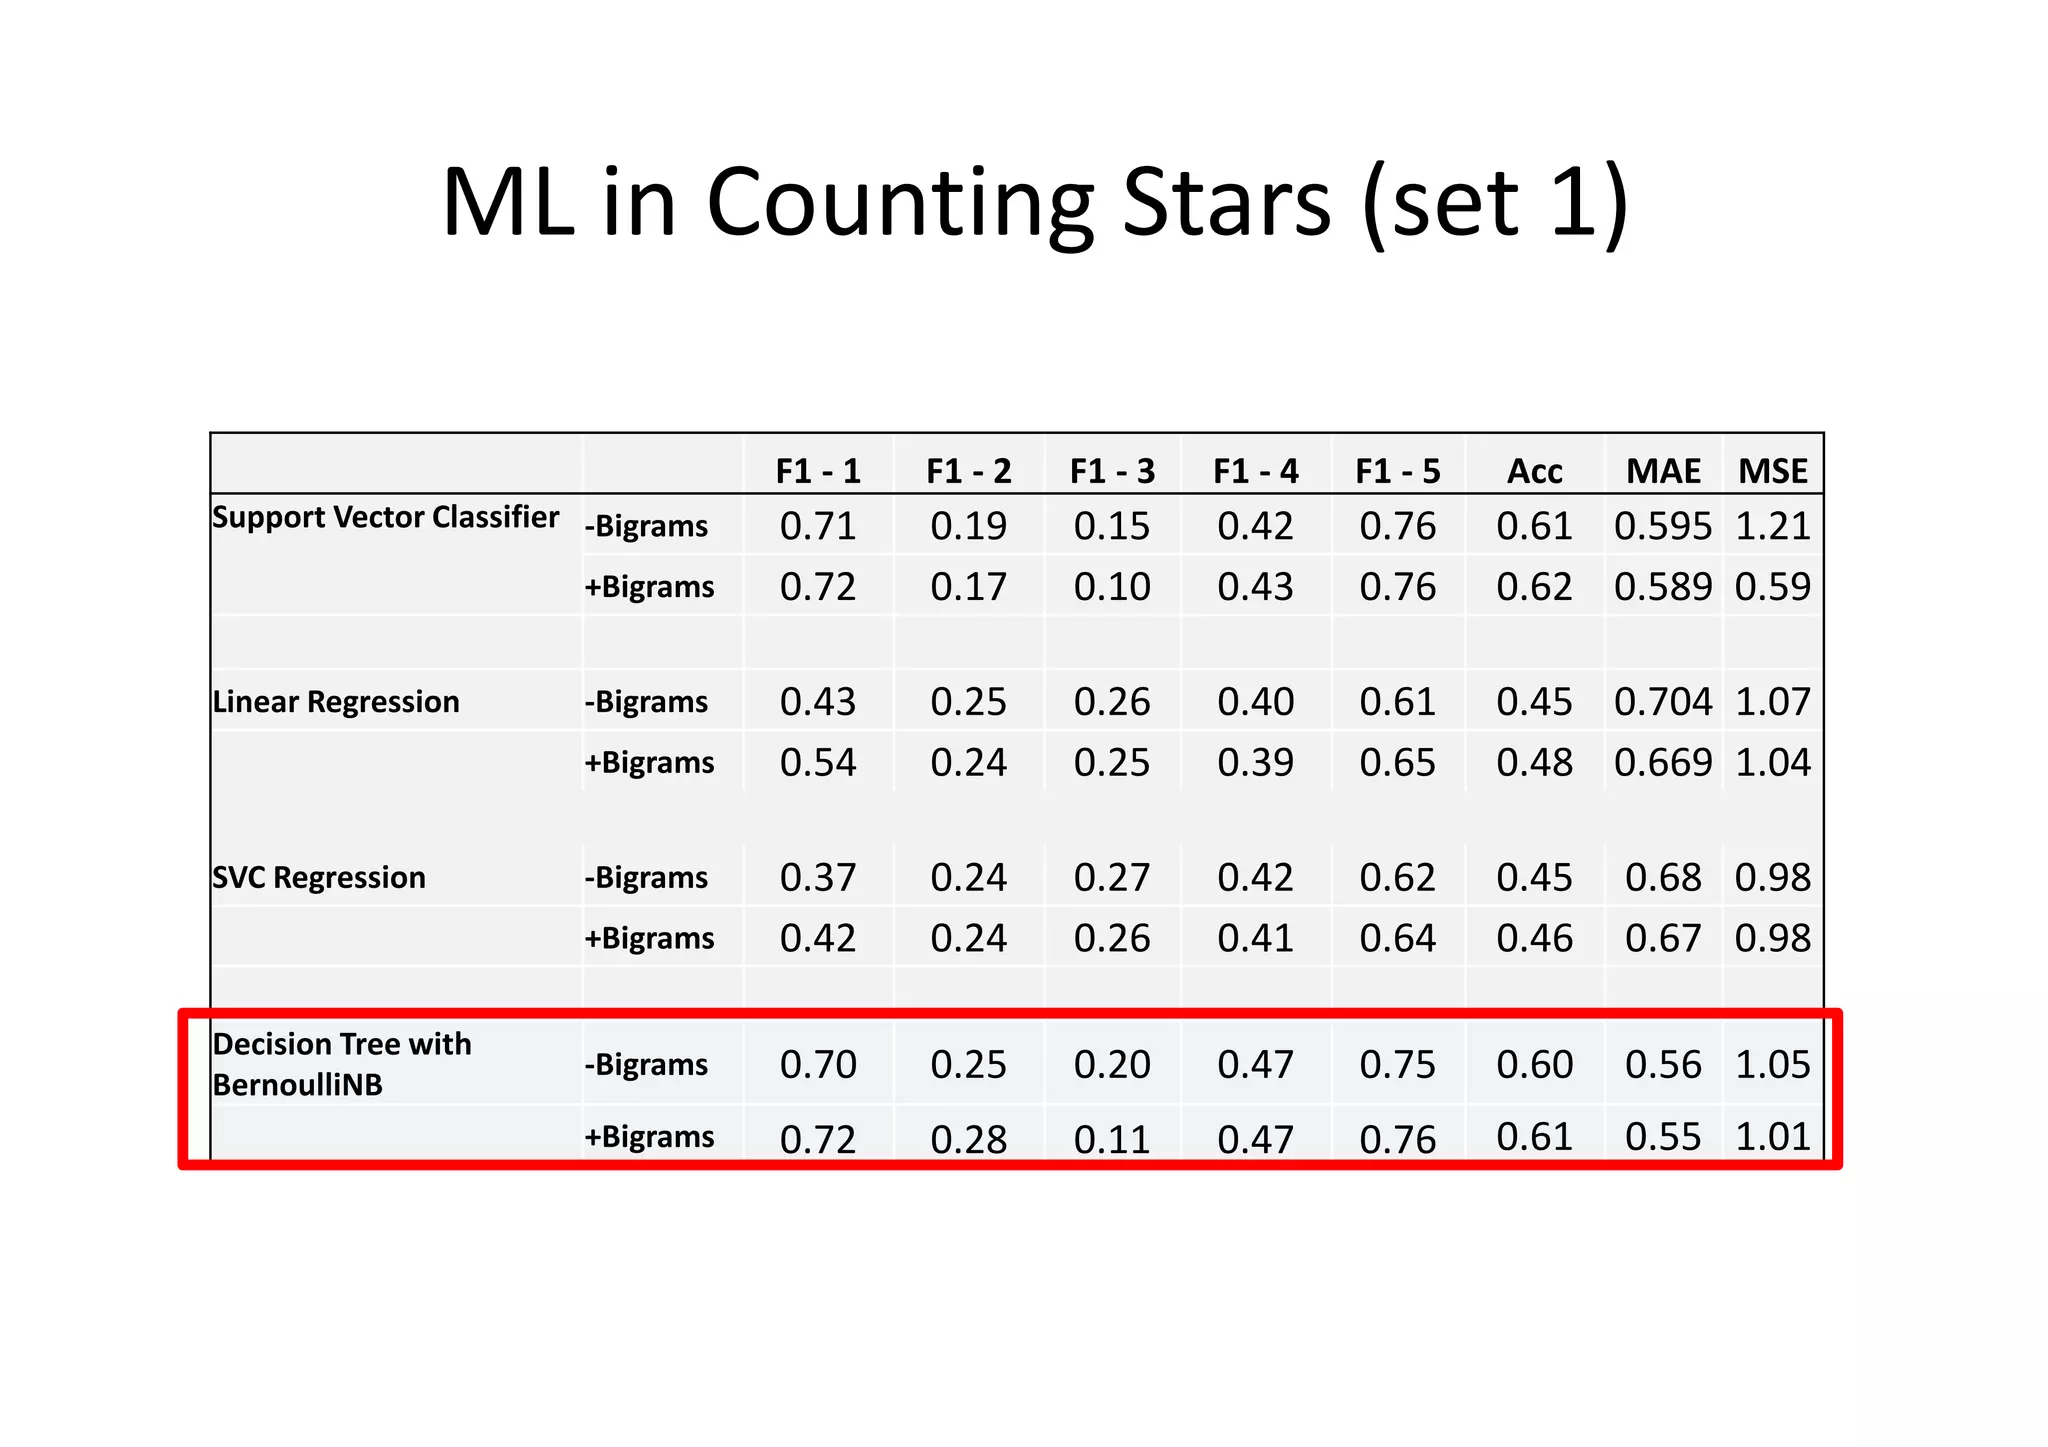
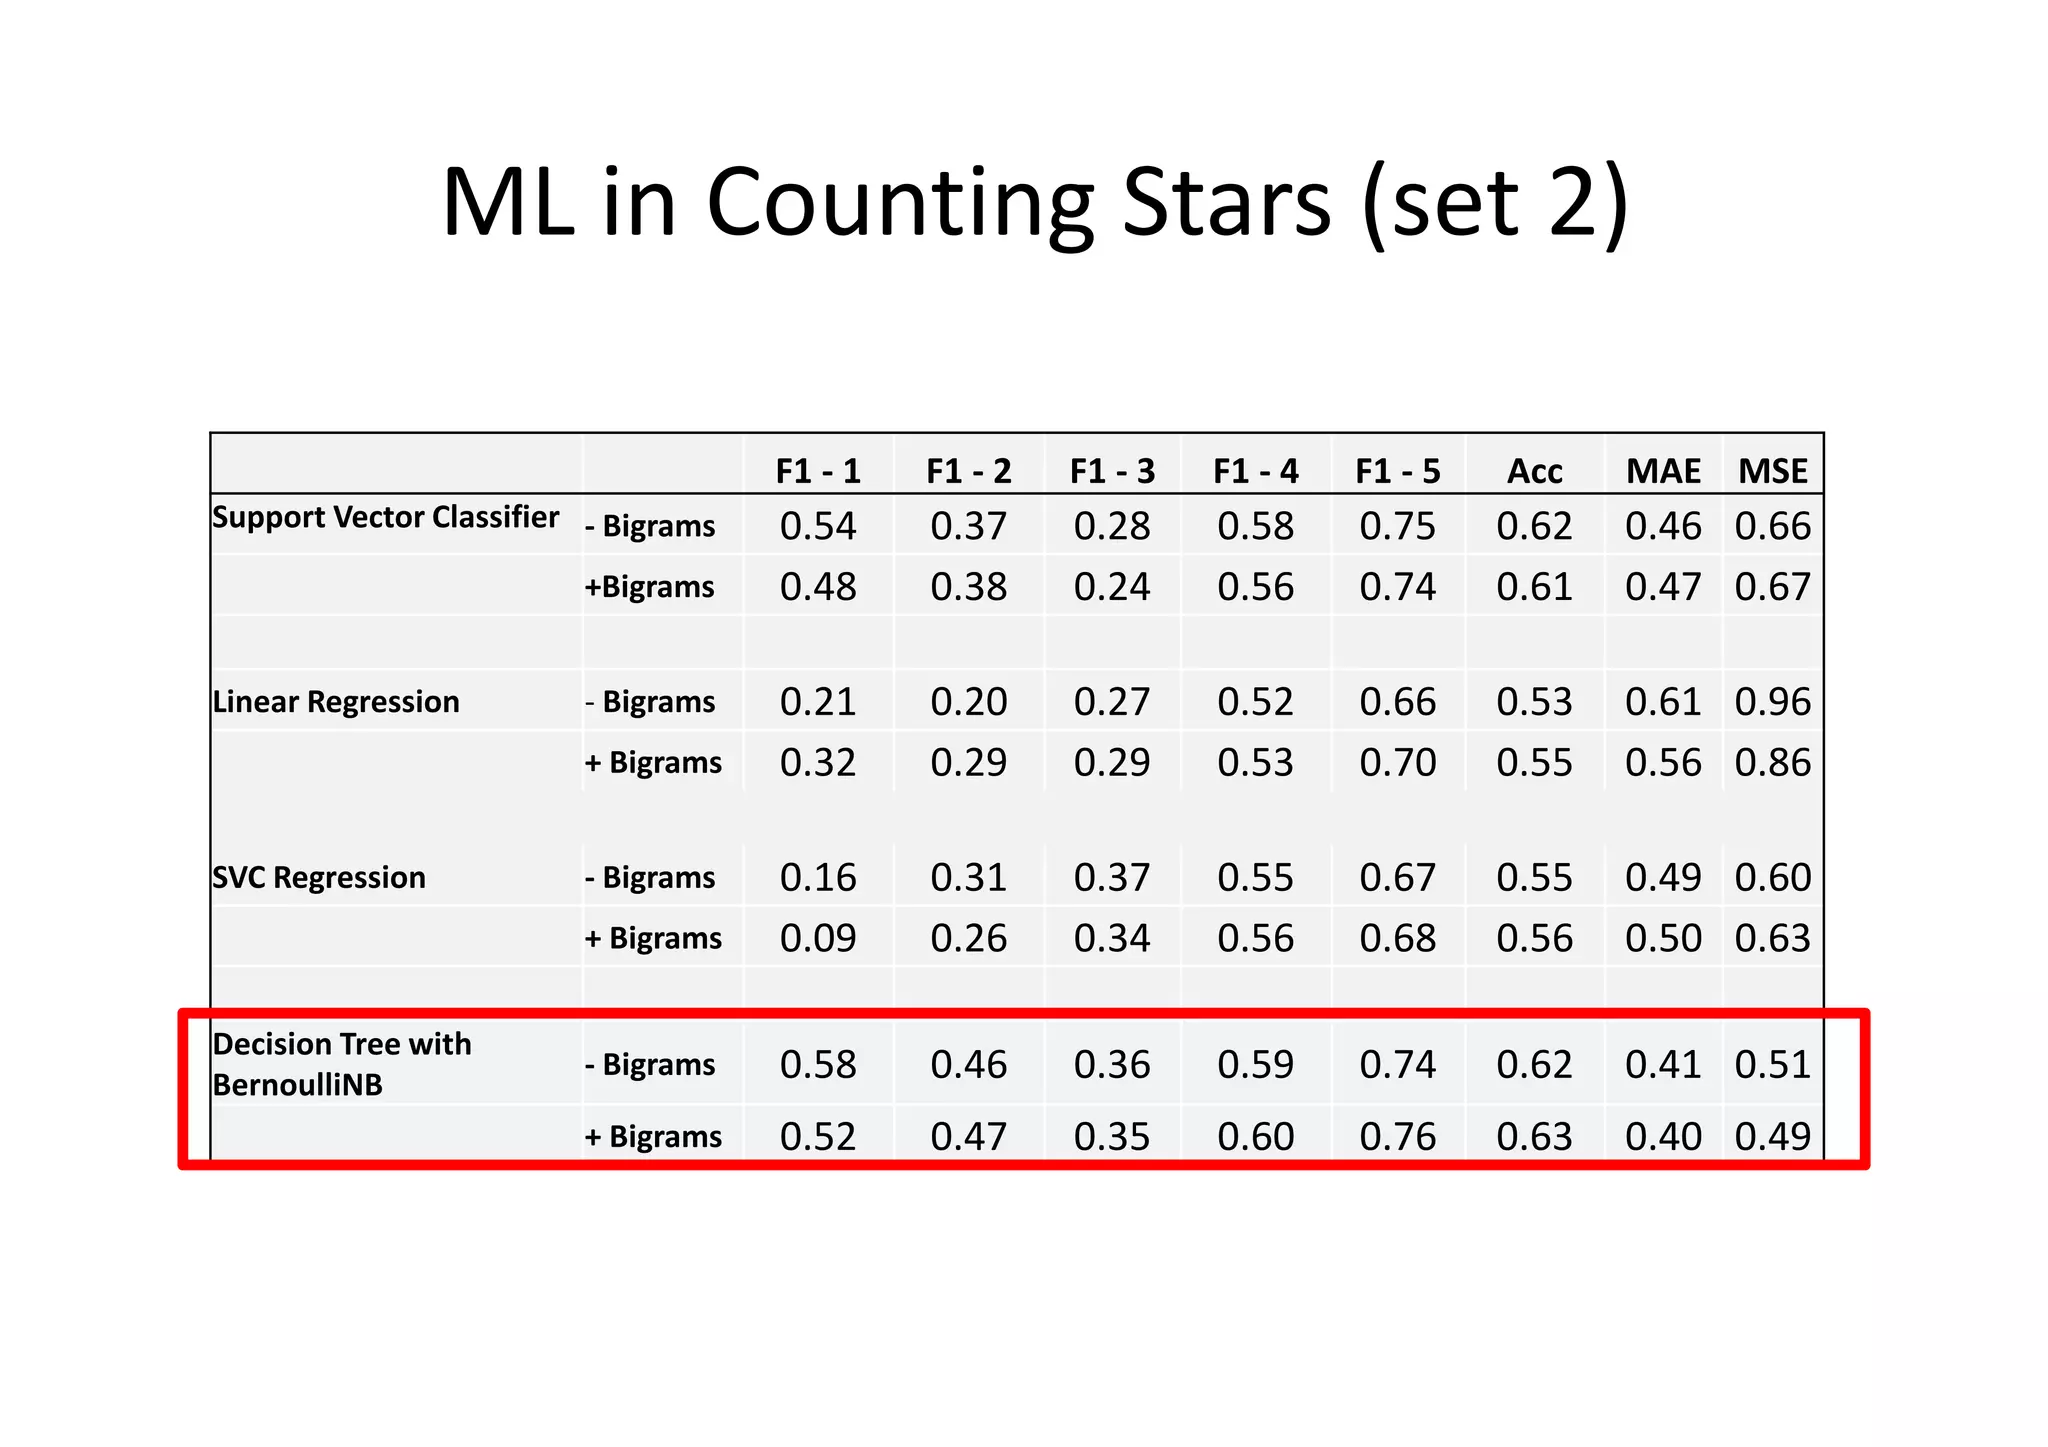
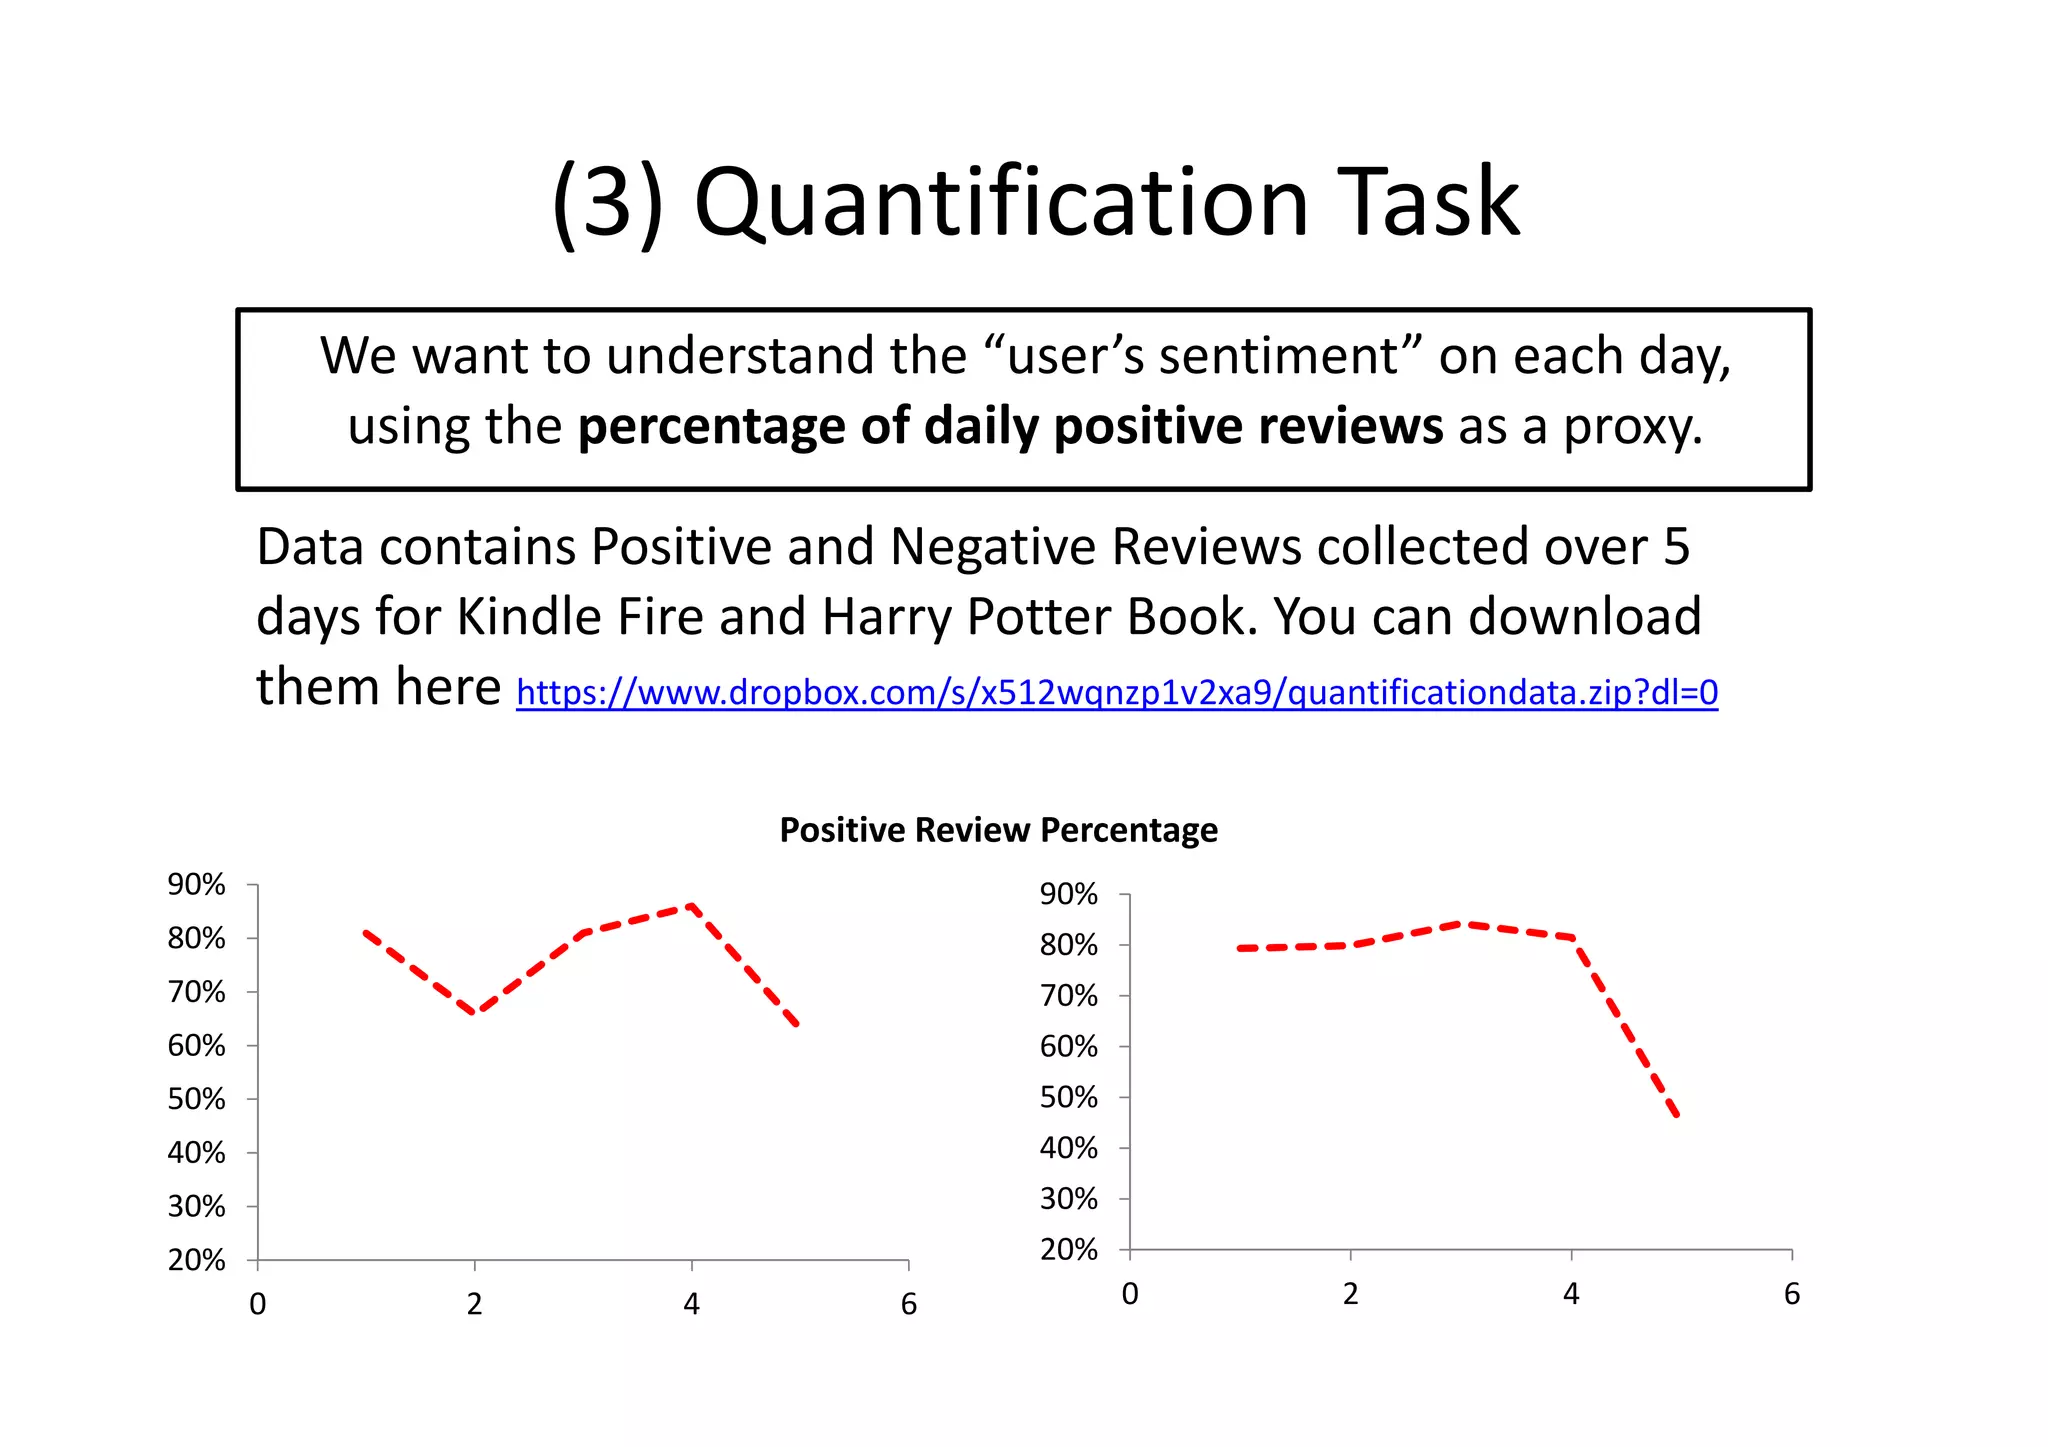
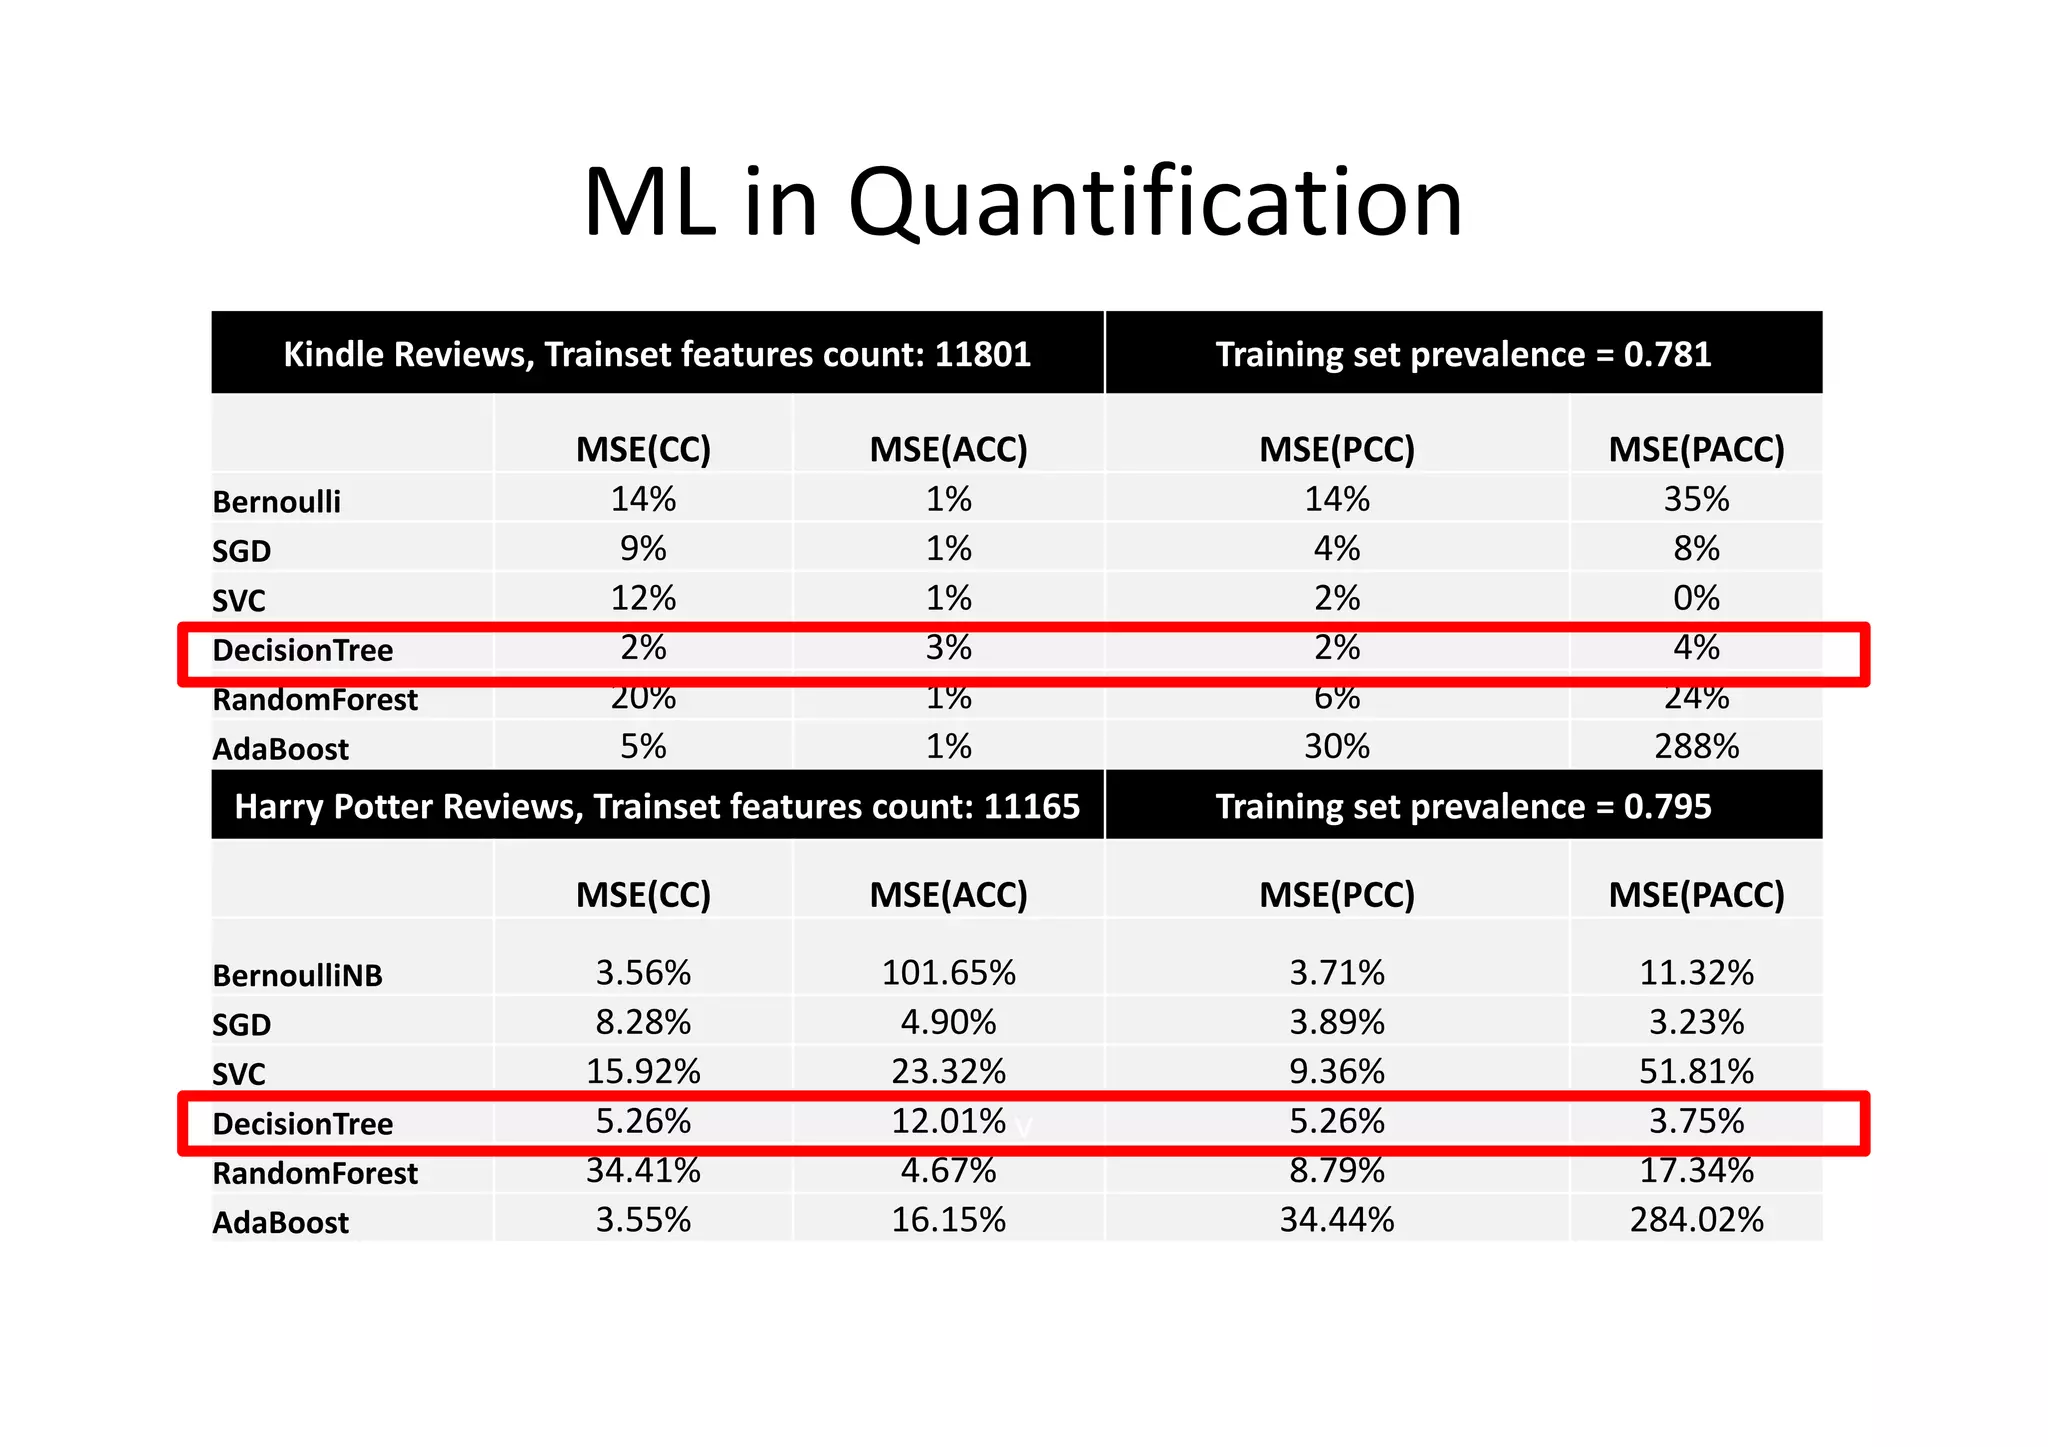
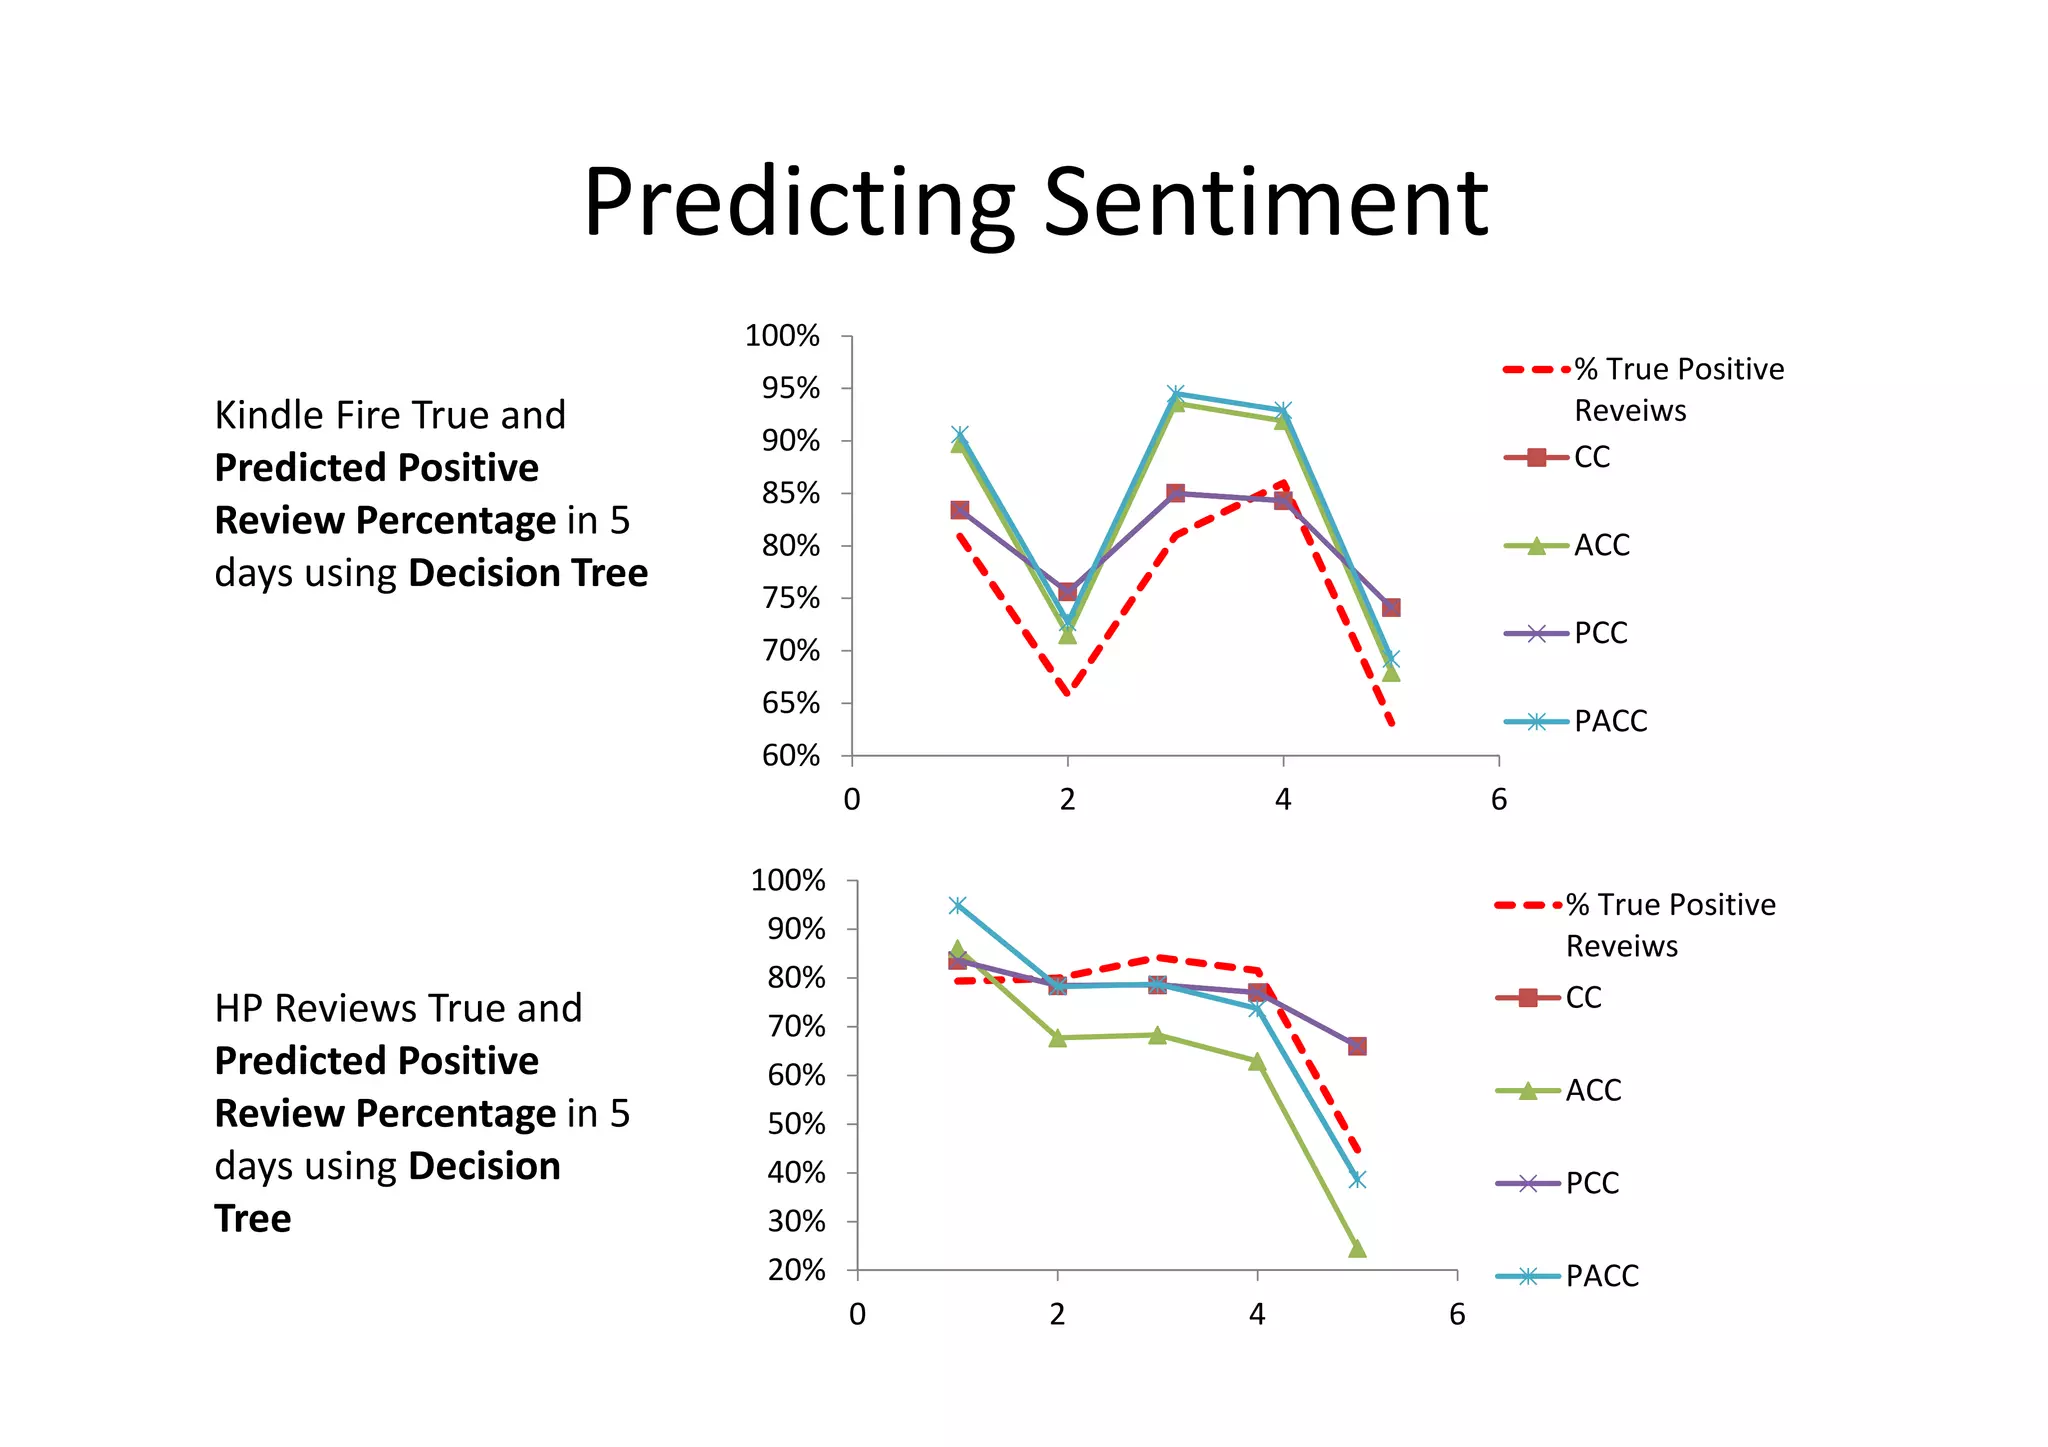
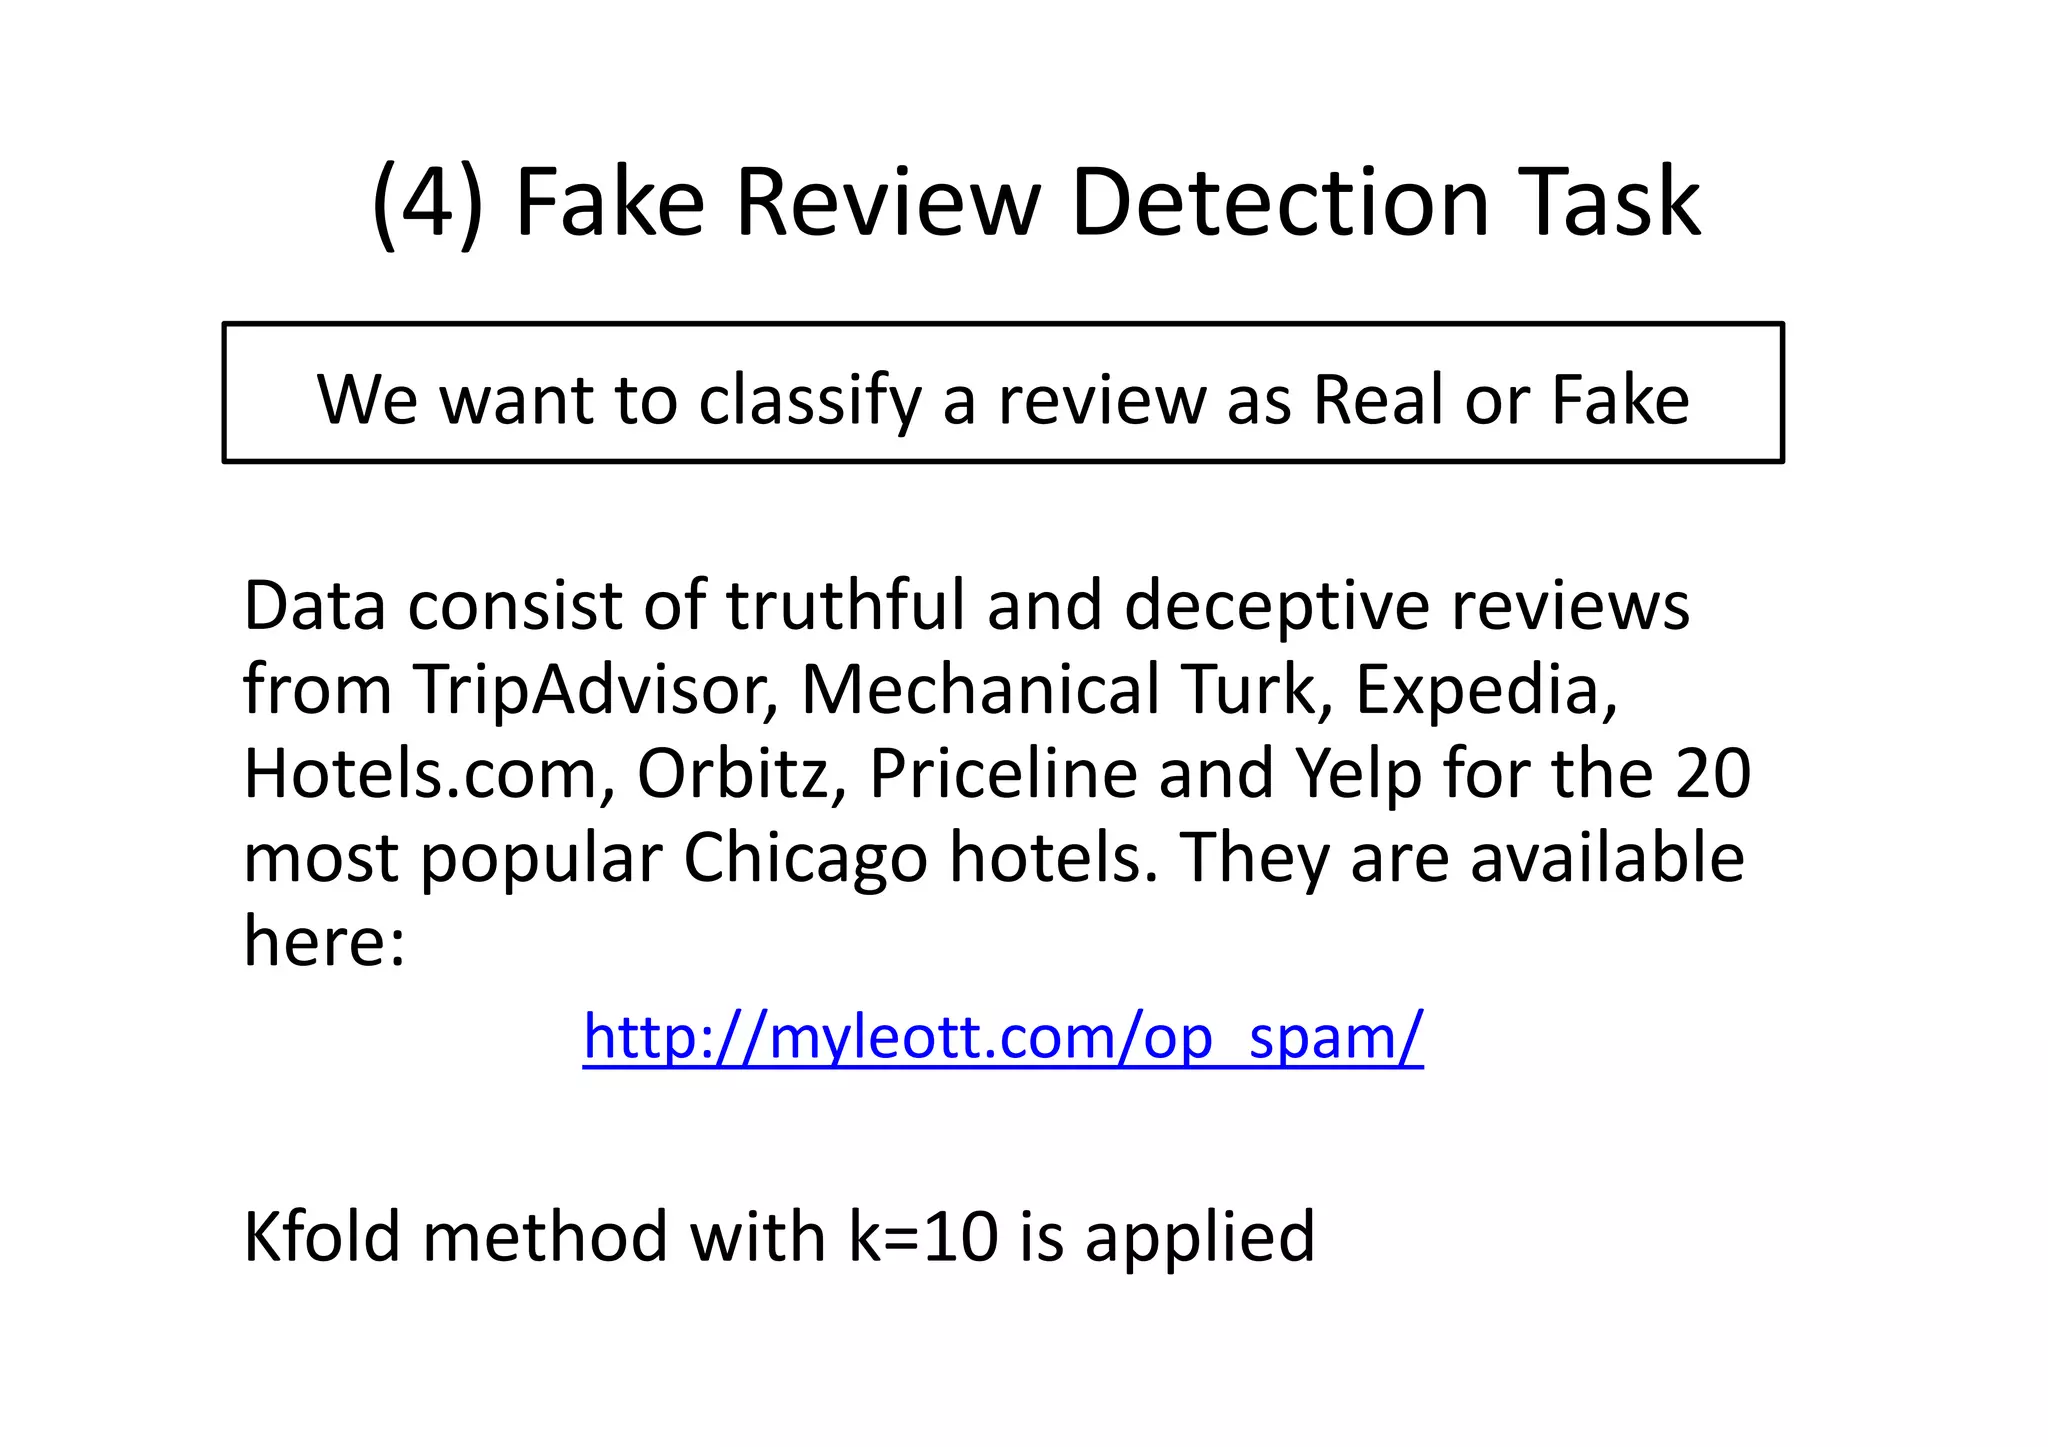
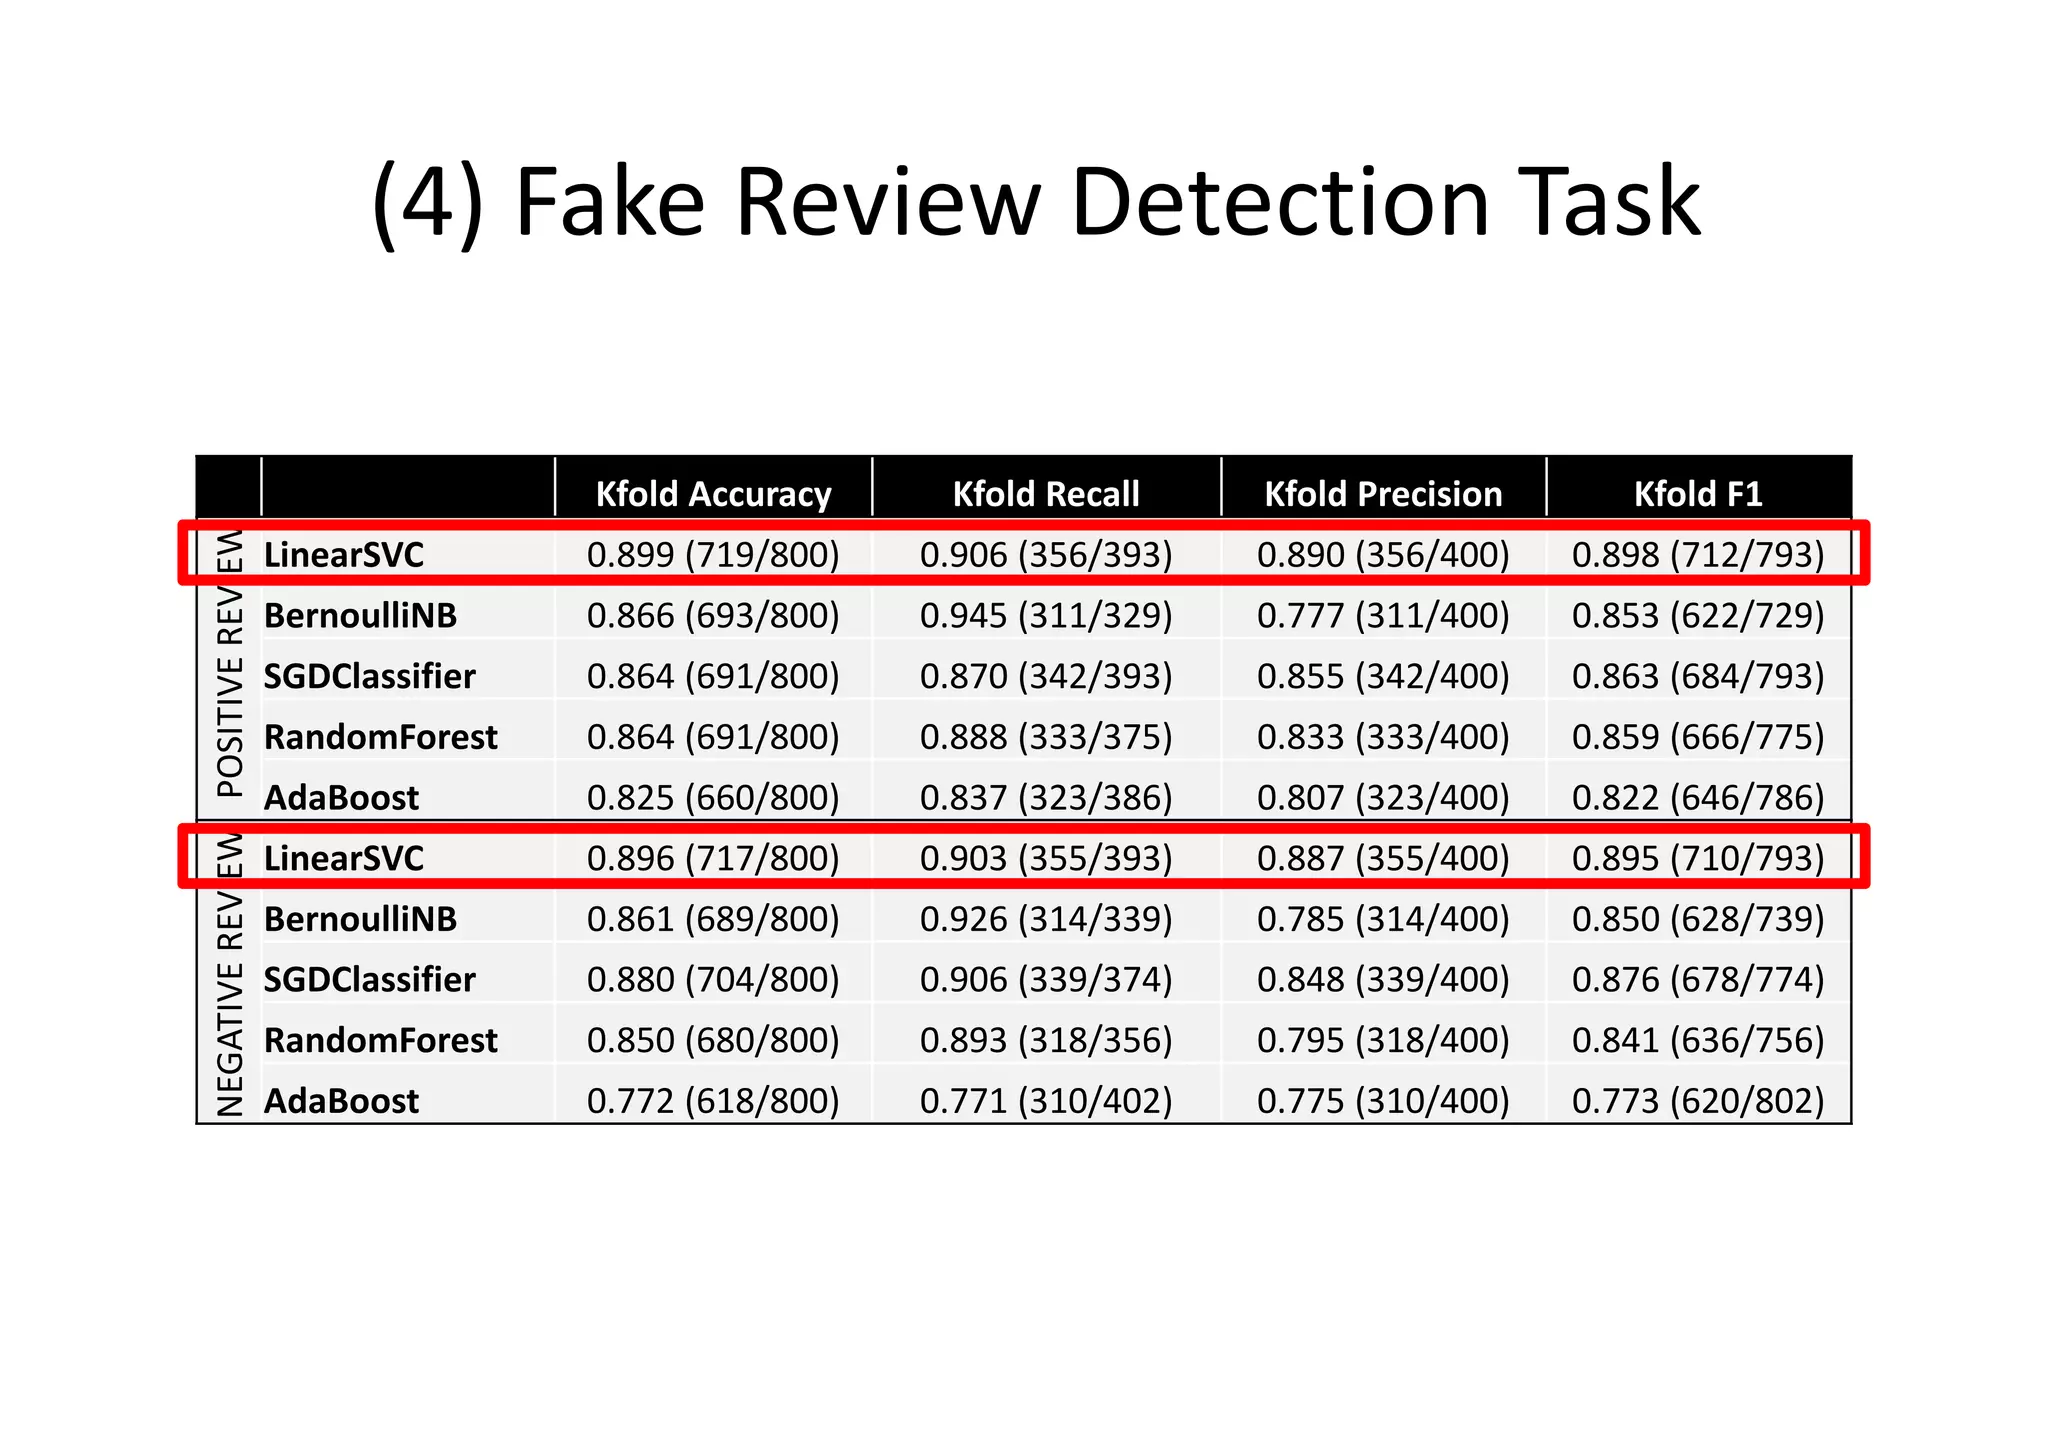
Sentiment Analysis & Opinion
Mining Projectwork
Comparing Models for Review Classification,
Counting Stars, Sentiment Quantification and
Fake Review Detection
Andrea Gigli
https://about.me/andrea.gigli
The goal
Comparing different Machine Learning Algorithm on
different Text Mining Tasks
Tasks considered:
1) Classifying Positive and Negative Reviews
2) Predicting Review Stars
3) Quantifying Sentiment Over Time
4) Detecting Fake Reviews
Tools:
Python + NLTK + Scikit-learn
ML Models: Naïve Bayes
Naïve Bayes is a probabilistic learner that uses the Bayes
Theorem:
=
making a strong independence assumption between the
features.
( | ) ∝ ( ) ( | )
ML Models: SVM
Support Vector Machine (SVM) is a geometric learner that
represent the set of features F in a |F|-dimensional vector
space:
Vectors w are composed of 	′s which indicate the relevance
of feature f in document d
The algorithm compute the hyperplane
∙ − = 0
that better separates the examples.
ML Models: Decision Trees
Decision Tree algorithm generate a
tree of yes/no question on
features.
It performs a feature selection by
maximizing an Information Gain
measure:
= − ( | )
ML Models: Random Forest
Random forests are an ensemble learning method
They operate by constructing a multitude of decision
trees at training time and outputting the class that is
the mode of the class.
ML Models: Adaptive Boosting
Adaptive Boosting is a meta-algorithm which can be used in
conjunction with other types of learning algorithms to improve
their performance.
The output of “weak learners” is combined into a weighted sum
that represents the final output of the boosted classifier.
It is “Adaptive” in the sense that subsequent weak learners are
tweaked in favor of those instances misclassified by previous
classifiers.
(1) Classifying Reviews
We want to classify a Review as Positive or Negative
Data contain movie reviews labeled as Positive or Negative
and you can find them here:
http://www.cs.cornell.edu/people/pabo/movie-review-
data/review_polarity.tar.gz (set1)
http://ai.stanford.edu/~amaas/data/sentiment/aclImdb_v1.tar.gz (set2)
Kfold method with k=10 is applied
A separate comparison has been performed introducing
lexicon features through SensiWordNet
Measuring Model Performance for
task (1)
Predicted labels are compared to true labels of
test set. Hence a contingency table is built:
TP
(True Positive)
FP
(False Positive)
P*
(Predicted Positive)
FN
(False Negative)
TN
(True Negative)
N*
(Predicted Negative)
P
(Total Positive)
N
(Total Negative)
D
(Total Documents)
Measuring Model Performance for
task (1)
• Accuracy,
+
• Recall, ability to find positive documents
∗
• Precision, accuracy on positive documents
• F1, harmonic mean of precision and recall
2
2 + ! + !
ML in Review Classification (set 1)
Kfold Accuracy Kfold Recall Kfold Precision Kfold F1
NaiveBayes
(Bernoulli)
0.863 (1726/2000) 0.873 (850/974) 0.850 (850/1000) 0.861 (1700/1974)
SVM (Linear) 0.853 (1705/2000) 0.844 (865/1025) 0.865 (865/1000) 0.854 (1730/2025)
DecisionTree 0.622 (1243/2000) 0.631 (586/929) 0.586 (586/1000) 0.608 (1172/1929)
RandomForest 0.713 (1425/2000) 0.792 (576/727) 0.576 (576/1000) 0.667 (1152/1727)
AdaBoost 0.758 (1516/2000) 0.775 (727/938) 0.727 (727/1000) 0.750 (1454/1938)
With Lexicon Features
Kfold Accuracy Kfold Recall Kfold Precision Kfold F1
NaiveBayes
(Bernoulli)
0.850 (1699/2000) 0.871 (820/941) 0.820 (820/1000) 0.845 (1640/1941)
SVM (Linear) 0.836 (1671/2000) 0.834 (837/1003) 0.837 (837/1000) 0.836 (1674/2003)
DecisionTree 0.657 (1315/2000) 0.658 (655/995) 0.655 (655/1000) 0.657 (1310/1995)
RandomForest 0.720 (1439/2000) 0.785 (604/769) 0.604 (604/1000) 0.683 (1208/1769)
AdaBoost 0.764 (1528/2000) 0.757 (778/1028) 0.778 (778/1000) 0.767 (1556/2028)
ML in Review Classification (set 2)
Kfold Accuracy Kfold Recall Kfold Precision Kfold F1
NaiveBayes
(Bernoulli)
0.825 (20625/25000) 0.872 (9529/10933) 0.762 (9529/12500) 0.813 (19058/23433)
SVM (Linear) 0.876 (21908/25000) 0.885 (10814/12220) 0.865 (10814/12500) 0.875 (21628/24720)
DecisionTree 0.708 (17712/25000) 0.713 (8711/12210) 0.697 (8711/12500) 0.705 (17422/24710)
RandomForest 0.756 (18898/25000) 0.801 (8521/10644) 0.682 (8521/12500) 0.736 (17042/23144)
AdaBoost 0.801 (20018/25000) 0.785 (10365/13212) 0.829 (10365/12500) 0.806 (20730/25712)
With Lexicon Features
Kfold Accuracy Kfold Recall Kfold Precision Kfold F1
NaiveBayes
(Bernoulli)
0.825 (20625/25000) 0.872 (9530/10935) 0.762 (9530/12500) 0.813 (19060/23435)
SVM (Linear) 0.881 (22015/25000) 0.891 (10840/12165) 0.867 (10840/12500) 0.879 (21680/24665)
DecisionTree 0.704 (17589/25000) 0.705 (8745/12401) 0.700 (8745/12500) 0.702 (17490/24901)
RandomForest 0.757 (18924/25000) 0.814 (8332/10240) 0.667 (8332/12500) 0.733 (16664/22740)
AdaBoost 0.804 (20096/25000) 0.780 (10581/13566) 0.846 (10581/12500) 0.812 (21162/26066)
(2) Predicting Review Stars
We want to predict the score associated to a review.
Data contain scoring (from 1 to 5) and reviews from
Amazon and TripAdvisor and they are available at:
http://patty.isti.cnr.it/~baccianella/reviewdata/corpus/Amazon_corpus.zip
(set 1)
http://patty.isti.cnr.it/~baccianella/reviewdata/corpus/TripAdvisor_corpus
.zip (set 2)
We used bigrams as an additional feature.
Measuring Model Performance for
task (2)
Let Φ be the true classification function and Φ# the
learning algorithm
$%& Φ#, '()*') =
1
| '()*')|
, |Φ# - − Φ - |
./0123413
$*& Φ#, '()*') =
1
| '()*')|
, Φ# - − Φ -
5
./0123413
ML in Counting Stars (set 1)
F1 - 1 F1 - 2 F1 - 3 F1 - 4 F1 - 5 Acc MAE MSE
Support Vector Classifier -Bigrams 0.71 0.19 0.15 0.42 0.76 0.61 0.595 1.21
+Bigrams 0.72 0.17 0.10 0.43 0.76 0.62 0.589 0.59
Linear Regression -Bigrams 0.43 0.25 0.26 0.40 0.61 0.45 0.704 1.07
+Bigrams 0.54 0.24 0.25 0.39 0.65 0.48 0.669 1.04
SVC Regression -Bigrams 0.37 0.24 0.27 0.42 0.62 0.45 0.68 0.98
+Bigrams 0.42 0.24 0.26 0.41 0.64 0.46 0.67 0.98
Decision Tree with
BernoulliNB
-Bigrams 0.70 0.25 0.20 0.47 0.75 0.60 0.56 1.05
+Bigrams 0.72 0.28 0.11 0.47 0.76 0.61 0.55 1.01
ML in Counting Stars (set 2)
F1 - 1 F1 - 2 F1 - 3 F1 - 4 F1 - 5 Acc MAE MSE
Support Vector Classifier - Bigrams 0.54 0.37 0.28 0.58 0.75 0.62 0.46 0.66
+Bigrams 0.48 0.38 0.24 0.56 0.74 0.61 0.47 0.67
Linear Regression - Bigrams 0.21 0.20 0.27 0.52 0.66 0.53 0.61 0.96
+ Bigrams 0.32 0.29 0.29 0.53 0.70 0.55 0.56 0.86
SVC Regression - Bigrams 0.16 0.31 0.37 0.55 0.67 0.55 0.49 0.60
+ Bigrams 0.09 0.26 0.34 0.56 0.68 0.56 0.50 0.63
Decision Tree with
BernoulliNB
- Bigrams 0.58 0.46 0.36 0.59 0.74 0.62 0.41 0.51
+ Bigrams 0.52 0.47 0.35 0.60 0.76 0.63 0.40 0.49
(3) Quantification Task
We want to understand the “user’s sentiment” on each day,
using the percentage of daily positive reviews as a proxy.
Data contains Positive and Negative Reviews collected over 5
days for Kindle Fire and Harry Potter Book. You can download
them here https://www.dropbox.com/s/x512wqnzp1v2xa9/quantificationdata.zip?dl=0
20%
30%
40%
50%
60%
70%
80%
90%
0 2 4 6
20%
30%
40%
50%
60%
70%
80%
90%
0 2 4 6
Positive Review Percentage
Measuring Model Performance for
task (3)
• Classify and Count (CC)
6' 7 )' 	 8(7)79'
8):;	6'97' (
• Probabilistic Classify and Count (PCC)
∑ 68 : 7;7)=	6'97' 	7 − )>	7(	 8(7)79'-∈@,AB1C-1D2
8):;	6'97' (
Measuring Model Performance for
task (3)
• Adjusted CC (ACC)
EEAFGH
IGH	AFGH
where ! J =
KL
M
and ! J =
0L
L
• Probabilistic ACC (PACC)
GEEAGFGH
GIGH	AGFGH
where ! J =
LKL
LKL@L0M
	, J =
L0L
L0L@LKM
and
PFP = , 68 : 7;7)=	6'97' 	7 − )>	7(	 8(7)79'
-∈M1PQ3-C1	B1C-1D2
	
PTN = , 68 : 7;7)=	6'97' 	7 − )>	7(	T'U:)79'
-∈M1PQ3-C1	B1C-1D2
PTP = , 68 : 7;7)=	6'97' 	7 − )>	7(	 8(7)79'
-∈LV2-3-C1	B1C-1D2
PFN = , 68 : 7;7)=	6'97' 	7 − )>	7(	T'U:)79'
-∈LV2-3-C1	B1C-1D2
ML in Quantification
Kindle Reviews, Trainset features count: 11801 Training set prevalence = 0.781
MSE(CC) MSE(ACC) MSE(PCC) MSE(PACC)
Bernoulli 14% 1% 14% 35%
SGD 9% 1% 4% 8%
SVC 12% 1% 2% 0%
DecisionTree 2% 3% 2% 4%
RandomForest 20% 1% 6% 24%
AdaBoost 5% 1% 30% 288%
Harry Potter Reviews, Trainset features count: 11165 Training set prevalence = 0.795
MSE(CC) MSE(ACC) MSE(PCC) MSE(PACC)
BernoulliNB 3.56% 101.65% 3.71% 11.32%
SGD 8.28% 4.90% 3.89% 3.23%
SVC 15.92% 23.32% 9.36% 51.81%
DecisionTree 5.26% 12.01% 5.26% 3.75%
RandomForest 34.41% 4.67% 8.79% 17.34%
AdaBoost 3.55% 16.15% 34.44% 284.02%
v
Predicting Sentiment
60%
65%
70%
75%
80%
85%
90%
95%
100%
0 2 4 6
% True Positive
Reveiws
CC
ACC
PCC
PACC
20%
30%
40%
50%
60%
70%
80%
90%
100%
0 2 4 6
% True Positive
Reveiws
CC
ACC
PCC
PACC
Kindle Fire True and
Predicted Positive
Review Percentage in 5
days using Decision Tree
HP Reviews True and
Predicted Positive
Review Percentage in 5
days using Decision
Tree
(4) Fake Review Detection Task
We want to classify a review as Real or Fake
Data consist of truthful and deceptive reviews
from TripAdvisor, Mechanical Turk, Expedia,
Hotels.com, Orbitz, Priceline and Yelp for the 20
most popular Chicago hotels. They are available
here:
http://myleott.com/op_spam/
Kfold method with k=10 is applied
(4) Fake Review Detection Task
Kfold Accuracy Kfold Recall Kfold Precision Kfold F1
POSITIVEREVIEW
LinearSVC 0.899 (719/800) 0.906 (356/393) 0.890 (356/400) 0.898 (712/793)
BernoulliNB 0.866 (693/800) 0.945 (311/329) 0.777 (311/400) 0.853 (622/729)
SGDClassifier 0.864 (691/800) 0.870 (342/393) 0.855 (342/400) 0.863 (684/793)
RandomForest 0.864 (691/800) 0.888 (333/375) 0.833 (333/400) 0.859 (666/775)
AdaBoost 0.825 (660/800) 0.837 (323/386) 0.807 (323/400) 0.822 (646/786)
NEGATIVEREVIEW
LinearSVC 0.896 (717/800) 0.903 (355/393) 0.887 (355/400) 0.895 (710/793)
BernoulliNB 0.861 (689/800) 0.926 (314/339) 0.785 (314/400) 0.850 (628/739)
SGDClassifier 0.880 (704/800) 0.906 (339/374) 0.848 (339/400) 0.876 (678/774)
RandomForest 0.850 (680/800) 0.893 (318/356) 0.795 (318/400) 0.841 (636/756)
AdaBoost 0.772 (618/800) 0.771 (310/402) 0.775 (310/400) 0.773 (620/802)
Thanks!
Andrea Gigli
https://about.me/andrea.gigli

Comparing Machine Learning Algorithms in Text Mining

  • 1.
    Sentiment Analysis &Opinion Mining Projectwork Comparing Models for Review Classification, Counting Stars, Sentiment Quantification and Fake Review Detection Andrea Gigli https://about.me/andrea.gigli
  • 2.
    The goal Comparing differentMachine Learning Algorithm on different Text Mining Tasks Tasks considered: 1) Classifying Positive and Negative Reviews 2) Predicting Review Stars 3) Quantifying Sentiment Over Time 4) Detecting Fake Reviews Tools: Python + NLTK + Scikit-learn
  • 3.
    ML Models: NaïveBayes Naïve Bayes is a probabilistic learner that uses the Bayes Theorem: = making a strong independence assumption between the features. ( | ) ∝ ( ) ( | )
  • 4.
    ML Models: SVM SupportVector Machine (SVM) is a geometric learner that represent the set of features F in a |F|-dimensional vector space: Vectors w are composed of ′s which indicate the relevance of feature f in document d The algorithm compute the hyperplane ∙ − = 0 that better separates the examples.
  • 5.
    ML Models: DecisionTrees Decision Tree algorithm generate a tree of yes/no question on features. It performs a feature selection by maximizing an Information Gain measure: = − ( | )
  • 6.
    ML Models: RandomForest Random forests are an ensemble learning method They operate by constructing a multitude of decision trees at training time and outputting the class that is the mode of the class.
  • 7.
    ML Models: AdaptiveBoosting Adaptive Boosting is a meta-algorithm which can be used in conjunction with other types of learning algorithms to improve their performance. The output of “weak learners” is combined into a weighted sum that represents the final output of the boosted classifier. It is “Adaptive” in the sense that subsequent weak learners are tweaked in favor of those instances misclassified by previous classifiers.
  • 8.
    (1) Classifying Reviews Wewant to classify a Review as Positive or Negative Data contain movie reviews labeled as Positive or Negative and you can find them here: http://www.cs.cornell.edu/people/pabo/movie-review- data/review_polarity.tar.gz (set1) http://ai.stanford.edu/~amaas/data/sentiment/aclImdb_v1.tar.gz (set2) Kfold method with k=10 is applied A separate comparison has been performed introducing lexicon features through SensiWordNet
  • 9.
    Measuring Model Performancefor task (1) Predicted labels are compared to true labels of test set. Hence a contingency table is built: TP (True Positive) FP (False Positive) P* (Predicted Positive) FN (False Negative) TN (True Negative) N* (Predicted Negative) P (Total Positive) N (Total Negative) D (Total Documents)
  • 10.
    Measuring Model Performancefor task (1) • Accuracy, + • Recall, ability to find positive documents ∗ • Precision, accuracy on positive documents • F1, harmonic mean of precision and recall 2 2 + ! + !
  • 11.
    ML in ReviewClassification (set 1) Kfold Accuracy Kfold Recall Kfold Precision Kfold F1 NaiveBayes (Bernoulli) 0.863 (1726/2000) 0.873 (850/974) 0.850 (850/1000) 0.861 (1700/1974) SVM (Linear) 0.853 (1705/2000) 0.844 (865/1025) 0.865 (865/1000) 0.854 (1730/2025) DecisionTree 0.622 (1243/2000) 0.631 (586/929) 0.586 (586/1000) 0.608 (1172/1929) RandomForest 0.713 (1425/2000) 0.792 (576/727) 0.576 (576/1000) 0.667 (1152/1727) AdaBoost 0.758 (1516/2000) 0.775 (727/938) 0.727 (727/1000) 0.750 (1454/1938) With Lexicon Features Kfold Accuracy Kfold Recall Kfold Precision Kfold F1 NaiveBayes (Bernoulli) 0.850 (1699/2000) 0.871 (820/941) 0.820 (820/1000) 0.845 (1640/1941) SVM (Linear) 0.836 (1671/2000) 0.834 (837/1003) 0.837 (837/1000) 0.836 (1674/2003) DecisionTree 0.657 (1315/2000) 0.658 (655/995) 0.655 (655/1000) 0.657 (1310/1995) RandomForest 0.720 (1439/2000) 0.785 (604/769) 0.604 (604/1000) 0.683 (1208/1769) AdaBoost 0.764 (1528/2000) 0.757 (778/1028) 0.778 (778/1000) 0.767 (1556/2028)
  • 12.
    ML in ReviewClassification (set 2) Kfold Accuracy Kfold Recall Kfold Precision Kfold F1 NaiveBayes (Bernoulli) 0.825 (20625/25000) 0.872 (9529/10933) 0.762 (9529/12500) 0.813 (19058/23433) SVM (Linear) 0.876 (21908/25000) 0.885 (10814/12220) 0.865 (10814/12500) 0.875 (21628/24720) DecisionTree 0.708 (17712/25000) 0.713 (8711/12210) 0.697 (8711/12500) 0.705 (17422/24710) RandomForest 0.756 (18898/25000) 0.801 (8521/10644) 0.682 (8521/12500) 0.736 (17042/23144) AdaBoost 0.801 (20018/25000) 0.785 (10365/13212) 0.829 (10365/12500) 0.806 (20730/25712) With Lexicon Features Kfold Accuracy Kfold Recall Kfold Precision Kfold F1 NaiveBayes (Bernoulli) 0.825 (20625/25000) 0.872 (9530/10935) 0.762 (9530/12500) 0.813 (19060/23435) SVM (Linear) 0.881 (22015/25000) 0.891 (10840/12165) 0.867 (10840/12500) 0.879 (21680/24665) DecisionTree 0.704 (17589/25000) 0.705 (8745/12401) 0.700 (8745/12500) 0.702 (17490/24901) RandomForest 0.757 (18924/25000) 0.814 (8332/10240) 0.667 (8332/12500) 0.733 (16664/22740) AdaBoost 0.804 (20096/25000) 0.780 (10581/13566) 0.846 (10581/12500) 0.812 (21162/26066)
  • 13.
    (2) Predicting ReviewStars We want to predict the score associated to a review. Data contain scoring (from 1 to 5) and reviews from Amazon and TripAdvisor and they are available at: http://patty.isti.cnr.it/~baccianella/reviewdata/corpus/Amazon_corpus.zip (set 1) http://patty.isti.cnr.it/~baccianella/reviewdata/corpus/TripAdvisor_corpus .zip (set 2) We used bigrams as an additional feature.
  • 14.
    Measuring Model Performancefor task (2) Let Φ be the true classification function and Φ# the learning algorithm $%& Φ#, '()*') = 1 | '()*')| , |Φ# - − Φ - | ./0123413 $*& Φ#, '()*') = 1 | '()*')| , Φ# - − Φ - 5 ./0123413
  • 15.
    ML in CountingStars (set 1) F1 - 1 F1 - 2 F1 - 3 F1 - 4 F1 - 5 Acc MAE MSE Support Vector Classifier -Bigrams 0.71 0.19 0.15 0.42 0.76 0.61 0.595 1.21 +Bigrams 0.72 0.17 0.10 0.43 0.76 0.62 0.589 0.59 Linear Regression -Bigrams 0.43 0.25 0.26 0.40 0.61 0.45 0.704 1.07 +Bigrams 0.54 0.24 0.25 0.39 0.65 0.48 0.669 1.04 SVC Regression -Bigrams 0.37 0.24 0.27 0.42 0.62 0.45 0.68 0.98 +Bigrams 0.42 0.24 0.26 0.41 0.64 0.46 0.67 0.98 Decision Tree with BernoulliNB -Bigrams 0.70 0.25 0.20 0.47 0.75 0.60 0.56 1.05 +Bigrams 0.72 0.28 0.11 0.47 0.76 0.61 0.55 1.01
  • 16.
    ML in CountingStars (set 2) F1 - 1 F1 - 2 F1 - 3 F1 - 4 F1 - 5 Acc MAE MSE Support Vector Classifier - Bigrams 0.54 0.37 0.28 0.58 0.75 0.62 0.46 0.66 +Bigrams 0.48 0.38 0.24 0.56 0.74 0.61 0.47 0.67 Linear Regression - Bigrams 0.21 0.20 0.27 0.52 0.66 0.53 0.61 0.96 + Bigrams 0.32 0.29 0.29 0.53 0.70 0.55 0.56 0.86 SVC Regression - Bigrams 0.16 0.31 0.37 0.55 0.67 0.55 0.49 0.60 + Bigrams 0.09 0.26 0.34 0.56 0.68 0.56 0.50 0.63 Decision Tree with BernoulliNB - Bigrams 0.58 0.46 0.36 0.59 0.74 0.62 0.41 0.51 + Bigrams 0.52 0.47 0.35 0.60 0.76 0.63 0.40 0.49
  • 17.
    (3) Quantification Task Wewant to understand the “user’s sentiment” on each day, using the percentage of daily positive reviews as a proxy. Data contains Positive and Negative Reviews collected over 5 days for Kindle Fire and Harry Potter Book. You can download them here https://www.dropbox.com/s/x512wqnzp1v2xa9/quantificationdata.zip?dl=0 20% 30% 40% 50% 60% 70% 80% 90% 0 2 4 6 20% 30% 40% 50% 60% 70% 80% 90% 0 2 4 6 Positive Review Percentage
  • 18.
    Measuring Model Performancefor task (3) • Classify and Count (CC) 6' 7 )' 8(7)79' 8):; 6'97' ( • Probabilistic Classify and Count (PCC) ∑ 68 : 7;7)= 6'97' 7 − )> 7( 8(7)79'-∈@,AB1C-1D2 8):; 6'97' (
  • 19.
    Measuring Model Performancefor task (3) • Adjusted CC (ACC) EEAFGH IGH AFGH where ! J = KL M and ! J = 0L L • Probabilistic ACC (PACC) GEEAGFGH GIGH AGFGH where ! J = LKL LKL@L0M , J = L0L L0L@LKM and PFP = , 68 : 7;7)= 6'97' 7 − )> 7( 8(7)79' -∈M1PQ3-C1 B1C-1D2 PTN = , 68 : 7;7)= 6'97' 7 − )> 7( T'U:)79' -∈M1PQ3-C1 B1C-1D2 PTP = , 68 : 7;7)= 6'97' 7 − )> 7( 8(7)79' -∈LV2-3-C1 B1C-1D2 PFN = , 68 : 7;7)= 6'97' 7 − )> 7( T'U:)79' -∈LV2-3-C1 B1C-1D2
  • 20.
    ML in Quantification KindleReviews, Trainset features count: 11801 Training set prevalence = 0.781 MSE(CC) MSE(ACC) MSE(PCC) MSE(PACC) Bernoulli 14% 1% 14% 35% SGD 9% 1% 4% 8% SVC 12% 1% 2% 0% DecisionTree 2% 3% 2% 4% RandomForest 20% 1% 6% 24% AdaBoost 5% 1% 30% 288% Harry Potter Reviews, Trainset features count: 11165 Training set prevalence = 0.795 MSE(CC) MSE(ACC) MSE(PCC) MSE(PACC) BernoulliNB 3.56% 101.65% 3.71% 11.32% SGD 8.28% 4.90% 3.89% 3.23% SVC 15.92% 23.32% 9.36% 51.81% DecisionTree 5.26% 12.01% 5.26% 3.75% RandomForest 34.41% 4.67% 8.79% 17.34% AdaBoost 3.55% 16.15% 34.44% 284.02% v
  • 21.
    Predicting Sentiment 60% 65% 70% 75% 80% 85% 90% 95% 100% 0 24 6 % True Positive Reveiws CC ACC PCC PACC 20% 30% 40% 50% 60% 70% 80% 90% 100% 0 2 4 6 % True Positive Reveiws CC ACC PCC PACC Kindle Fire True and Predicted Positive Review Percentage in 5 days using Decision Tree HP Reviews True and Predicted Positive Review Percentage in 5 days using Decision Tree
  • 22.
    (4) Fake ReviewDetection Task We want to classify a review as Real or Fake Data consist of truthful and deceptive reviews from TripAdvisor, Mechanical Turk, Expedia, Hotels.com, Orbitz, Priceline and Yelp for the 20 most popular Chicago hotels. They are available here: http://myleott.com/op_spam/ Kfold method with k=10 is applied
  • 23.
    (4) Fake ReviewDetection Task Kfold Accuracy Kfold Recall Kfold Precision Kfold F1 POSITIVEREVIEW LinearSVC 0.899 (719/800) 0.906 (356/393) 0.890 (356/400) 0.898 (712/793) BernoulliNB 0.866 (693/800) 0.945 (311/329) 0.777 (311/400) 0.853 (622/729) SGDClassifier 0.864 (691/800) 0.870 (342/393) 0.855 (342/400) 0.863 (684/793) RandomForest 0.864 (691/800) 0.888 (333/375) 0.833 (333/400) 0.859 (666/775) AdaBoost 0.825 (660/800) 0.837 (323/386) 0.807 (323/400) 0.822 (646/786) NEGATIVEREVIEW LinearSVC 0.896 (717/800) 0.903 (355/393) 0.887 (355/400) 0.895 (710/793) BernoulliNB 0.861 (689/800) 0.926 (314/339) 0.785 (314/400) 0.850 (628/739) SGDClassifier 0.880 (704/800) 0.906 (339/374) 0.848 (339/400) 0.876 (678/774) RandomForest 0.850 (680/800) 0.893 (318/356) 0.795 (318/400) 0.841 (636/756) AdaBoost 0.772 (618/800) 0.771 (310/402) 0.775 (310/400) 0.773 (620/802)
  • 24.