Download to read offline
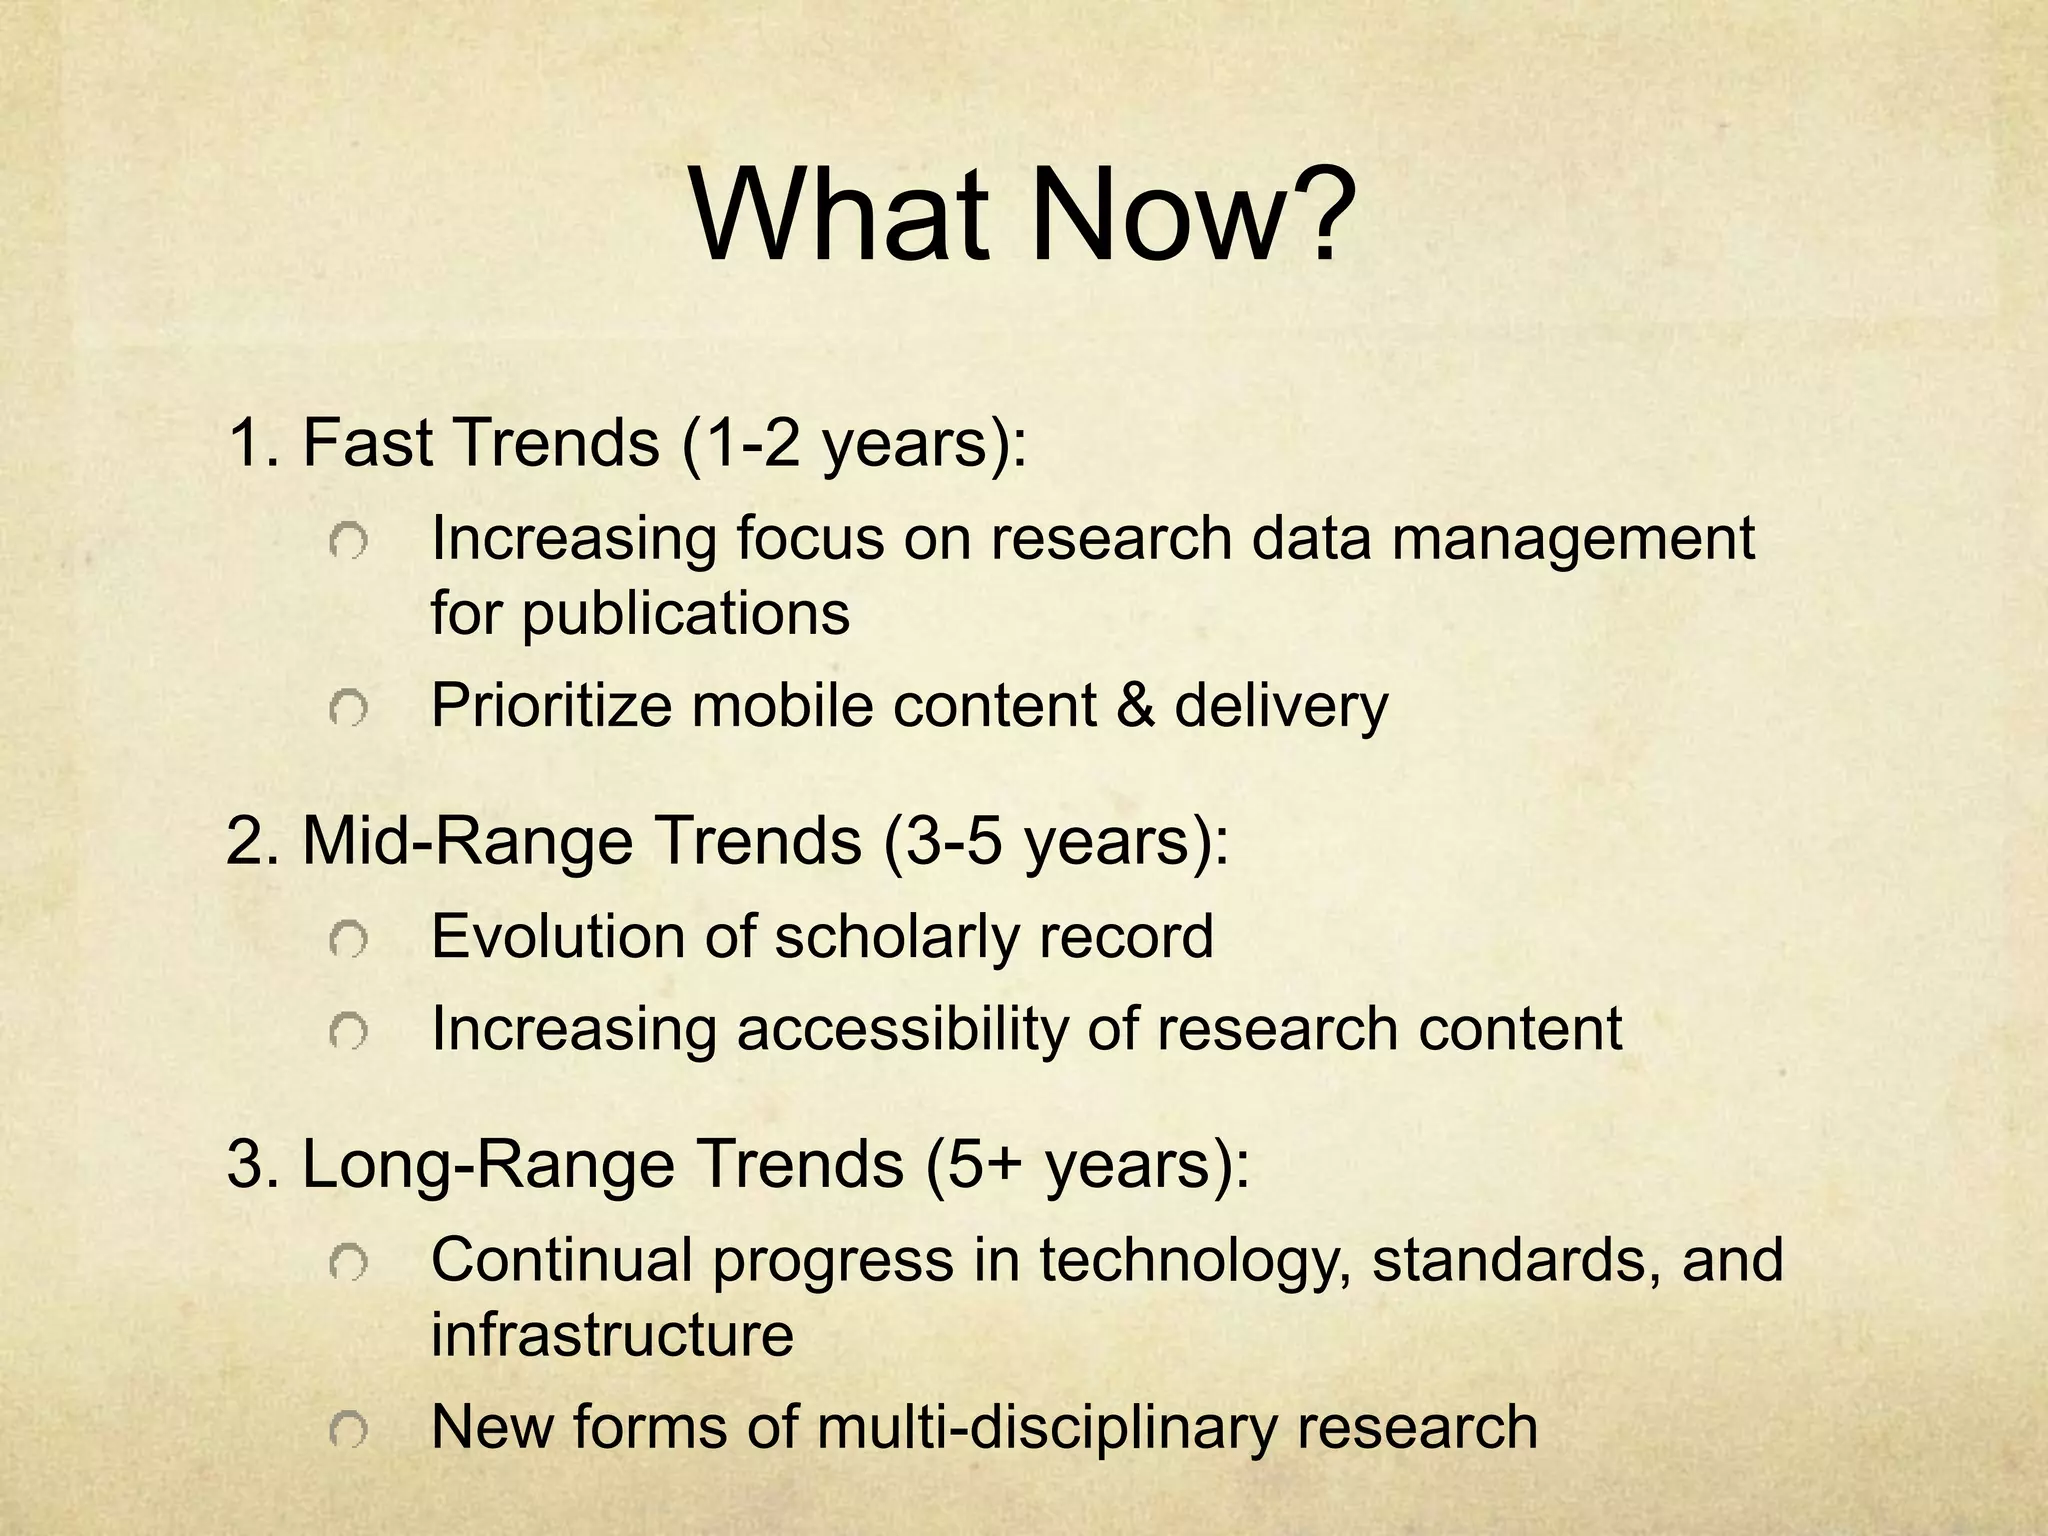
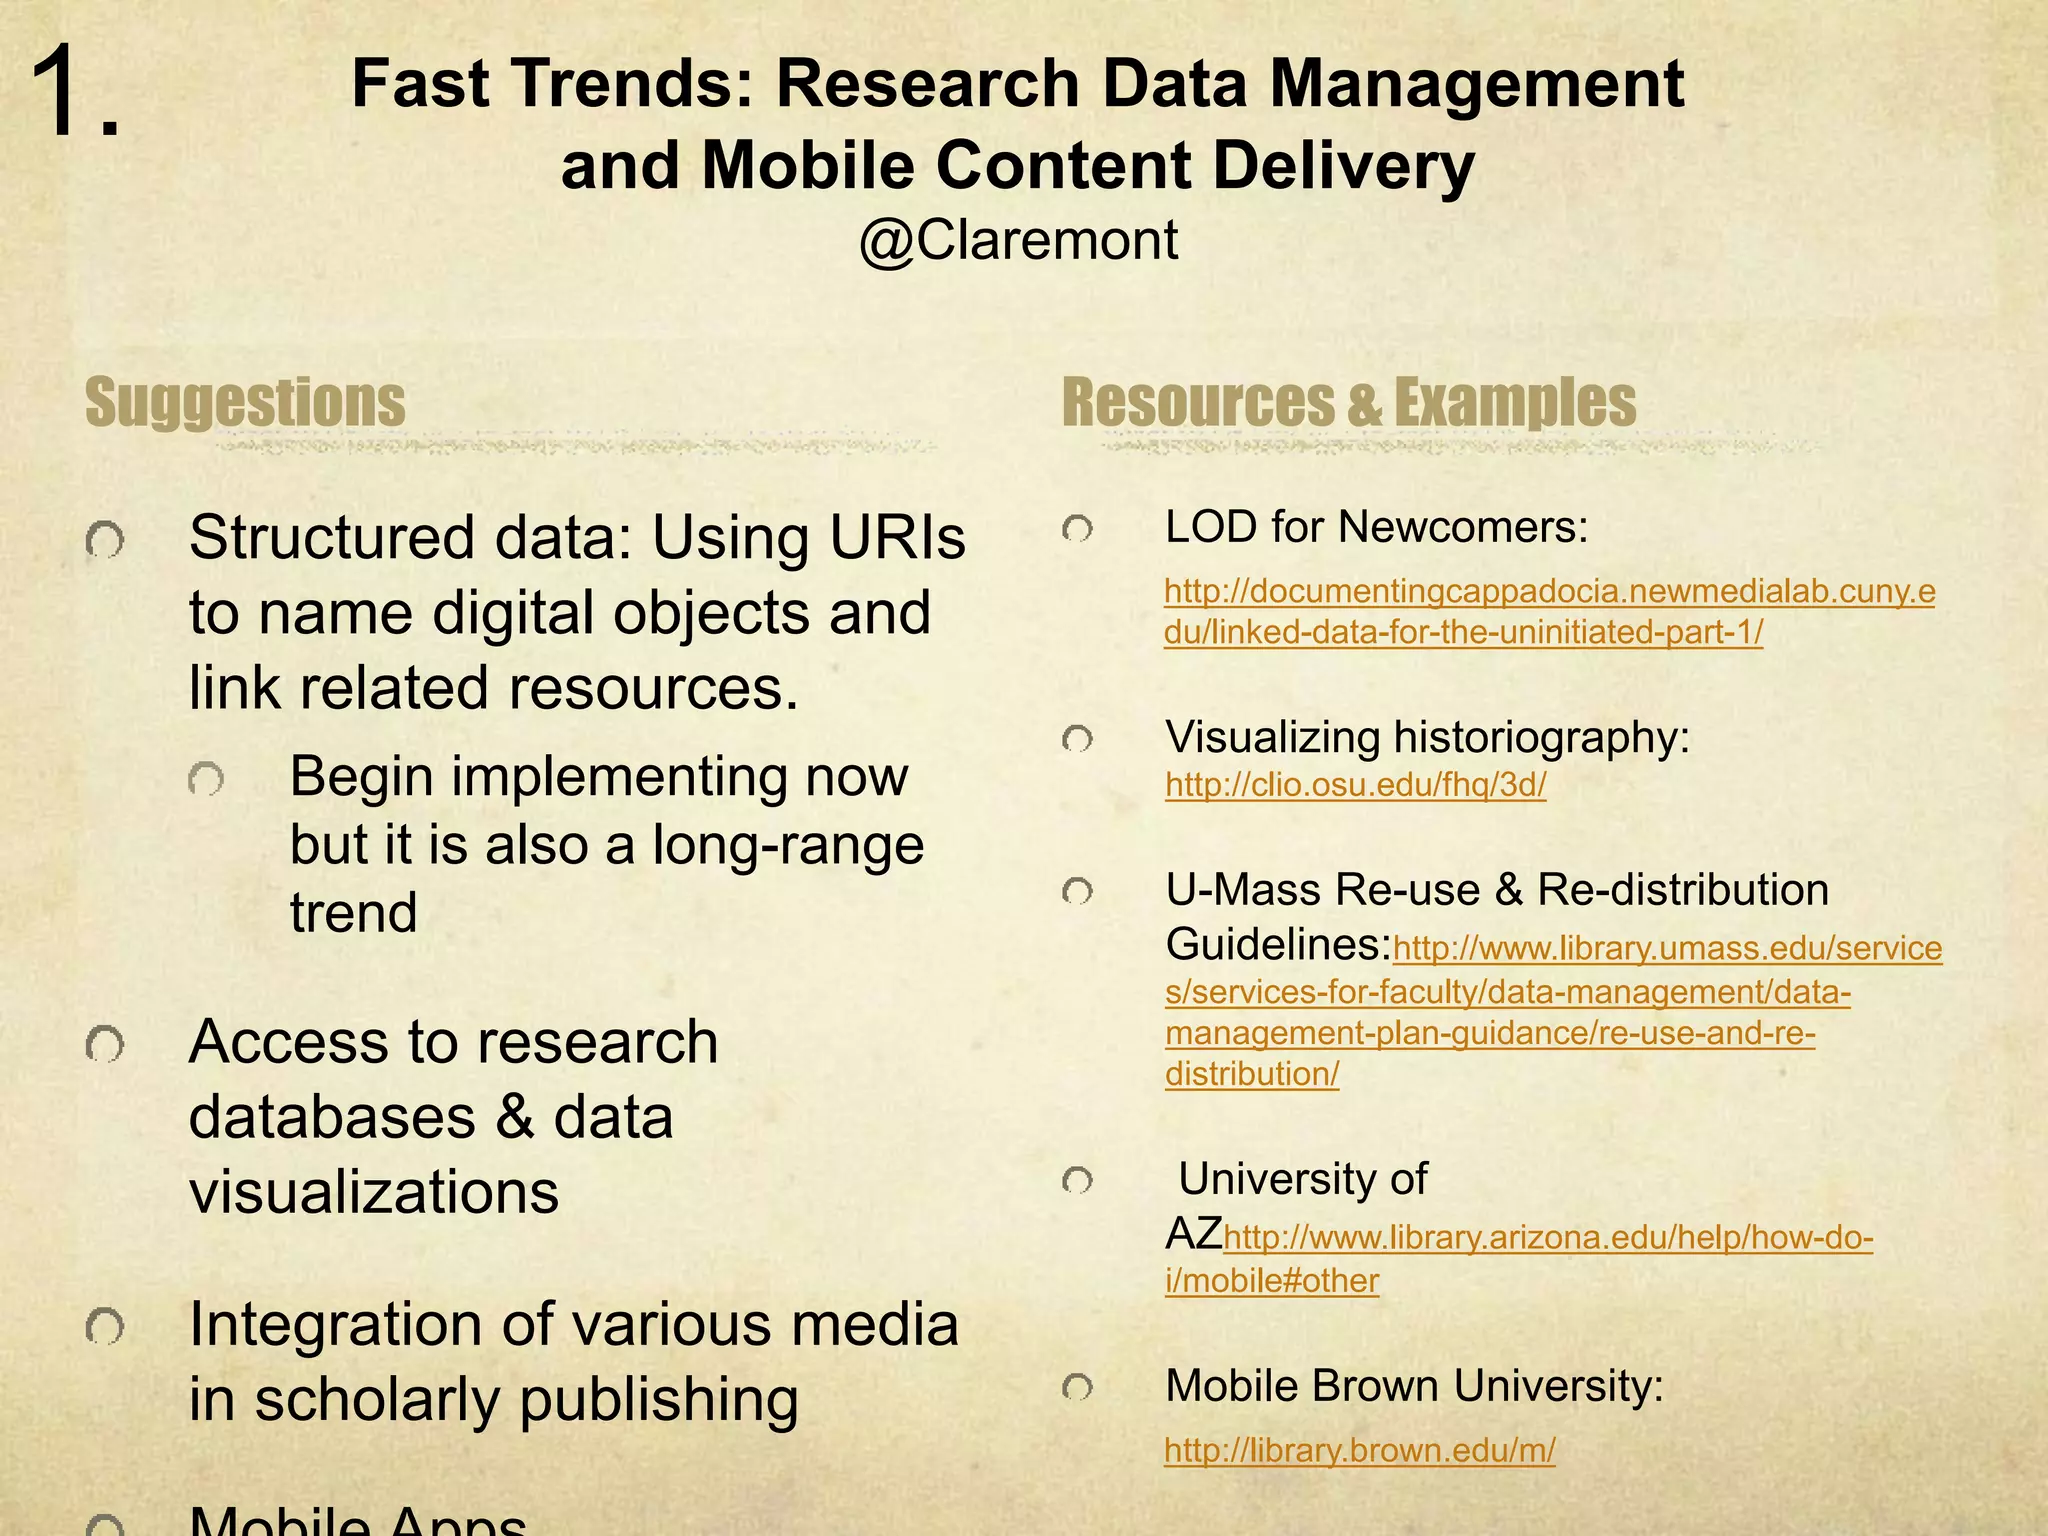
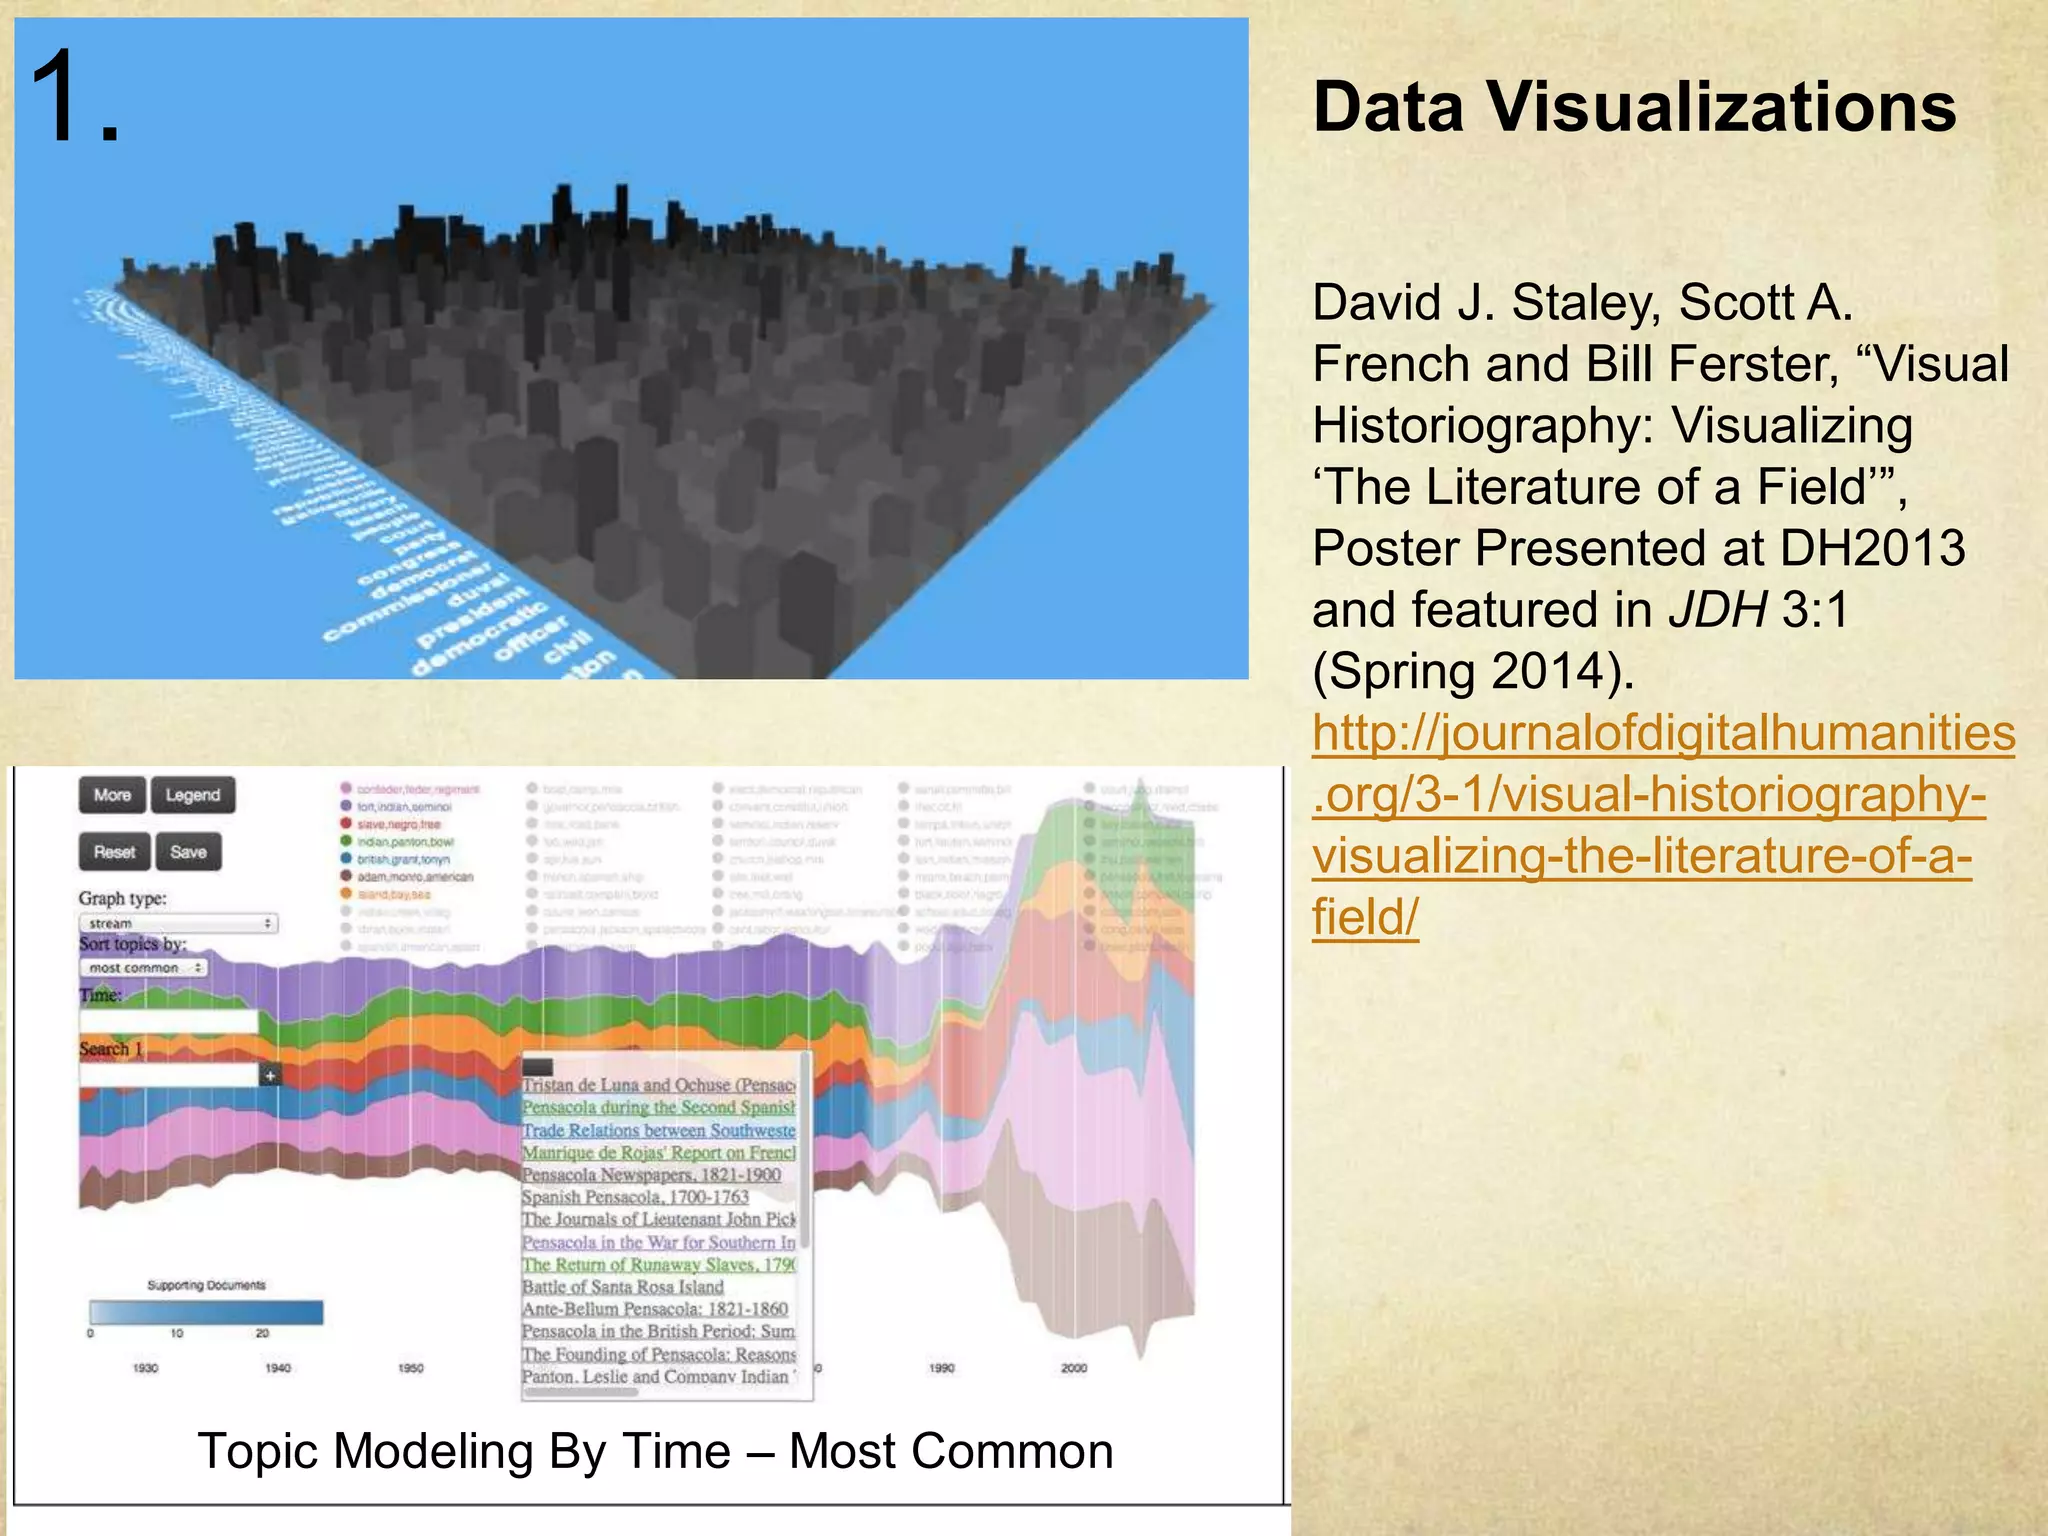
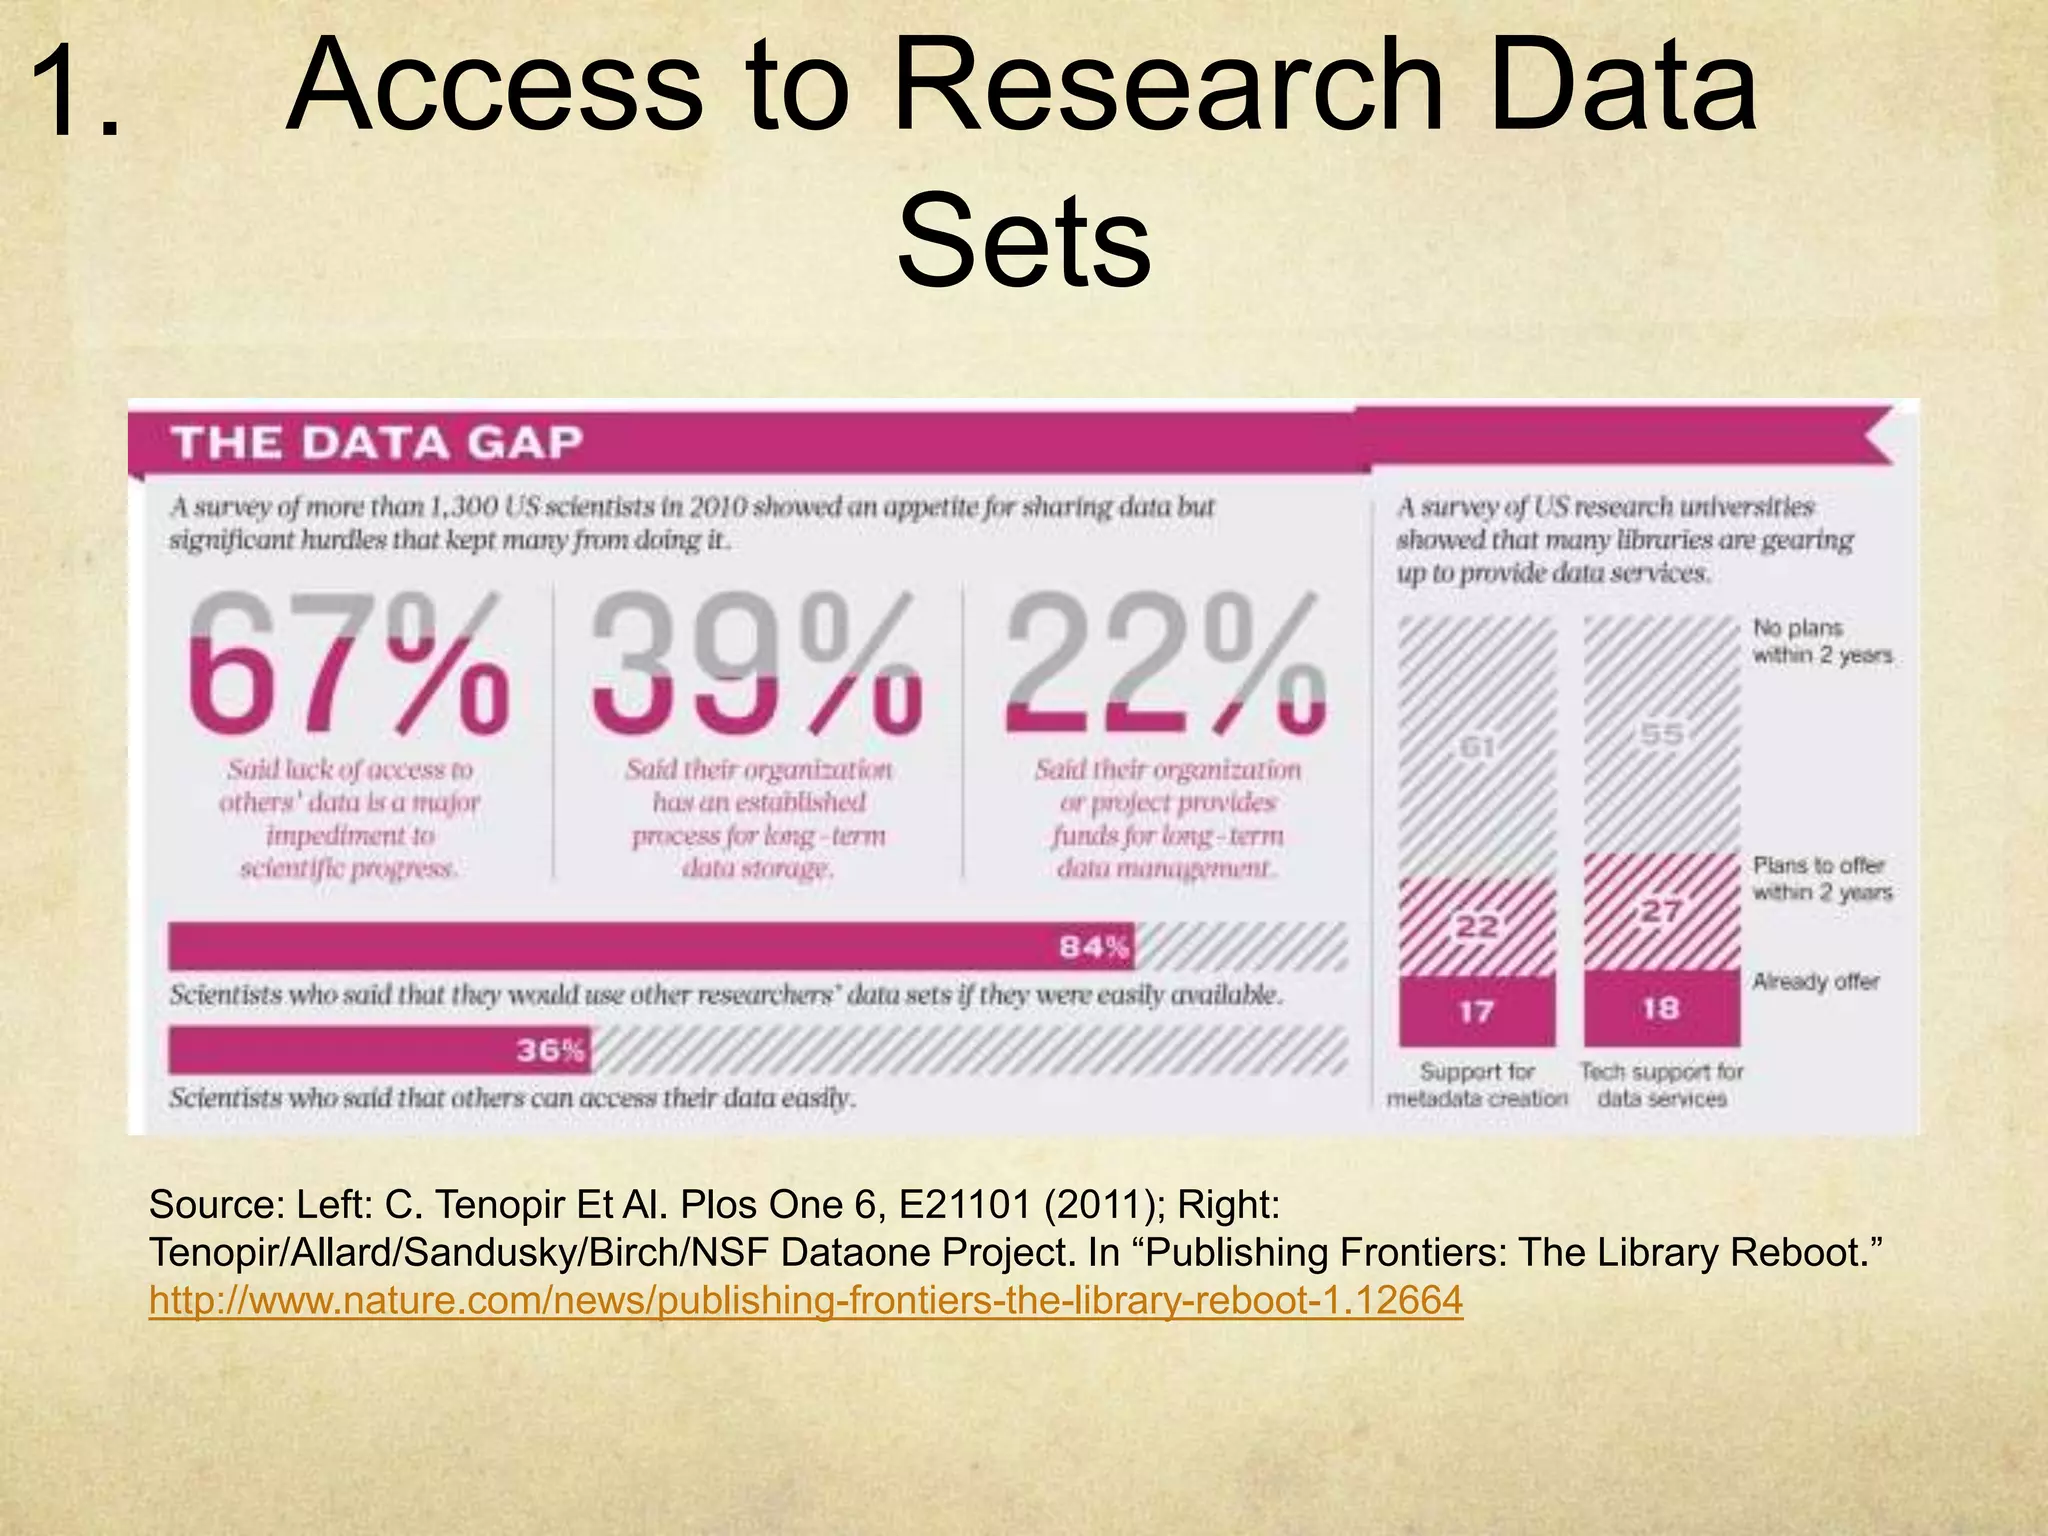
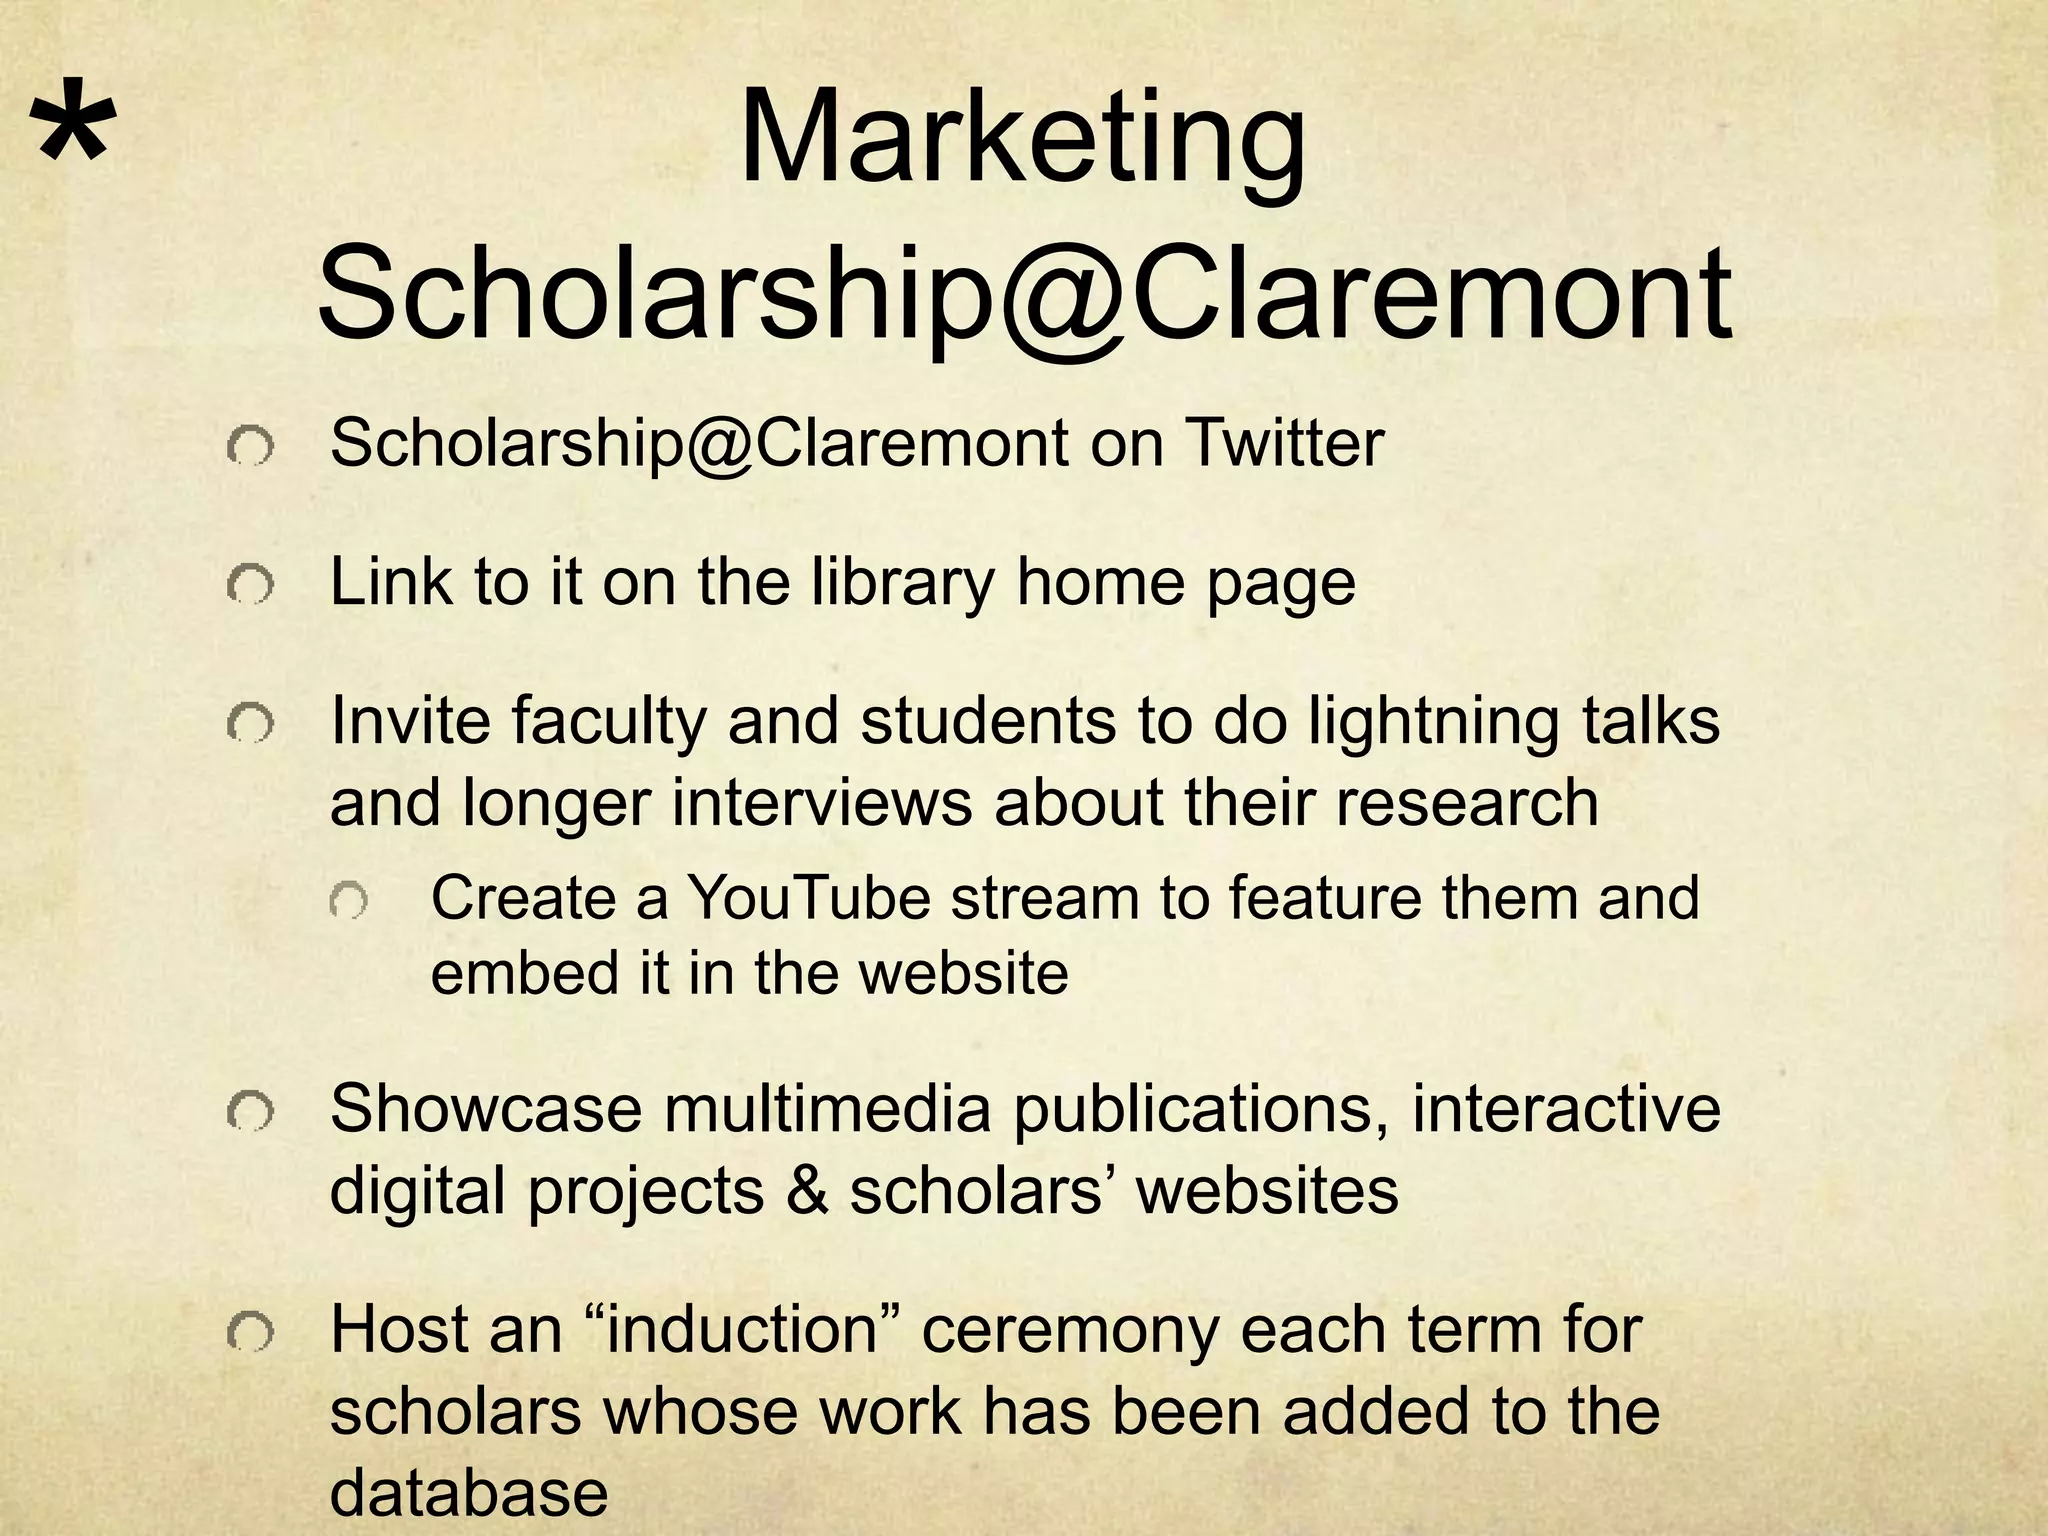
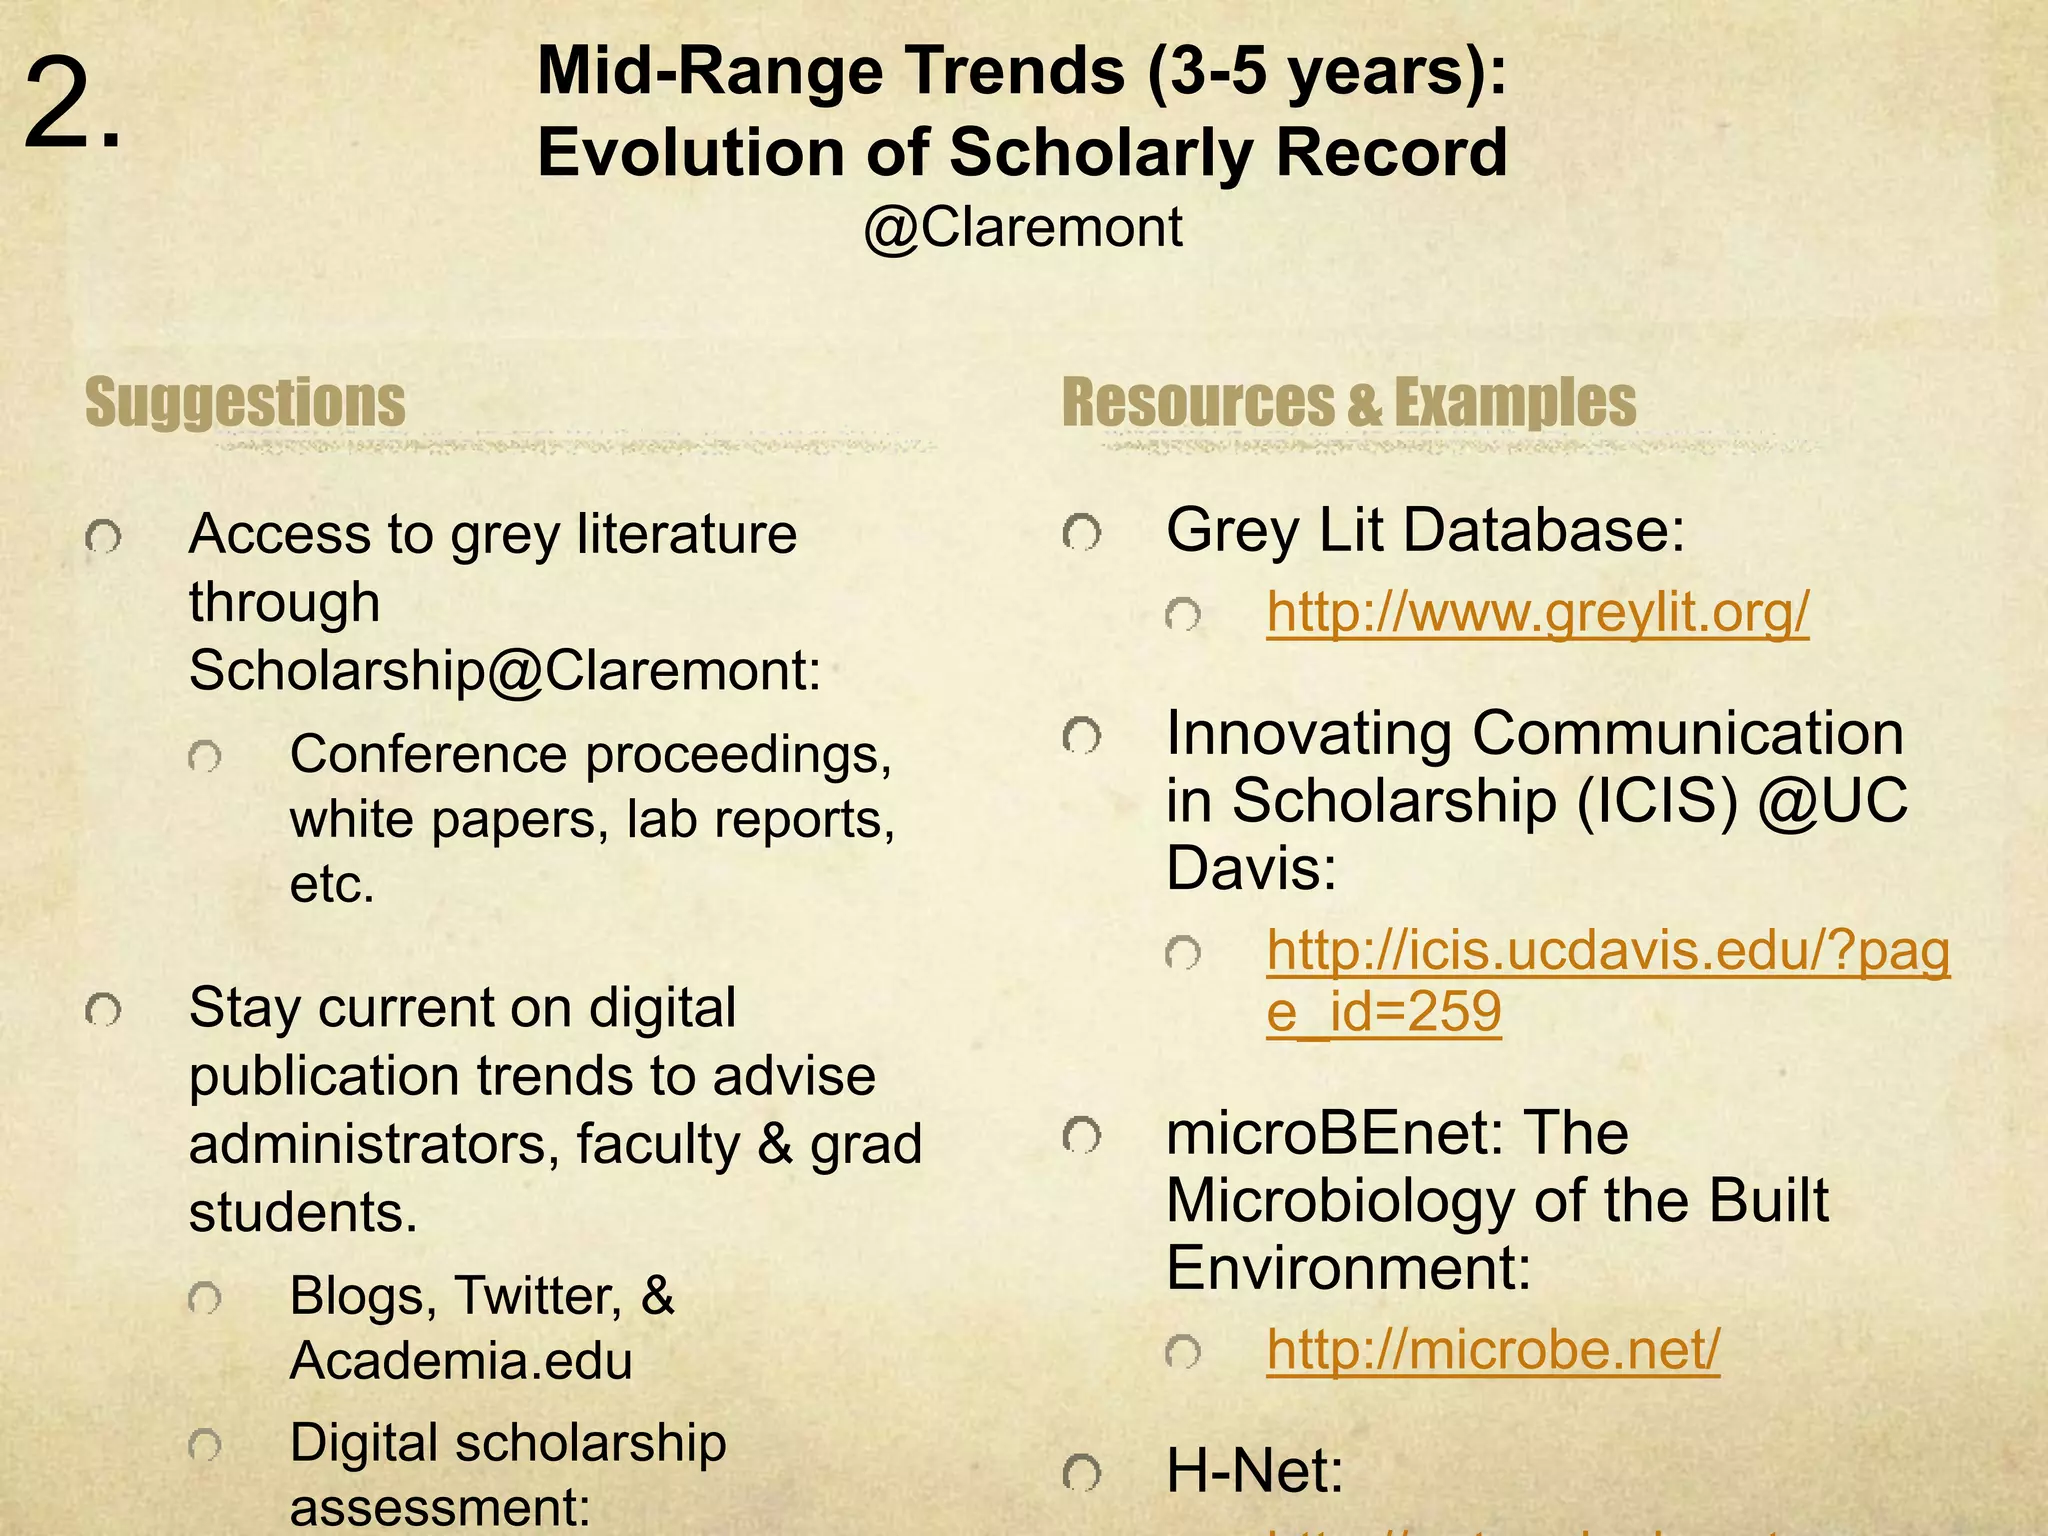
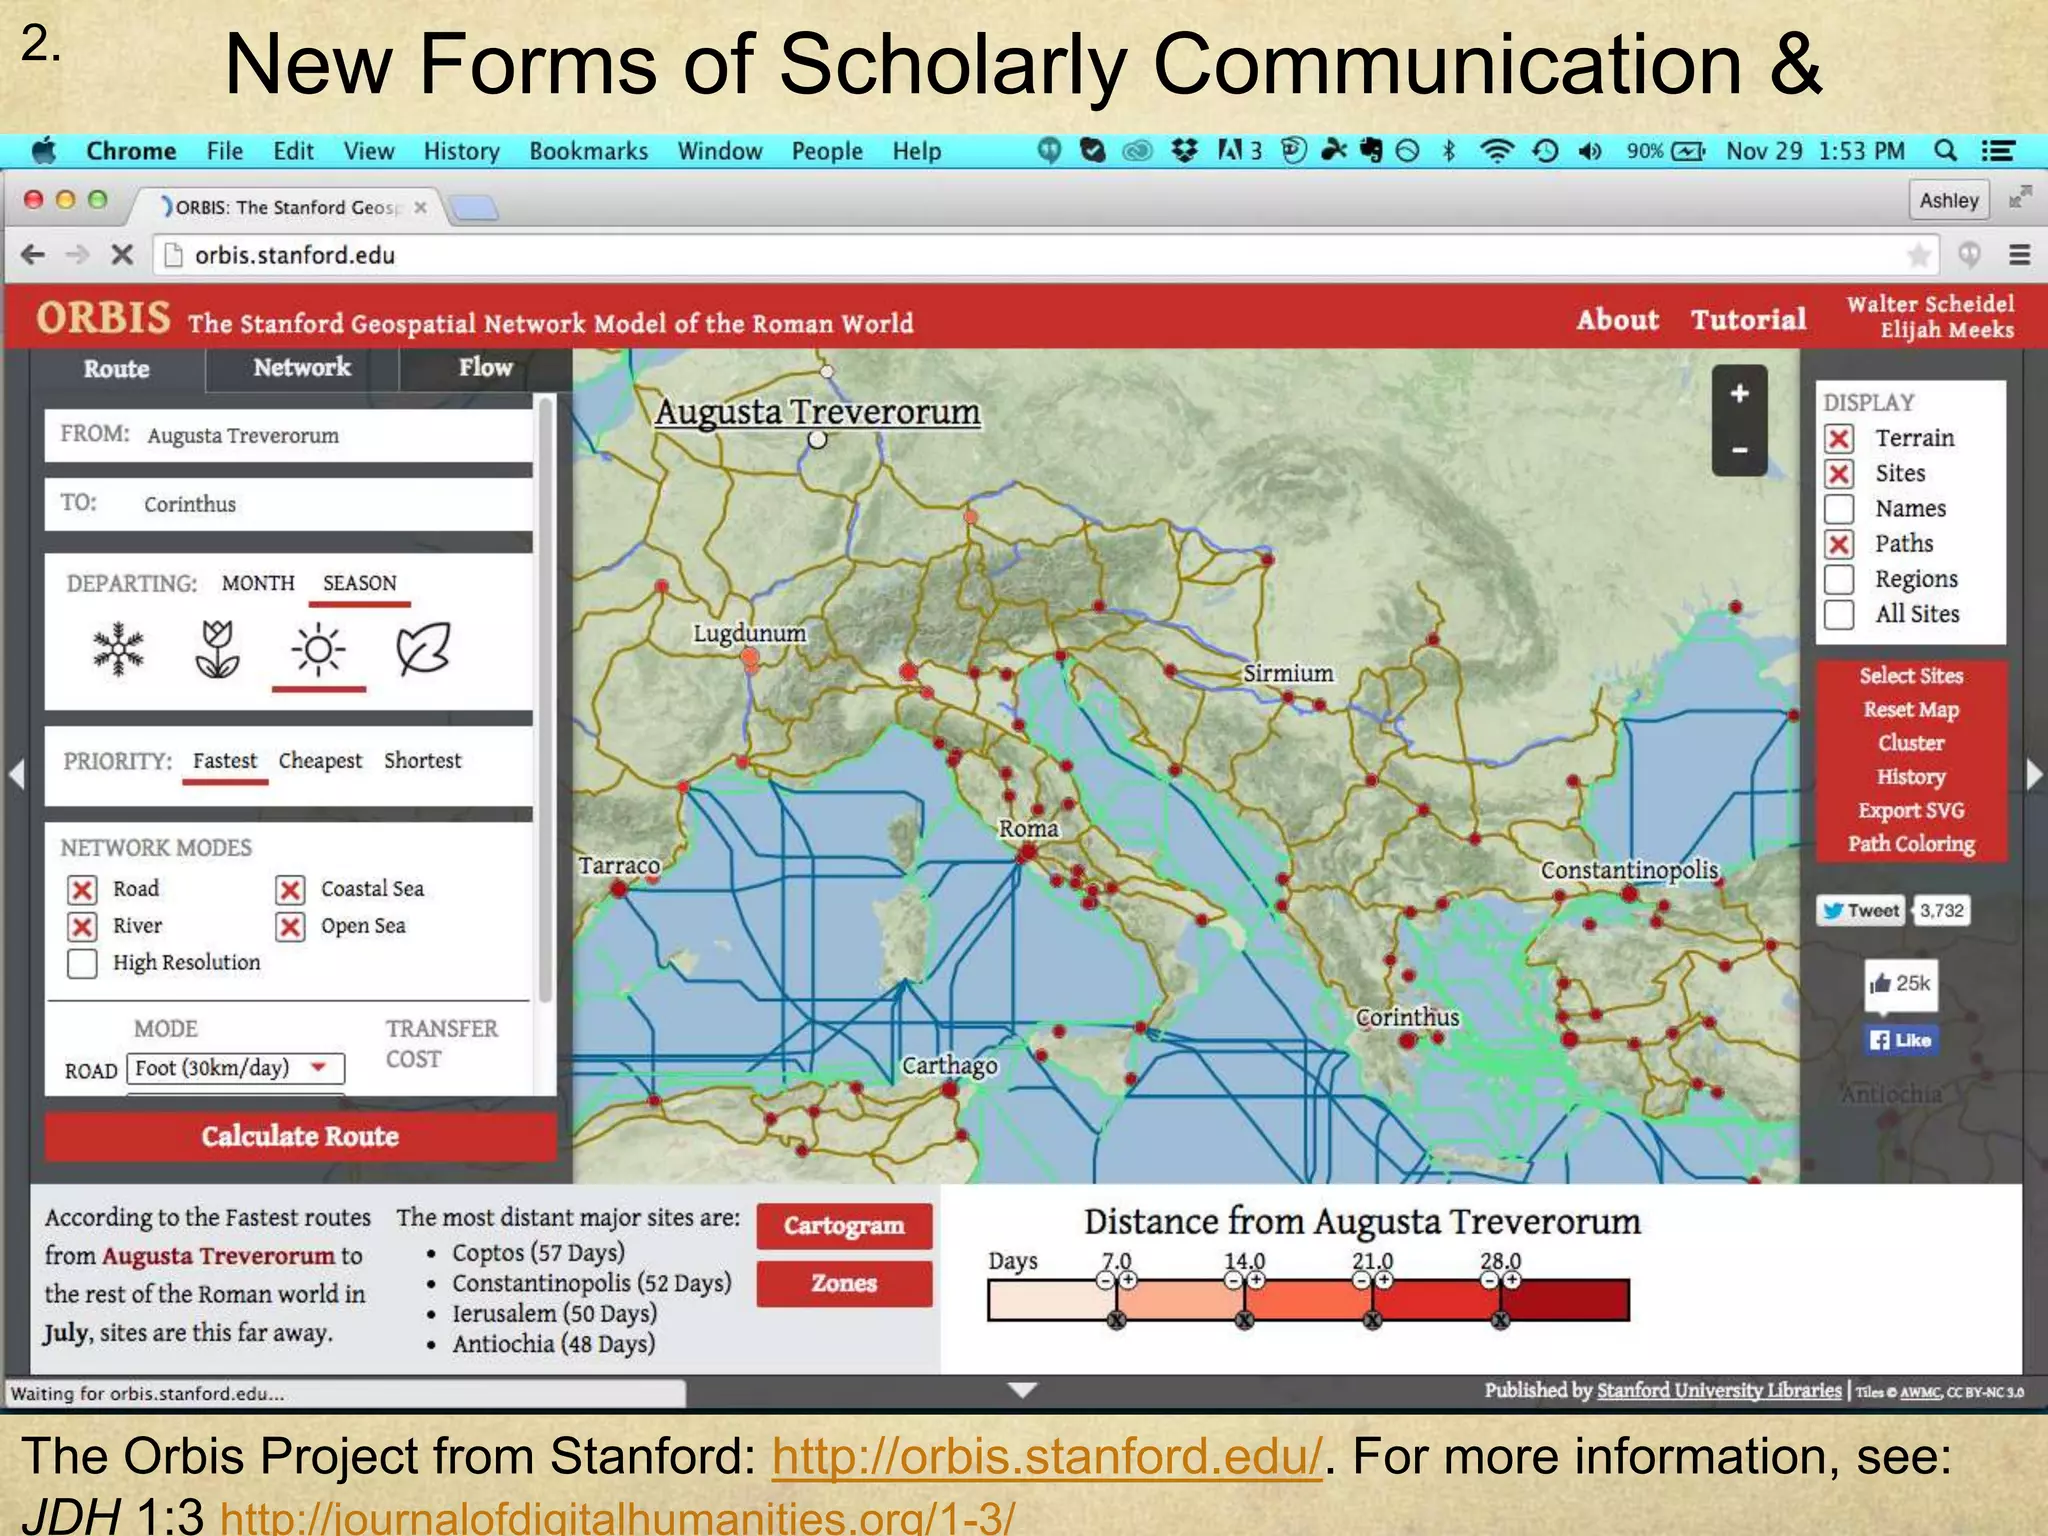
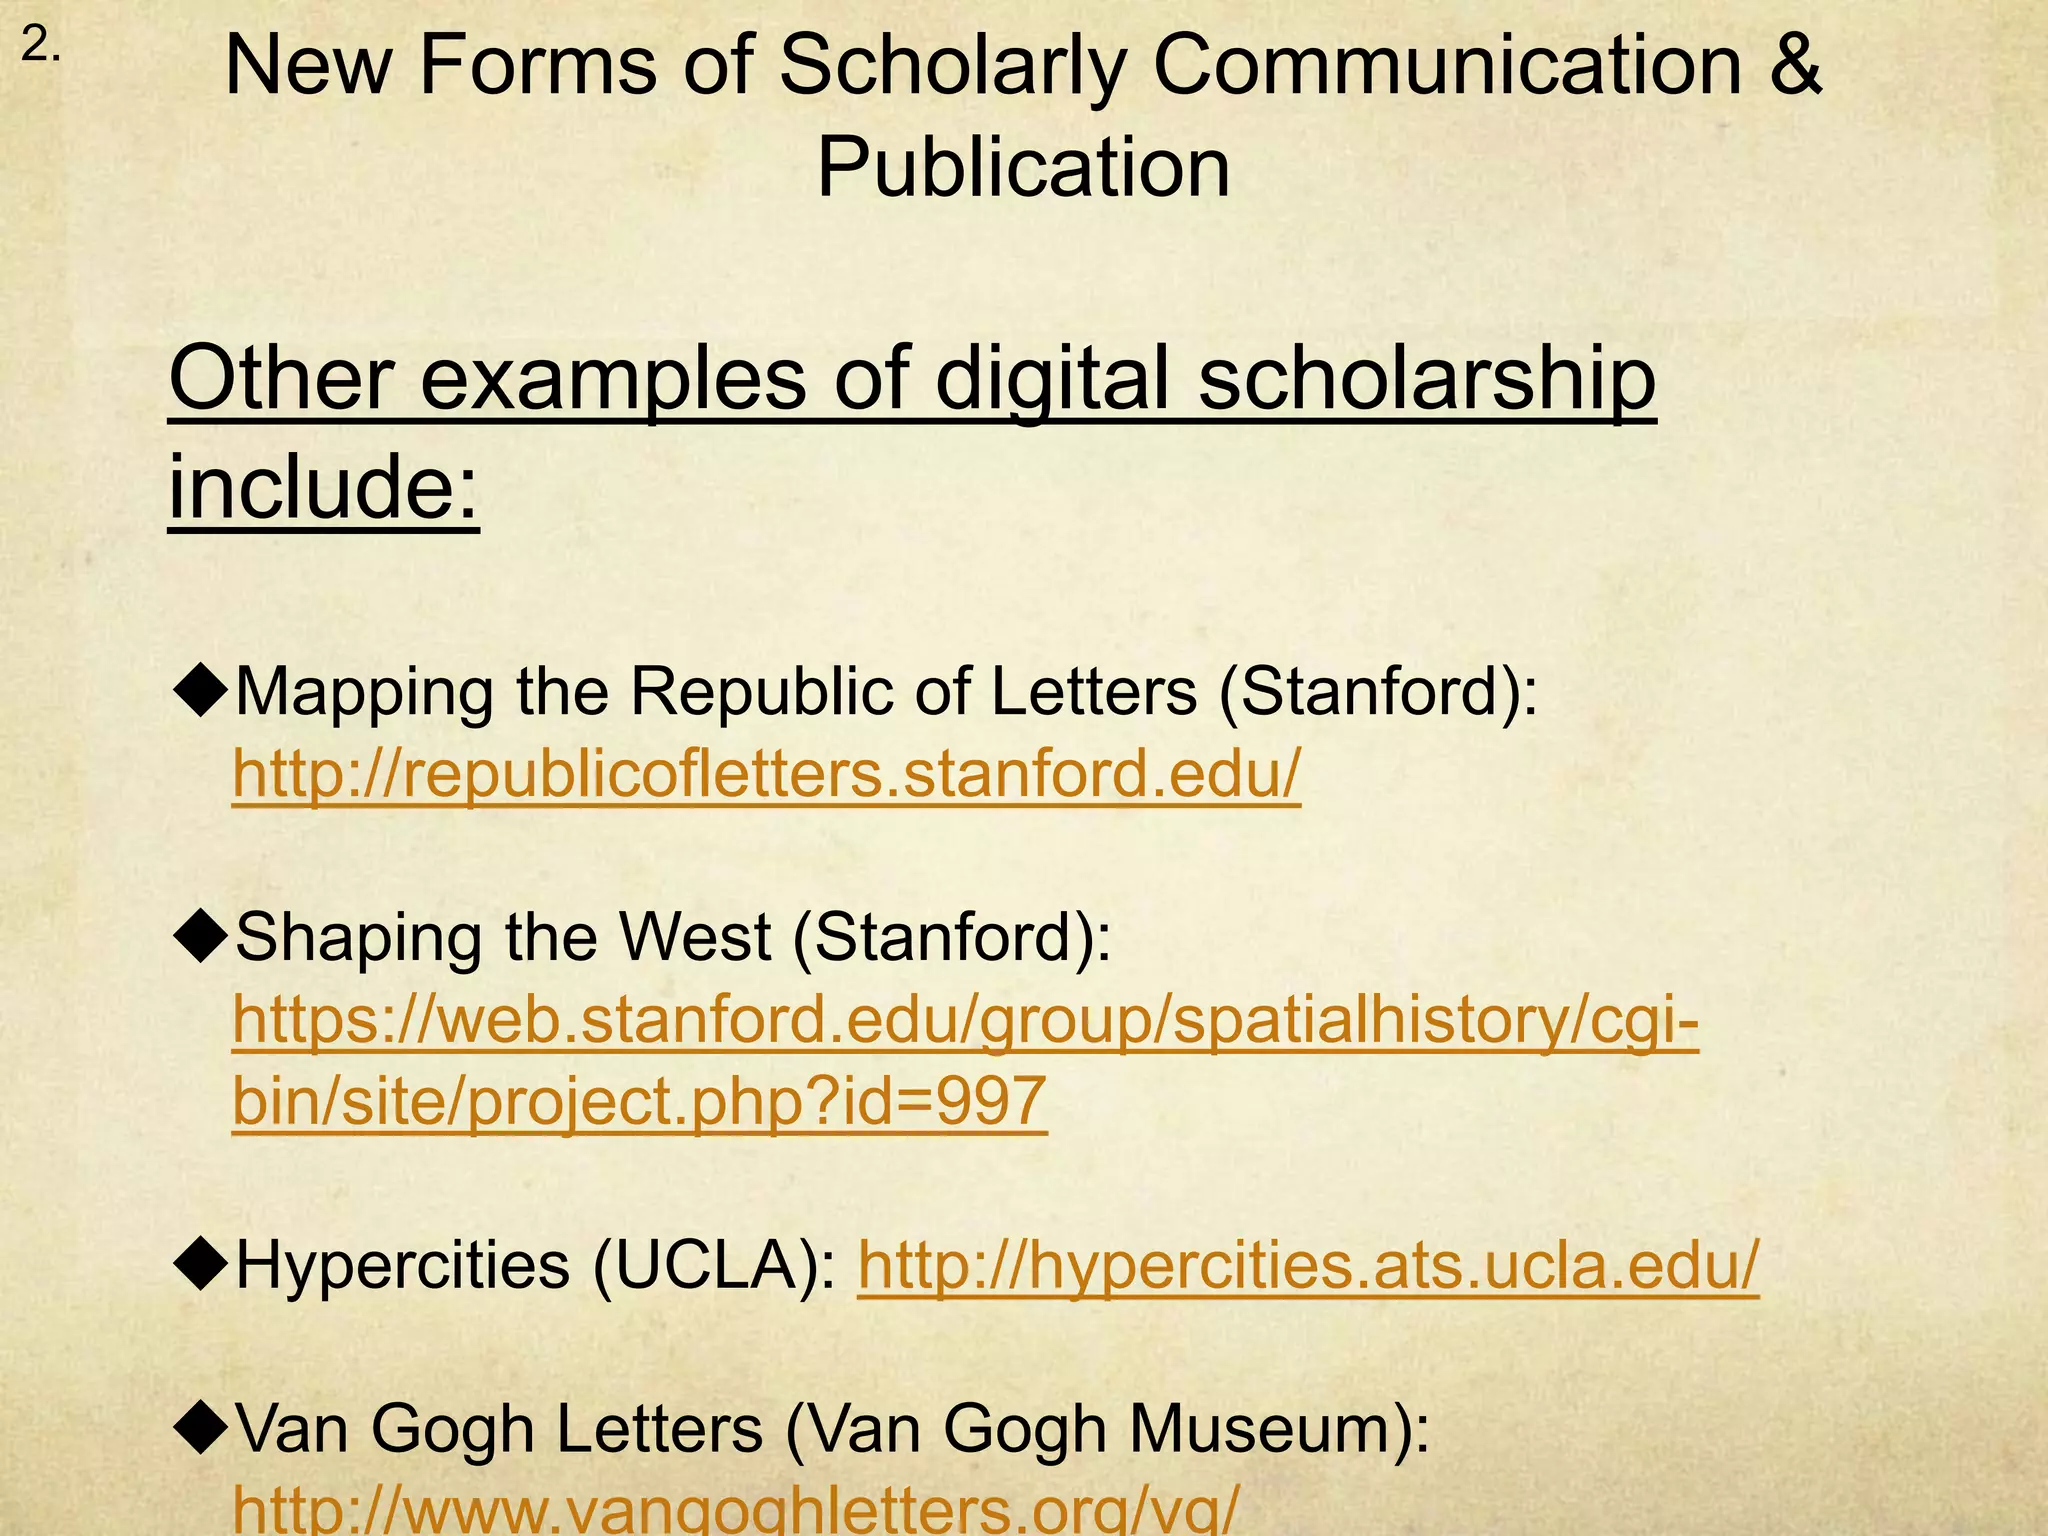
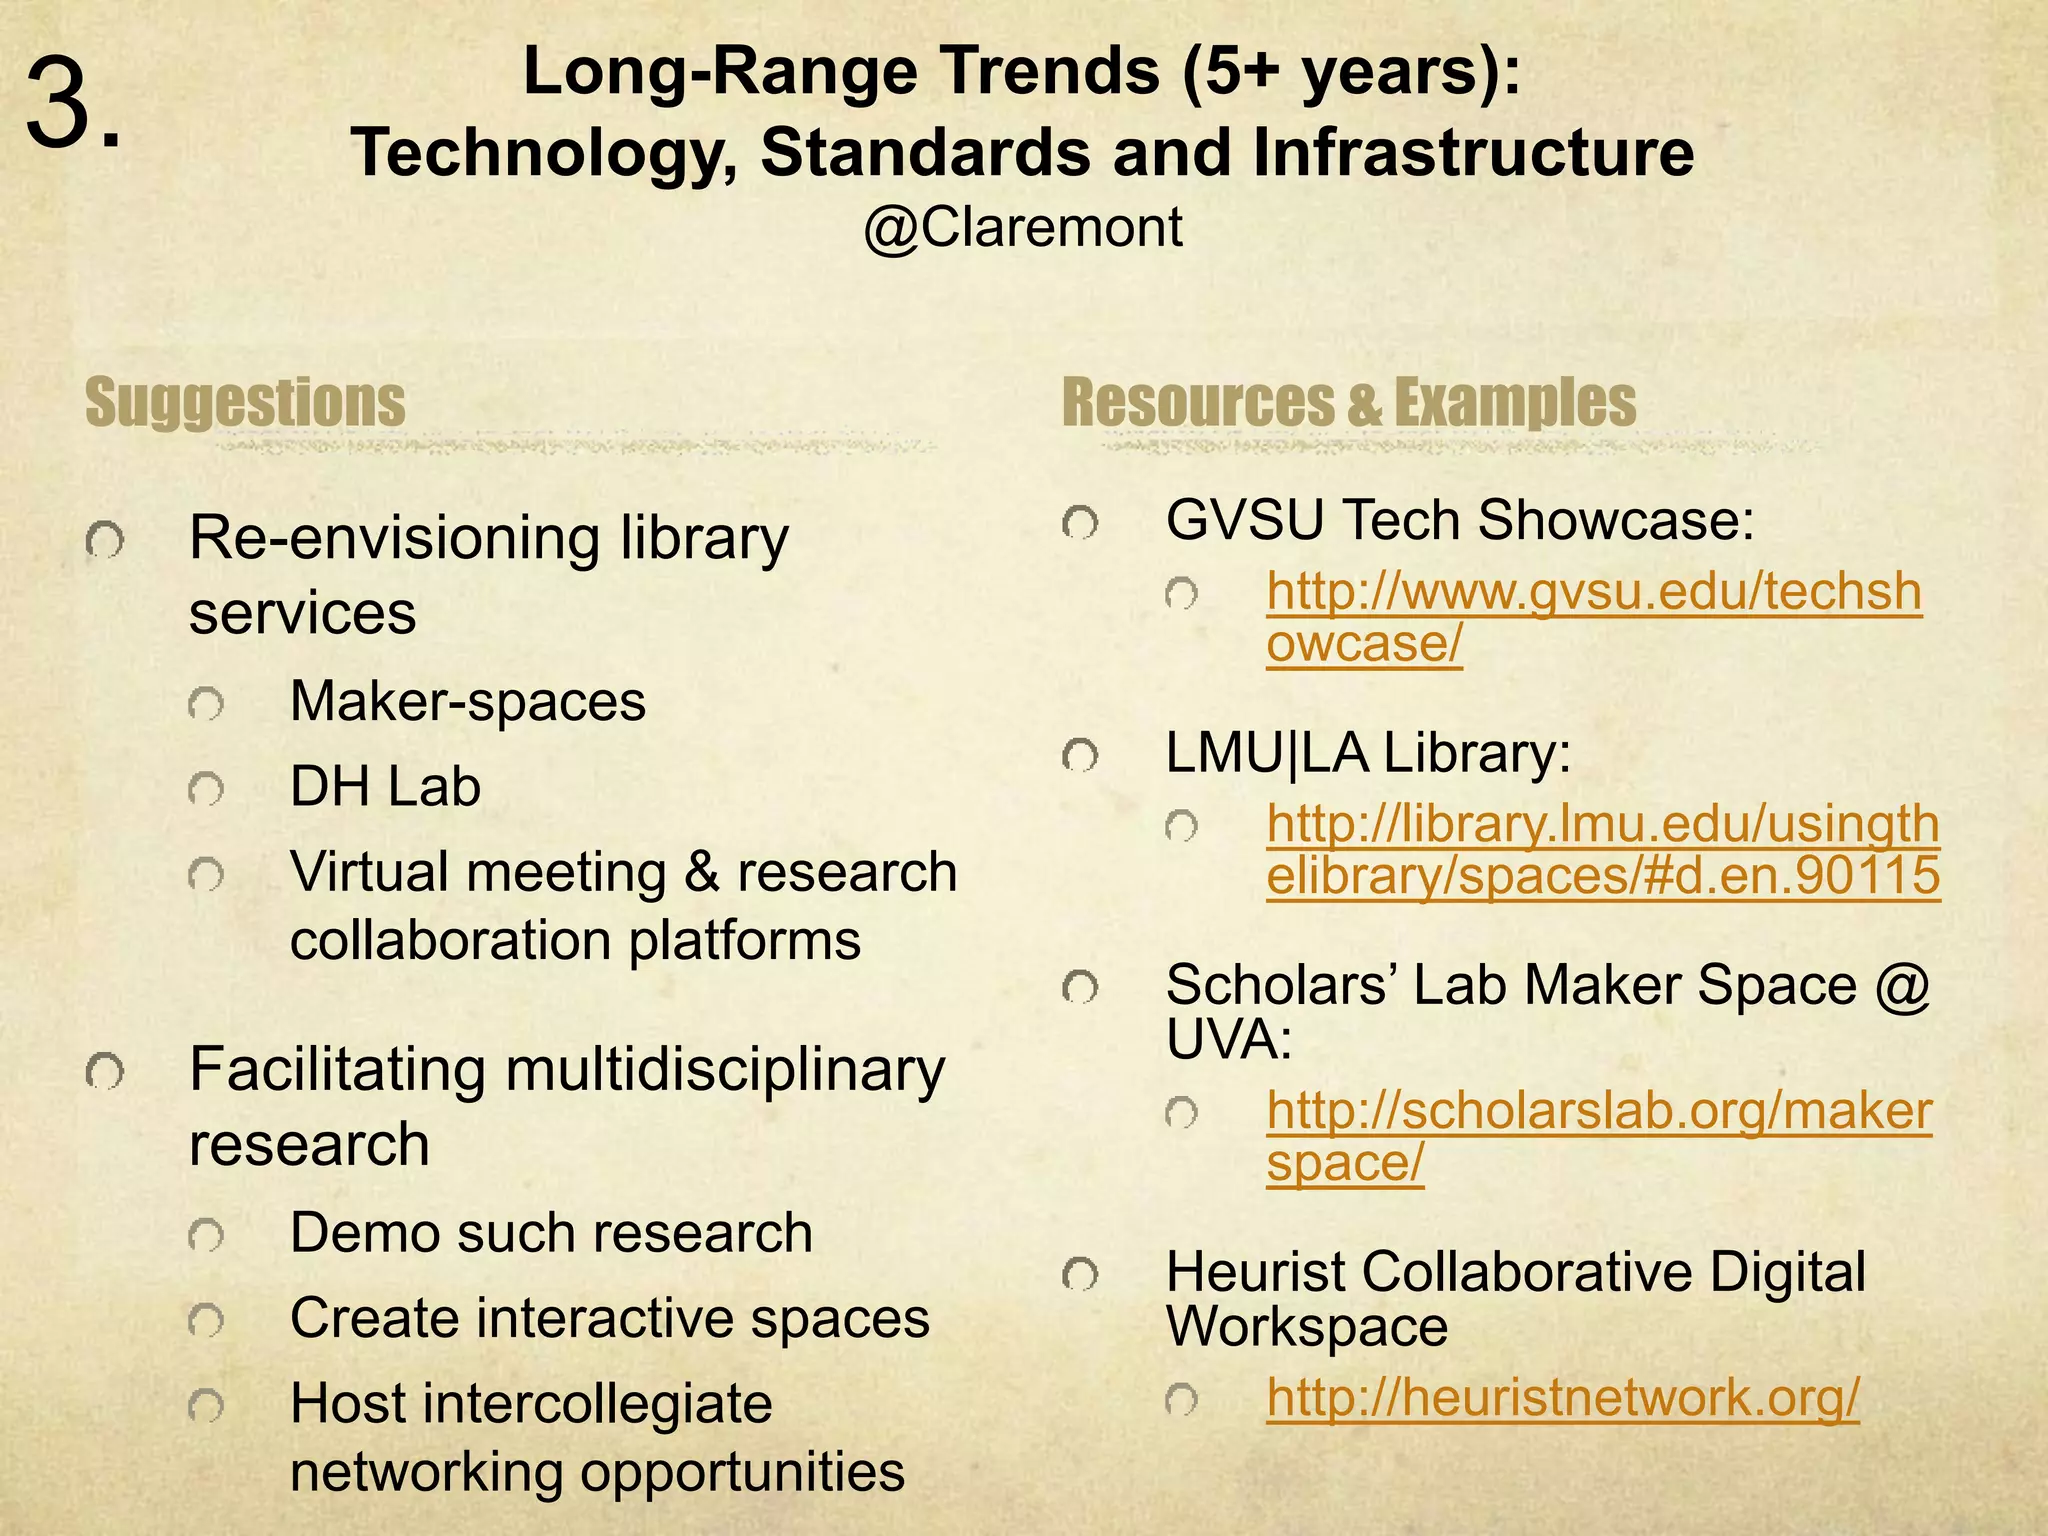
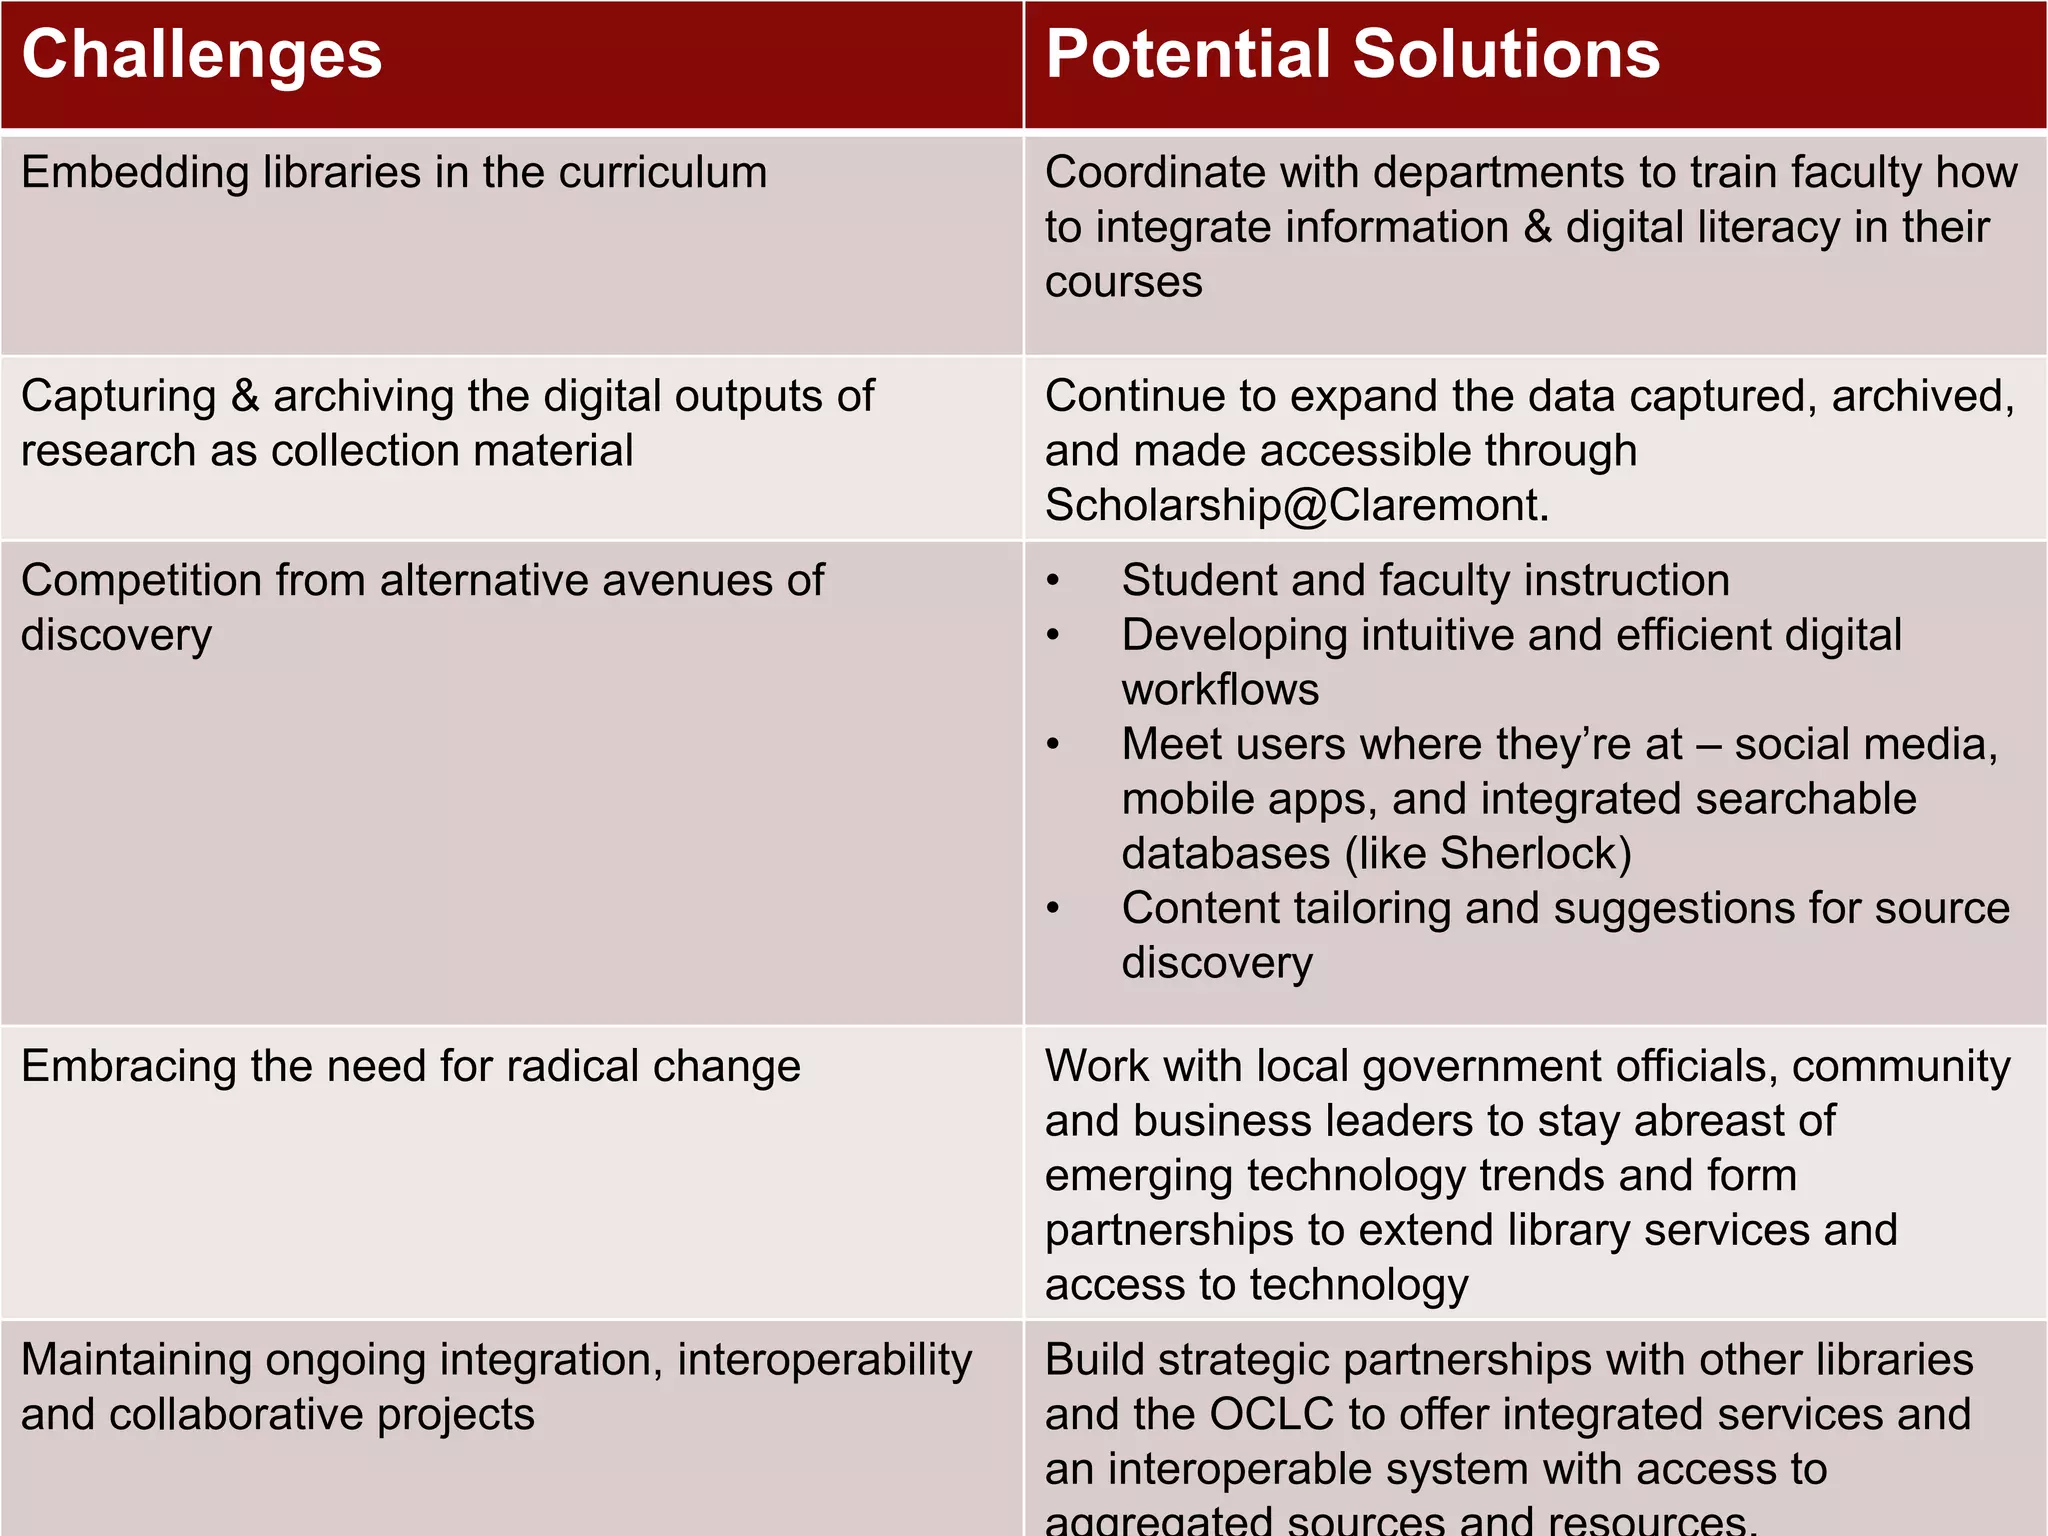
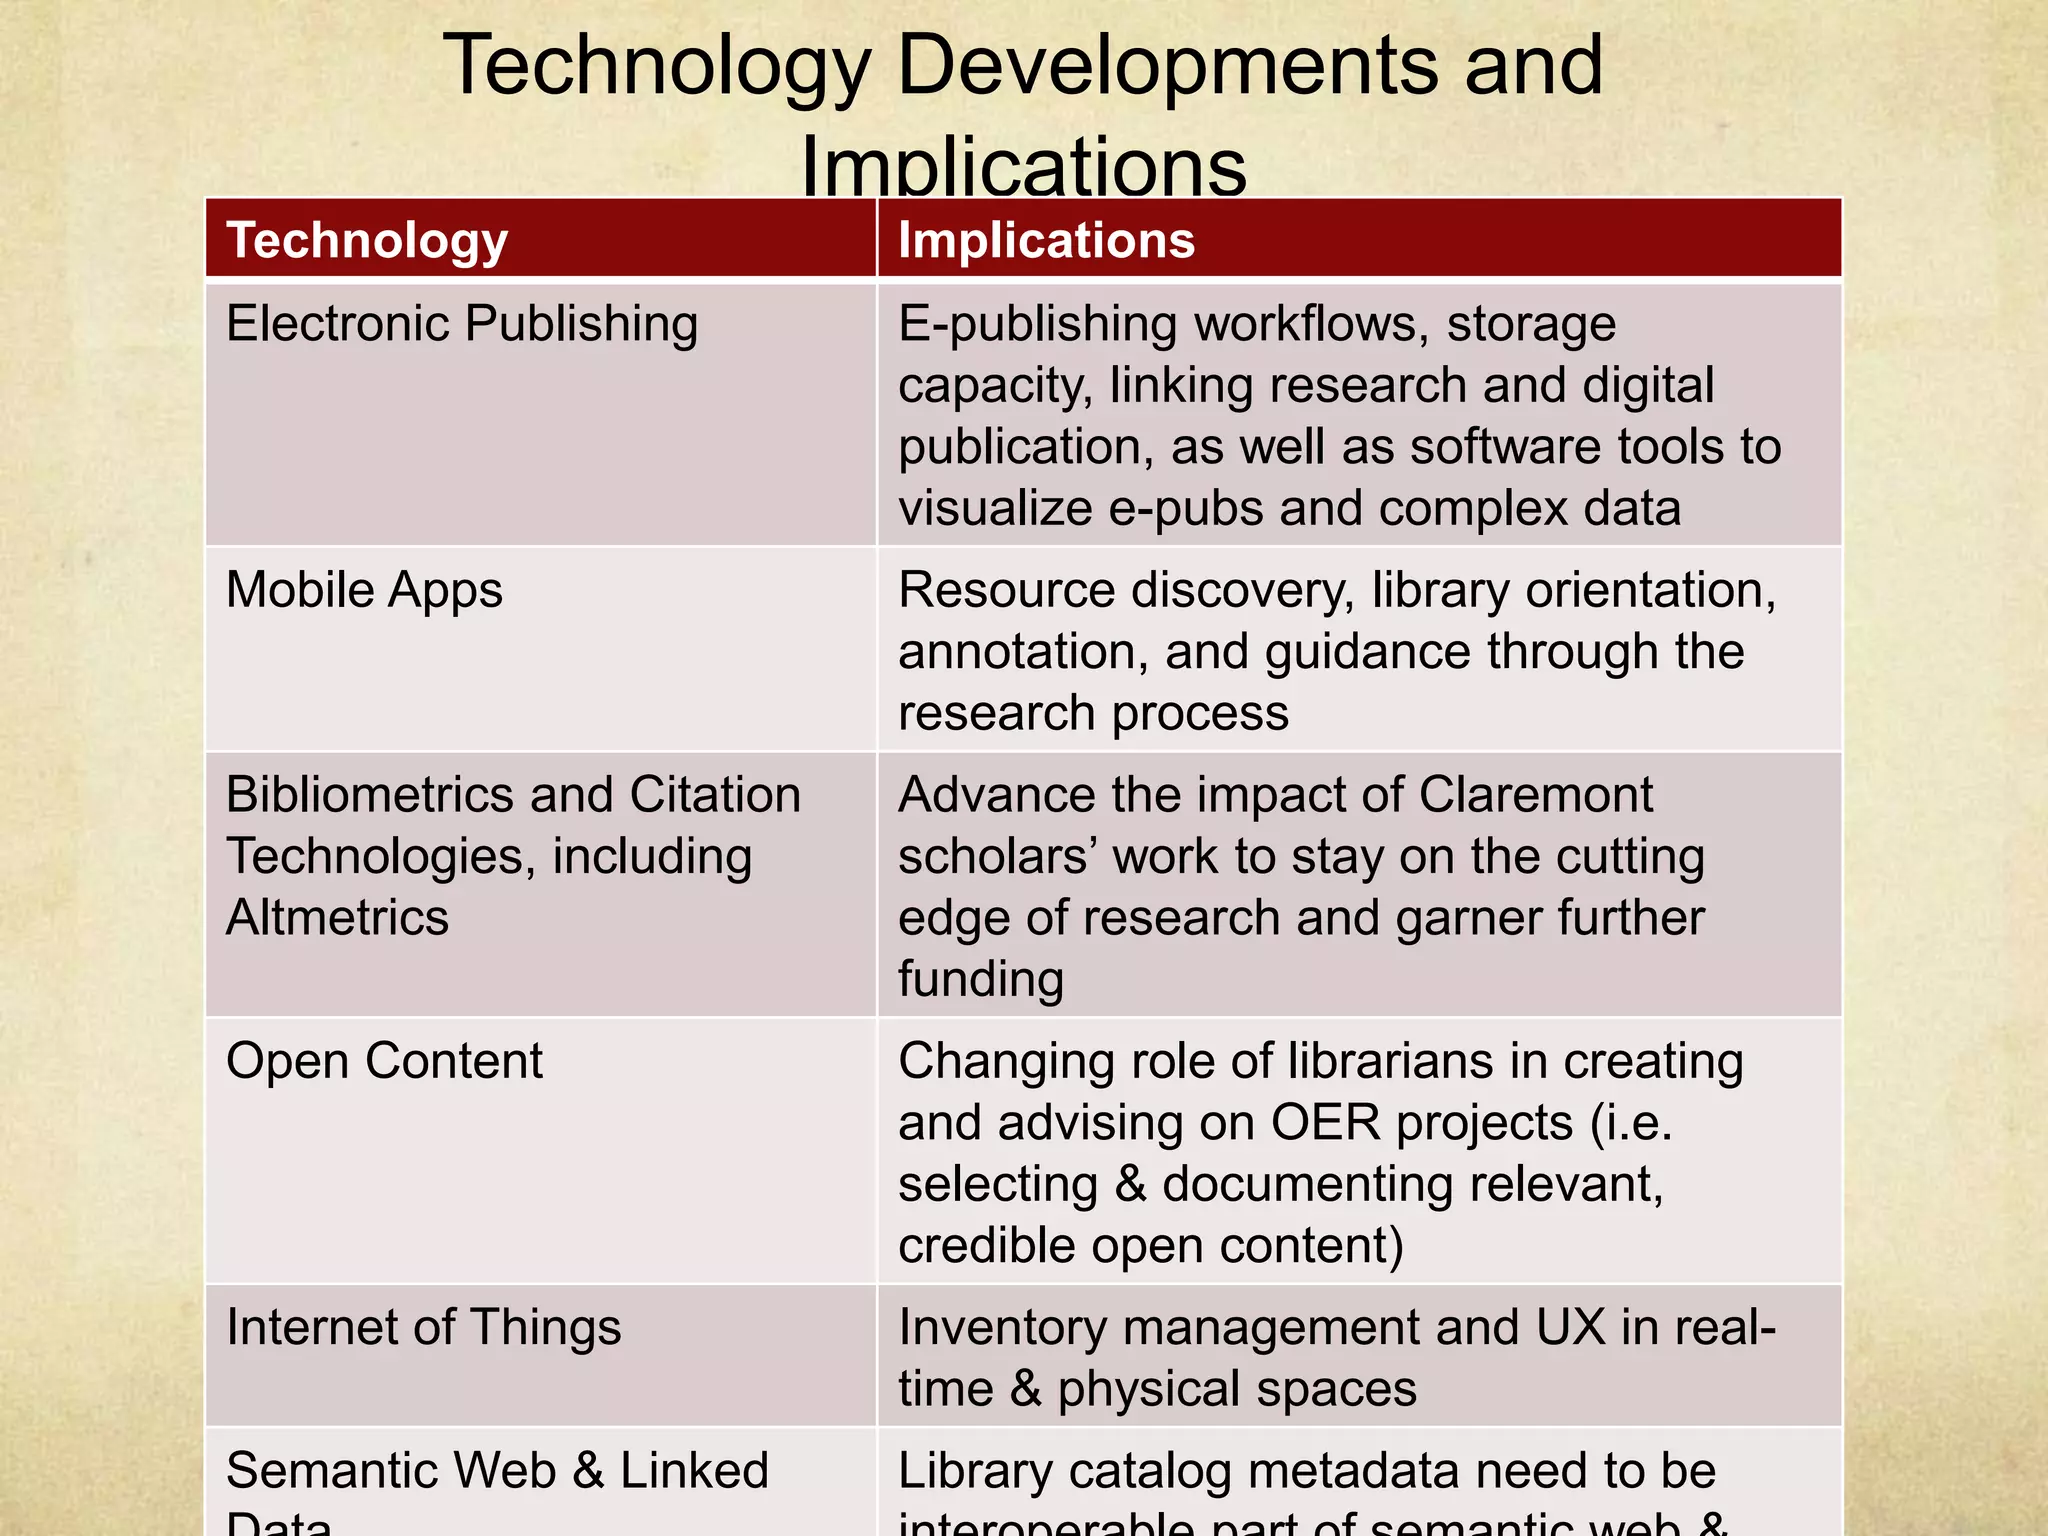

The document outlines current and future trends in digital scholarly communication at Claremont Colleges, highlighting fast, mid-range, and long-range trends in research data management, accessibility, and technological advancements. It discusses proposed strategies such as improved access to research databases, incorporation of various media, and new forms of scholarly publication to enhance the overall communication and effectiveness of scholarship. Additionally, it emphasizes the importance of adapting library services to meet evolving user needs and staying abreast of technology changes in academia.


