
Download to read offline


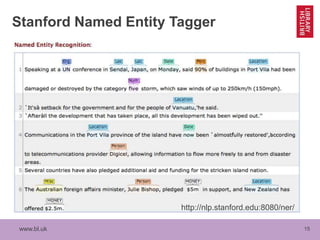
![www.bl.uk 7
“The real origin of that term [digital humanities] was in conversation
with Andrew McNeillie, the original acquiring editor for the Blackwell
Companion to Digital Humanities. We started talking with him about that
book project in 2001, in April, and by the end of November we’d lined up
contributors and were discussing the title, for the contract. Ray
[Siemens] wanted “A Companion to Humanities Computing” as that was
the term commonly used at that point; the editorial and marketing folks
at Blackwell wanted “Companion to Digitized Humanities.” I suggested
“Companion to Digital Humanities” to shift the emphasis away from
simple digitization.”
-John Unsworth, founding director of the
Institute for Advanced Technology in the Humanities
at the University of Virginia and author of
Blackwell Companion to Digital Humanities
The origin story, part II](https://image.slidesharecdn.com/201802dh101ahrccpdnmcgv3-180221170440/85/AHRC-CDP-Digital-Humanities-101-7-320.jpg)


![www.bl.uk 32
• Cultural heritage records contain uncertainty and fuzziness (e.g. date ranges, multiple
values, uncertain or unavailable information)—Curators and staff at institutions often
have unique expertise in deciphering these anomalies-ask them! ( [1960] vs.1960 can
have a big impact depending on what you’re doing)
• Optical Character Recognition in particular is an imperfect art-need to consider how
bad it is, how this might effect your findings, and what needs doing to mitigate it.
• Keeping data clean, organised, open and described well will not only make your life
easier, but enable its widespread re-use beyond the life of your PhD and increase
future impact. (Datasets you’ve created in the course of your research projects could
even be used to enhance national collections!)
• Decisions always need to be made while normalising information for visualisation.
Documenting them is important for your research but also future re-use!
• Is your aim enquiry or presentation? All of this will have an impact on the tools and
data cleaning choices you make.
Things to consider: Data + Tools](https://image.slidesharecdn.com/201802dh101ahrccpdnmcgv3-180221170440/85/AHRC-CDP-Digital-Humanities-101-32-320.jpg)

The document discusses the Digital Humanities (DH), highlighting its interdisciplinary nature and its integration of digital technologies with humanities research. It outlines various computational techniques such as text and data mining, machine learning, georeferencing, and data visualization, showcasing their benefits for research efficiency and insight generation. The presentation also illustrates the significance of DH through historical context, examples, and the transformative impact of technology on scholarly activity.


![[DSC Europe 25] Ivan Lukovic & Marija Djukic - From Data to Value: Why Maturi...](https://cdn.slidesharecdn.com/ss_thumbnails/ahrfps8xr6knowwhacxh-1-ivan-marija-dsc-2025-ld-v1-presentation-260115093812-be21adfc-thumbnail.jpg?width=640&height=640&fit=bounds)
![[DSC Europe 25] Slobodan Dolinic - Smart and Intelligent Green Region.pptx](https://cdn.slidesharecdn.com/ss_thumbnails/0bribinjsp6ghwtvsvor-2-sigre-slobodan-dolinic-260115093812-c9c10e90-thumbnail.jpg?width=640&height=640&fit=bounds)


![[DSC Europe 25] Srba Markovic - From Pilot to Production: Overcoming AI Deplo...](https://cdn.slidesharecdn.com/ss_thumbnails/yjjmrtytmwbalxlba7px-4-srba-markovic-from-pilot-to-production-overcoming-ai-deployment-blockers-with-260114111931-4a892d44-thumbnail.jpg?width=640&height=640&fit=bounds)


