SlideShare a Scribd company logo
November 2020 Monthly Snapshot
One-Year Change in One-Year Change in
Median Sales Price
Single Family
Median Sales Price
Condo/TIC/Coop
2
3
4
5
6
7
8
9
10
11
12
13
14
15
16
Current as of December 11, 2020. All data from the San Francisco MLS. Report © 2020 ShowingTime.
Condo/TIC/Coop Activity Overview
Inventory of Active Listings
% of Properties Sold Over List Price
% of List Price Received
Housing Affordability Ratio
All Properties Activity Overview
New Listings
Pending Sales
Sold Listings
Median Sales Price
Average Sales Price
Days on Market Until Sale
Activity by District
Monthly Indicators
+ 5.7% + 1.7% + 3.0%
One-Year Change in
November saw the Dow Jones Industrial Average top 30,000 for the first time,
while mortgage rates reached new record lows again. These new records have
provided encouragement for buyers to move forward on home purchases,
which continued to remain strong overall for the month.
New Listings were up 13.1 percent for single family homes and 1.3 percent for
Condo/TIC/Coop properties. Pending Sales increased 42.1 percent for single
family homes and 24.9 percent for Condo/TIC/Coop properties.
The Median Sales Price was up 5.7 percent to $1,695,000 for single family
homes and 1.7 percent to $1,200,000 for Condo/TIC/Coop properties. Months
Supply of Inventory increased 20.0 percent for single family units and 96.9
percent for Condo/TIC/Coop units.
Showing activity remains higher than the same period a year ago across most
of the country, suggesting that strong buyer demand is likely to continue into
what is typically the slowest time of year. With inventory remaining constrained
in most market segments, sellers continue to benefit from the tight market
conditions.
Median Sales Price
All Property Types
Residential real estate activity in San Francisco County (Districts 1-10)
composed of single-family properties, townhomes and condominiums.
Percent changes are calculated using rounded figures.
Single Family Activity Overview
Months Supply of Inventory
Single Family Activity Overview
Key metrics by report month and for year-to-date (YTD) starting from the first of the year.
Key Metrics Historical Sparkbars 11-2019 11-2020 Percent Change YTD 2019 YTD 2020 Percent Change
+ 10.1%2,812
1,958 - 2.2%
$1,652,500 + 3.0%
+ 2.0%
Pending Sales 190 270 + 42.1% + 1.2%2,070 2,095
New Listings 137 155 + 13.1% 2,554
Sold Listings 200 253 + 26.5% 2,003
Median Sales Price $1,604,000 $1,695,000 + 5.7% $1,605,000
26 + 4.0%
$2,059,850
-- --
Days on Market 24 32 + 33.3% 25
Avg. Sales Price $1,986,456 $2,107,712 + 6.1% $2,018,526
Active Listings 450 545 + 21.1% --
% of Properties Sold Over List Price 77.5% 63.2% - 18.5% 77.6%
33
65.9% - 15.1%
- 4.5%
35 + 6.1%
107.9%% of List Price Received 111.9% 106.3% - 5.0% 113.0%
Current as of December 11, 2020. All data from the San Francisco MLS. Report © 2020 ShowingTime. | 2
Months Supply 2.5 3.0 + 20.0% -- -- --
Affordability Ratio 33 34 + 3.0%
11-2017 11-2018 11-2019 11-2020
11-2017 11-2018 11-2019 11-2020
11-2017 11-2018 11-2019 11-2020
11-2017 11-2018 11-2019 11-2020
11-2017 11-2018 11-2019 11-2020
11-2017 11-2018 11-2019 11-2020
11-2017 11-2018 11-2019 11-2020
11-2017 11-2018 11-2019 11-2020
11-2017 11-2018 11-2019 11-2020
11-2017 11-2018 11-2019 11-2020
11-2017 11-2018 11-2019 11-2020
Condo/TIC/Coop Activity Overview
Key metrics by report month and for year-to-date (YTD) starting from the first of the year.
Key Metrics Historical Sparkbars 11-2019 11-2020 Percent Change YTD 2019 YTD 2020 Percent Change
+ 28.2%
Pending Sales 233 291 + 24.9% 2,722 2,498 - 8.2%
New Listings 160 162 + 1.3% 3,713 4,761
Sold Listings 272 327 + 20.2% 2,638 2,388 - 9.5%
Median Sales Price $1,180,000 $1,200,000 + 1.7% $1,236,500 $1,216,500 - 1.6%
- 1.3%
40 + 17.6%
$1,345,467
-- --
Days on Market 34 49 + 44.1% 34
Avg. Sales Price $1,322,998 $1,301,598 - 1.6% $1,363,192
Active Listings 760 1,394 + 83.4% --
% of Properties Sold Over List Price 64.3% 33.0% - 48.7% 60.7%
50
42.7% - 29.7%
- 4.0%
57 + 14.0%
101.5%% of List Price Received 105.1% 100.2% - 4.7% 105.7%
Current as of December 11, 2020. All data from the San Francisco MLS. Report © 2020 ShowingTime. | 3
Months Supply 3.2 6.3 + 96.9% -- -- --
Affordability Ratio 52 57 + 9.6%
11-2017 11-2018 11-2019 11-2020
11-2017 11-2018 11-2019 11-2020
11-2017 11-2018 11-2019 11-2020
11-2017 11-2018 11-2019 11-2020
11-2017 11-2018 11-2019 11-2020
11-2017 11-2018 11-2019 11-2020
11-2017 11-2018 11-2019 11-2020
11-2017 11-2018 11-2019 11-2020
11-2017 11-2018 11-2019 11-2020
11-2017 11-2018 11-2019 11-2020
11-2017 11-2018 11-2019 11-2020
New Listings
New Listings
Single
Family
Year-Over-Year
Change
Condo/TIC/
Coop
Year-Over-Year
Change
Dec-2019 86 +4.9% 134 +9.8%
Jan-2020 232 +3.1% 372 +3.9%
Feb-2020 247 +30.7% 393 +28.4%
Mar-2020 155 -36.2% 248 -29.5%
Apr-2020 155 -38.5% 213 -43.5%
May-2020 250 -9.1% 496 +34.1%
Jun-2020 317 +35.5% 549 +90.6%
Jul-2020 363 +84.3% 655 +104.0%
Aug-2020 317 +28.3% 615 +86.9%
Sep-2020 318 +2.6% 594 +16.9%
Oct-2020 303 +23.7% 464 +34.9%
Nov-2020 155 +13.1% 162 +1.3%
12-Month Avg 242 +9.9% 408 +27.6%
Historical New Listings by Month
Current as of December 11, 2020. All data from the San Francisco MLS. Report © 2020 ShowingTime. | 4
A count of the properties that have been newly listed on the market in a given month.
159
196
137
160155
162
Single Family Condo/TIC/Coop
November
0
100
200
300
400
500
600
700
1-2005 1-2006 1-2007 1-2008 1-2009 1-2010 1-2011 1-2012 1-2013 1-2014 1-2015 1-2016 1-2017 1-2018 1-2019 1-2020
Single Family Condo/TIC/Coop
2,726
3,777
2,554
3,713
2,812
4,761
Single Family Condo/TIC/Coop
Year to Date
2018 2019 2020
+ 1.3%- 18.4%+ 13.1%- 13.8% - 1.7%+ 10.1%- 6.3% + 28.2%
2018 2019 2020 2018 2019 2020 2018 2019 2020
+ 9.7% + 8.1% + 7.5%- 6.2%
Pending Sales
Pending Sales
Single
Family
Year-Over-Year
Change
Condo/TIC/
Coop
Year-Over-Year
Change
Dec-2019 113 -6.6% 153 +4.1%
Jan-2020 101 +13.5% 155 +28.1%
Feb-2020 133 -7.6% 234 +2.6%
Mar-2020 153 -27.1% 181 -39.5%
Apr-2020 72 -67.6% 89 -71.4%
May-2020 148 -40.3% 138 -58.9%
Jun-2020 198 +2.1% 231 -5.3%
Jul-2020 250 +37.4% 238 +15.0%
Aug-2020 225 +51.0% 314 +48.1%
Sep-2020 254 +30.3% 299 +31.7%
Oct-2020 291 +17.8% 328 +7.9%
Nov-2020 270 +42.1% 291 +24.9%
12-Month Avg 184 +0.8% 221 -7.6%
Historical Pending Sales by Month
Current as of December 11, 2020. All data from the San Francisco MLS. Report © 2020 ShowingTime. | 5
A count of the properties on which offers have been accepted in a given month.
187
222
190
233
270
291
Single Family Condo/TIC/Coop
November
0
100
200
300
400
1-2005 1-2006 1-2007 1-2008 1-2009 1-2010 1-2011 1-2012 1-2013 1-2014 1-2015 1-2016 1-2017 1-2018 1-2019 1-2020
Single Family Condo/TIC/Coop
2,112
2,836
2,070
2,722
2,095
2,498
Single Family Condo/TIC/Coop
Year to Date
2018 2019 2020
+ 24.9%+ 5.0%+ 42.1%+ 1.6% - 4.0%+ 1.2%- 2.0% - 8.2%
2018 2019 2020 2018 2019 2020 2018 2019 2020
- 5.6% - 2.0% + 4.8%- 5.1%
Sold Listings
Sold Listings
Single
Family
Year-Over-Year
Change
Condo/TIC/
Coop
Year-Over-Year
Change
Dec-2019 175 +9.4% 216 +11.3%
Jan-2020 96 -4.0% 150 +31.6%
Feb-2020 115 +1.8% 179 +9.1%
Mar-2020 162 -5.8% 230 -13.2%
Apr-2020 104 -54.0% 114 -64.3%
May-2020 106 -55.6% 109 -67.7%
Jun-2020 166 -12.6% 179 -32.5%
Jul-2020 213 0.0% 260 +6.6%
Aug-2020 217 +29.2% 236 +14.0%
Sep-2020 239 +88.2% 314 +63.5%
Oct-2020 287 +12.5% 290 +12.0%
Nov-2020 253 +26.5% 327 +20.2%
12-Month Avg 178 -1.4% 217 -8.1%
Historical Sold Listings by Month
Current as of December 11, 2020. All data from the San Francisco MLS. Report © 2020 ShowingTime. | 6
A count of the actual sales that closed in a given month.
220
264
200
272
253
327
Single Family Condo/TIC/Coop
November
0
100
200
300
400
1-2005 1-2006 1-2007 1-2008 1-2009 1-2010 1-2011 1-2012 1-2013 1-2014 1-2015 1-2016 1-2017 1-2018 1-2019 1-2020
Single Family Condo/TIC/Coop
2,070
2,825
2,003
2,638
1,958
2,388
Single Family Condo/TIC/Coop
Year to Date
2018 2019 2020
+ 20.2%+ 3.0%+ 26.5%- 9.1% - 6.6%- 2.2%- 3.2% - 9.5%
2018 2019 2020 2018 2019 2020 2018 2019 2020
- 10.2% - 2.3% + 6.8%- 5.0%
Median Sales Price
Median Sales Price
Single
Family
Year-Over-Year
Change
Condo/TIC/
Coop
Year-Over-Year
Change
Dec-2019 $1,450,000 -2.8% $1,198,283 +2.4%
Jan-2020 $1,462,500 +5.3% $1,172,000 +12.7%
Feb-2020 $1,610,000 +7.3% $1,300,000 +15.0%
Mar-2020 $1,650,000 0.0% $1,261,000 +1.3%
Apr-2020 $1,687,000 +4.6% $1,294,000 +5.6%
May-2020 $1,627,500 -3.4% $1,100,222 -11.6%
Jun-2020 $1,802,500 +3.0% $1,200,000 -7.6%
Jul-2020 $1,660,000 +5.3% $1,268,200 +3.7%
Aug-2020 $1,656,000 +3.3% $1,244,500 -2.9%
Sep-2020 $1,650,000 +7.8% $1,202,500 -9.2%
Oct-2020 $1,625,555 -1.5% $1,156,250 -12.7%
Nov-2020 $1,695,000 +5.7% $1,200,000 +1.7%
12-Month Avg* $1,648,800 +3.1% $1,210,000 -1.5%
Historical Median Sales Price by Month
* Median Sales Price for all properties from December 2019 through November 2020. This is not
the average of the individual figures above.
Current as of December 11, 2020. All data from the San Francisco MLS. Report © 2020 ShowingTime. | 7
Point at which half of the sales sold for more and half sold for less, not accounting for seller concessions, in a given month.
$1,427,500
$1,193,625
$1,604,000
$1,180,000
$1,695,000
$1,200,000
Single Family Condo/TIC/Coop
November
$500,000
$750,000
$1,000,000
$1,250,000
$1,500,000
$1,750,000
$2,000,000
1-2005 1-2006 1-2007 1-2008 1-2009 1-2010 1-2011 1-2012 1-2013 1-2014 1-2015 1-2016 1-2017 1-2018 1-2019 1-2020
Single Family Condo/TIC/Coop
$1,600,000
$1,200,000
$1,605,000
$1,236,500
$1,652,500
$1,216,500
Single Family Condo/TIC/Coop
Year to Date
2018 2019 2020
+ 1.7%- 1.1%+ 5.7%+ 12.4% + 3.0%+ 3.0%+ 0.3% - 1.6%
2018 2019 2020 2018 2019 2020 2018 2019 2020
- 4.5% + 13.5% + 4.3%- 3.5%
Average Sales Price
Avg. Sales Price
Single
Family
Year-Over-Year
Change
Condo/TIC/
Coop
Year-Over-Year
Change
Dec-2019 $1,948,749 +9.1% $1,261,689 -5.1%
Jan-2020 $2,212,609 +26.3% $1,319,209 +12.1%
Feb-2020 $1,953,875 +4.4% $1,404,496 +3.0%
Mar-2020 $2,084,487 +1.9% $1,377,863 +3.2%
Apr-2020 $2,324,543 +4.0% $1,381,974 +1.4%
May-2020 $1,893,729 -11.6% $1,289,927 -3.4%
Jun-2020 $2,282,142 +6.2% $1,412,552 -1.4%
Jul-2020 $2,082,541 +6.3% $1,408,069 +7.4%
Aug-2020 $2,040,201 +9.0% $1,358,295 -2.1%
Sep-2020 $1,928,578 -6.6% $1,329,883 -8.3%
Oct-2020 $1,939,321 +1.4% $1,261,814 -12.8%
Nov-2020 $2,107,712 +6.1% $1,301,598 -1.6%
12-Month Avg* $2,050,735 +2.5% $1,338,518 -1.6%
Historical Average Sales Price by Month
* Avg. Sales Price for all properties from December 2019 through November 2020. This is not the
average of the individual figures above.
Current as of December 11, 2020. All data from the San Francisco MLS. Report © 2020 ShowingTime. | 8
Average sales price for all closed sales, not accounting for seller concessions, in a given month.
$1,864,335
$1,263,347
$1,986,456
$1,322,998
$2,107,712
$1,301,598
Single Family Condo/TIC/Coop
November
$500,000
$1,000,000
$1,500,000
$2,000,000
$2,500,000
1-2005 1-2006 1-2007 1-2008 1-2009 1-2010 1-2011 1-2012 1-2013 1-2014 1-2015 1-2016 1-2017 1-2018 1-2019 1-2020
Single Family Condo/TIC/Coop
$1,974,856
$1,321,217
$2,018,526
$1,363,192
$2,059,850
$1,345,467
Single Family Condo/TIC/Coop
Year to Date
2018 2019 2020
- 1.6%+ 4.7%+ 6.1%+ 6.6% + 3.2%+ 2.0%+ 2.2% - 1.3%
2018 2019 2020 2018 2019 2020 2018 2019 2020
+ 6.2% + 11.7% + 1.8%- 8.9%
Days on Market Until Sale
Days on Market
Single
Family
Year-Over-Year
Change
Condo/TIC/
Coop
Year-Over-Year
Change
Dec-2019 31 -6.1% 49 +11.4%
Jan-2020 38 -2.6% 62 +12.7%
Feb-2020 25 -13.8% 29 -27.5%
Mar-2020 20 -23.1% 27 -22.9%
Apr-2020 21 -19.2% 32 -15.8%
May-2020 24 +9.1% 39 +34.5%
Jun-2020 26 +18.2% 34 +9.7%
Jul-2020 26 +13.0% 37 +12.1%
Aug-2020 24 -4.0% 39 +18.2%
Sep-2020 25 -10.7% 44 +29.4%
Oct-2020 26 +18.2% 41 +46.4%
Nov-2020 32 +33.3% 49 +44.1%
12-Month Avg* 27 +4.0% 41 +16.7%
Historical Days on Market Until Sale by Month
* Days on Market for all properties from December 2019 through November 2020. This is not the
average of the individual figures above.
Current as of December 11, 2020. All data from the San Francisco MLS. Report © 2020 ShowingTime. | 9
Average number of days between when a property is listed and when an offer is accepted in a given month.
26
38
24
34
32
49
Single Family Condo/TIC/Coop
November
0
20
40
60
80
100
120
1-2005 1-2006 1-2007 1-2008 1-2009 1-2010 1-2011 1-2012 1-2013 1-2014 1-2015 1-2016 1-2017 1-2018 1-2019 1-2020
Single Family Condo/TIC/Coop
22
31
25
34
26
40
Single Family Condo/TIC/Coop
Year to Date
2018 2019 2020
+ 44.1%- 10.5%+ 33.3%- 7.7% + 9.7%+ 4.0%+ 13.6% + 17.6%
2018 2019 2020 2018 2019 2020 2018 2019 2020
0.0% - 18.5% - 13.9%+ 8.6%
Inventory of Active Listings
Active Listings
Single
Family
Year-Over-Year
Change
Condo/TIC/
Coop
Year-Over-Year
Change
Dec-2019 339 +3.0% 563 +10.4%
Jan-2020 452 +0.9% 743 +7.5%
Feb-2020 550 +19.3% 845 +17.2%
Mar-2020 502 +6.6% 766 +6.7%
Apr-2020 556 +14.9% 833 +12.9%
May-2020 634 +33.5% 1,114 +51.6%
Jun-2020 703 +42.3% 1,293 +79.6%
Jul-2020 761 +63.3% 1,585 +114.8%
Aug-2020 796 +53.1% 1,707 +123.7%
Sep-2020 793 +32.8% 1,822 +88.2%
Oct-2020 723 +31.5% 1,737 +88.2%
Nov-2020 545 +21.1% 1,394 +83.4%
12-Month Avg* 613 +28.0% 1,200 +60.3%
Historical Inventory of Active Listings by Month
* Active Listings for all properties from December 2019 through November 2020. This is not the
average of the individual figures above.
Current as of December 11, 2020. All data from the San Francisco MLS. Report © 2020 ShowingTime. | 10
The number of properties available for sale in active status at the end of a given month.
464
717
450
760
545
1,394
Single Family Condo/TIC/Coop
November
0
500
1,000
1,500
2,000
1-2005 1-2006 1-2007 1-2008 1-2009 1-2010 1-2011 1-2012 1-2013 1-2014 1-2015 1-2016 1-2017 1-2018 1-2019 1-2020
Single Family Condo/TIC/Coop
2018 2019 2020
+ 83.4%+ 6.0%+ 21.1%- 3.0%
2018 2019 2020
+ 43.2% + 20.1%
% of Properties Sold Over List Price
% of Properties
Sold Over List Price
Single
Family
Year-Over-Year
Change
Condo/TIC/
Coop
Year-Over-Year
Change
Dec-2019 66.3% -2.6% 47.7% +3.9%
Jan-2020 60.4% +0.7% 33.3% -19.2%
Feb-2020 72.2% -7.3% 62.6% +18.1%
Mar-2020 78.4% +7.0% 60.4% +8.2%
Apr-2020 69.2% -6.4% 59.6% +8.0%
May-2020 63.2% -20.9% 42.2% -35.1%
Jun-2020 54.2% -33.2% 33.0% -48.8%
Jul-2020 64.3% -22.2% 45.8% -35.0%
Aug-2020 66.4% -19.1% 35.2% -40.2%
Sep-2020 64.9% -12.3% 35.0% -41.1%
Oct-2020 68.6% -15.1% 43.1% -34.0%
Nov-2020 63.2% -18.5% 33.0% -48.7%
12-Month Avg 65.9% -14.3% 43.1% -27.8%
Historical % of Properties Sold Over List Price by Month
* % of Properties Sold Over List Price for all properties from December 2019 through November
2020. This is not the average of the individual figures above.
Current as of December 11, 2020. All data from the San Francisco MLS. Report © 2020 ShowingTime. | 11
Percentage found when dividing the number of properties sold by properties sold over its original list price, not accounting for seller
concessions.
73.6%
54.5%
77.5%
64.3%63.2%
33.0%
Single Family Condo/TIC/Coop
November
0.0%
20.0%
40.0%
60.0%
80.0%
100.0%
1-2005 1-2006 1-2007 1-2008 1-2009 1-2010 1-2011 1-2012 1-2013 1-2014 1-2015 1-2016 1-2017 1-2018 1-2019 1-2020
Single Family Condo/TIC/Coop
80.9%
61.5%
77.6%
60.7%
65.9%
42.7%
Single Family Condo/TIC/Coop
Year to Date
2018 2019 2020
- 48.7%+ 18.0%- 18.5%+ 5.3% - 1.3%- 15.1%- 4.1% - 29.7%
2018 2019 2020 2018 2019 2020 2018 2019 2020
- 8.9% + 2.1% + 3.5%- 6.5%
% of List Price Received
% of List Price
Received
Single
Family
Year-Over-Year
Change
Condo/TIC/
Coop
Year-Over-Year
Change
Dec-2019 109.7% -0.7% 103.1% +1.0%
Jan-2020 107.1% +1.0% 100.4% -0.6%
Feb-2020 111.9% -0.6% 105.2% +1.0%
Mar-2020 114.5% +3.6% 104.3% -0.4%
Apr-2020 109.0% -3.0% 105.5% +0.6%
May-2020 106.1% -6.3% 100.6% -6.3%
Jun-2020 105.4% -8.6% 100.1% -6.6%
Jul-2020 106.4% -7.8% 101.2% -5.9%
Aug-2020 107.6% -6.7% 100.4% -5.1%
Sep-2020 107.1% -4.7% 100.3% -4.7%
Oct-2020 108.3% -5.0% 101.3% -4.3%
Nov-2020 106.3% -5.0% 100.2% -4.7%
12-Month Avg* 108.1% -4.2% 101.7% -3.6%
Historical % of List Price Received by Month
* % of List Price Received for all properties from December 2019 through November 2020. This is
not the average of the individual figures above.
Current as of December 11, 2020. All data from the San Francisco MLS. Report © 2020 ShowingTime. | 12
Percentage found when dividing a property’s sales price by its most recent list price, then taking the average for all properties sold in a given
month, not accounting for seller concessions.
111.2%
104.1%
111.9%
105.1%106.3%
100.2%
Single Family Condo/TIC/Coop
November
116.3%
106.6%
113.0%
105.7%107.9%
101.5%
Single Family Condo/TIC/Coop
Year to Date
90.0%
100.0%
110.0%
120.0%
130.0%
1-2005 1-2006 1-2007 1-2008 1-2009 1-2010 1-2011 1-2012 1-2013 1-2014 1-2015 1-2016 1-2017 1-2018 1-2019 1-2020
Single Family Condo/TIC/Coop
2018 2019 2020
- 4.7%+ 1.0%- 5.0%+ 0.6%
2018 2019 2020
- 3.7% - 0.4%
2018 2019 2020
- 4.0%- 0.8%- 4.5%- 2.8%
2018 2019 2020
+ 1.0% + 1.4%
Housing Affordability Ratio
Affordability Ratio
Single
Family
Year-Over-Year
Change
Condo/TIC/
Coop
Year-Over-Year
Change
Dec-2019 36 +9.1% 51 +6.3%
Jan-2020 37 +5.7% 54 0.0%
Feb-2020 34 +3.0% 49 -3.9%
Mar-2020 32 +6.7% 49 +4.3%
Apr-2020 33 +6.5% 50 +4.2%
May-2020 34 +13.3% 58 +23.4%
Jun-2020 31 +6.9% 55 +22.2%
Jul-2020 34 +3.0% 53 +8.2%
Aug-2020 34 0.0% 54 +10.2%
Sep-2020 35 0.0% 56 +19.1%
Oct-2020 35 +6.1% 59 +22.9%
Nov-2020 34 +3.0% 57 +9.6%
12-Month Avg* 34 +5.4% 32 +16.9%
Historical Housing Affordability Ratio by Month
* Affordability Ratio for all properties from December 2019 through November 2020. This is not
the average of the individual figures above.
Current as of December 11, 2020. All data from the San Francisco MLS. Report © 2020 ShowingTime. | 13
This index measures housing affordability for the region. For example, an index of 120 means the median household income is 120% of what is
necessary to qualify for the median-priced home under prevailing interest rates. A higher number means greater affordability.
32
43
33
52
34
57
Single Family Condo/TIC/Coop
November
20
40
60
80
100
1-2005 1-2006 1-2007 1-2008 1-2009 1-2010 1-2011 1-2012 1-2013 1-2014 1-2015 1-2016 1-2017 1-2018 1-2019 1-2020
Single Family Condo/TIC/Coop
2018 2019 2020
+ 9.6%+ 20.9%+ 3.0%+ 3.1%
2018 2019 2020
- 8.6% - 12.2%
28
43
33
50
35
57
Single Family Condo/TIC/Coop
Year to Date
2018 2019 2020
+ 14.0%+ 16.3%+ 6.1%+ 17.9%
2018 2019 2020
- 24.3% - 17.3%
Months Supply of Inventory
Months Supply
Single
Family
Year-Over-Year
Change
Condo/TIC/
Coop
Year-Over-Year
Change
Dec-2019 1.9 +5.6% 2.3 +9.5%
Jan-2020 2.5 +4.2% 3.1 +10.7%
Feb-2020 3.0 +20.0% 3.5 +16.7%
Mar-2020 2.8 +7.7% 3.3 +10.0%
Apr-2020 3.4 +30.8% 3.9 +30.0%
May-2020 4.1 +57.7% 5.6 +86.7%
Jun-2020 4.5 +66.7% 6.6 +120.0%
Jul-2020 4.7 +88.0% 7.9 +154.8%
Aug-2020 4.7 +67.9% 8.2 +156.3%
Sep-2020 4.6 +39.4% 8.5 +107.3%
Oct-2020 4.1 +36.7% 8.0 +105.1%
Nov-2020 3.0 +20.0% 6.3 +96.9%
12-Month Avg* 3.6 +38.0% 5.6 +80.3%
Historical Months Supply of Inventory by Month
* Months Supply for all properties from December 2019 through November 2020. This is not the
average of the individual figures above.
Current as of December 11, 2020. All data from the San Francisco MLS. Report © 2020 ShowingTime. | 14
The inventory of homes for sale at the end of a given month, divided by the average monthly pending sales from the last 12 months.
2.5
2.8
2.5
3.23.0
6.3
Single Family Condo/TIC/Coop
November
0.0
2.0
4.0
6.0
8.0
10.0
1-2005 1-2006 1-2007 1-2008 1-2009 1-2010 1-2011 1-2012 1-2013 1-2014 1-2015 1-2016 1-2017 1-2018 1-2019 1-2020
Single Family Condo/TIC/Coop
2018 2019 2020
+ 96.9%+ 14.3%+ 20.0%0.0%
2018 2019 2020
+ 47.1% + 12.0%
All Properties Activity Overview
Key metrics by report month and for year-to-date (YTD) starting from the first of the year.
Key Metrics Historical Sparkbars 11-2019 11-2020 Percent Change YTD 2019 YTD 2020 Percent Change
+ 20.8%
Pending Sales 423 561 + 32.6% 4,792 4,593 - 4.2%
New Listings 297 317 + 6.7% 6,267 7,573
Sold Listings 472 580 + 22.9% 4,641 4,346 - 6.4%
Median Sales Price $1,359,000 $1,400,000 + 3.0% $1,385,000 $1,420,000 + 2.5%
+ 1.3%
34 + 13.3%
$1,667,318
-- --
Days on Market 30 41 + 36.7% 30
Avg. Sales Price $1,604,125 $1,653,230 + 3.1% $1,646,026
Active Listings 1,210 1,939 + 60.2% --
% of Properties Sold Over List Price 69.9% 46.2% - 33.9% 68.0%
38
53.1% - 21.9%
- 4.0%
42 + 10.5%
104.4%% of List Price Received 108.0% 102.9% - 4.7% 108.8%
Current as of December 11, 2020. All data from the San Francisco MLS. Report © 2020 ShowingTime. | 15
Months Supply 2.9 4.8 + 65.5% -- -- --
Affordability Ratio 39 42 + 7.7%
11-2017 11-2018 11-2019 11-2020
11-2017 11-2018 11-2019 11-2020
11-2017 11-2018 11-2019 11-2020
11-2017 11-2018 11-2019 11-2020
11-2017 11-2018 11-2019 11-2020
11-2017 11-2018 11-2019 11-2020
11-2017 11-2018 11-2019 11-2020
11-2017 11-2018 11-2019 11-2020
11-2017 11-2018 11-2019 11-2020
11-2017 11-2018 11-2019 11-2020
11-2017 11-2018 11-2019 11-2020
Activity by District
SF District 1: Northwest (Sea Cliff, Lake, Jordan Park / Laurel Heights, Outer Richmond, Central Richmond, Inner Richmond, Lone Mountain)
SF District 2: Central West (Outer Sunset, Central Sunset, Inner Sunset, Outer Parkside, Parkside, Inner Parkside, Golden Gate Heights)
SF District 3: Southwest (Pine Lake Park, Lake Shore, Merced Manor, Stonestown, Lakeside, Merced Heights, Ingleside, Ingleside Heights, Oceanview)
SF District 4: Twin Peaks W (Forest Hill (& Ext), W Portal, St Francis Wd, Balboa Terr, Mt Dav Manor, Ingleside Terr, Monterey Hts, Wstwd Pk & H'lnds, Shrwd Fst, Miraloma Pk, Dmnd Hts, Mdtwn Terr)
SF District 5: Central (Haight Ashbury, Cole Vly / Prnssus Hts, Clarndn Hts, Corona Hts, Twin Pks, Glen Pk, Noe Vly, Eureka Vly / Dolores Hts, Mission Dolores, Duboce Trngl, Buena Vista / Ashbury Hts)
SF District 6: Central North (Lower Pacific Heights, Anza Vista, Western Addition, North Panhandle, Alamo Square, Hayes Valley)
SF District 7: North (Marina, Cow Hollow, Presidio Heights, Pacific Heights)
SF District 8: Northeast (North Waterfront, North Beach, Russian Hill, Telegraph Hill, Nob Hill, Financial District / Barbary Coast, Downtown, Van Ness / Civic Center, Tenderloin)
SF District 9: Central East (Yerba Buena, South Beach, South of Market, Mission Bay, Inner Mission, Potrero Hill, Central Waterfront / Dogpatch, Bernal Heights)
SF District 10: Southeast (Outer Mission, Mission Terr, Excelsior, Portola, Bayview, Silver Terr, Hunters Pt, Candlestick Pt, Bayview Hts, Little Hollywood, Visitation Vly, Crocker Amazon)
11-2019 11-2020 + / – 11-2019 11-2020 + / – 11-2019 11-2020 + / – 11-2019 11-2020 + / – 11-2019 11-2020 + / –
Single Family
1 SF District 1 39 31 -20.5% 18 24 +33.3% $1,812,500 $2,212,500 +22.1% 18 26 +44.4% 2.5 1.7 -32.0%
2 SF District 2 47 52 +10.6% 41 43 +4.9% $1,401,000 $1,569,000 +12.0% 18 20 +11.1% 1.4 1.6 +14.3%
3 SF District 3 22 31 +40.9% 13 10 -23.1% $1,160,000 $1,437,500 +23.9% 34 29 -14.7% 1.8 2.7 +50.0%
4 SF District 4 42 46 +9.5% 27 48 +77.8% $1,510,000 $1,700,000 +12.6% 25 26 +4.0% 1.7 1.8 +5.9%
5 SF District 5 78 95 +21.8% 30 41 +36.7% $2,275,000 $2,500,000 +9.9% 28 36 +28.6% 2.8 3.3 +17.9%
6 SF District 6 24 17 -29.2% 3 2 -33.3% $3,210,000 $2,275,000 -29.1% 47 32 -31.9% 7.2 3.8 -47.2%
7 SF District 7 38 52 +36.8% 10 9 -10.0% $5,150,000 $4,900,000 -4.9% 34 51 +50.0% 4.4 7.1 +61.4%
8 SF District 8 24 23 -4.2% 3 3 0.0% $2,175,000 $1,818,000 -16.4% 23 37 +60.9% 10.7 12.2 +14.0%
9 SF District 9 59 90 +52.5% 24 30 +25.0% $1,815,000 $1,710,000 -5.8% 23 50 +117.4% 3.1 4.3 +38.7%
10 SF District 10 77 108 +40.3% 31 43 +38.7% $1,130,000 $999,990 -11.5% 21 34 +61.9% 2.1 3.3 +57.1%
Condo/TIC/Coop
1 SF District 1 41 45 +9.8% 15 24 +60.0% $1,495,000 $1,487,500 -0.5% 35 31 -11.4% 3.1 3.2 +3.2%
2 SF District 2 10 21 +110.0% 6 6 0.0% $995,000 $1,361,250 +36.8% 27 31 +14.8% 2.5 4.4 +76.0%
3 SF District 3 6 13 +116.7% 6 5 -16.7% $1,006,500 $1,160,000 +15.3% 41 72 +75.6% 1.6 4.9 +206.3%
4 SF District 4 17 19 +11.8% 8 12 +50.0% $844,000 $813,000 -3.7% 48 54 +12.5% 3.0 4.0 +33.3%
5 SF District 5 100 153 +53.0% 48 57 +18.8% $1,350,000 $1,257,000 -6.9% 24 38 +58.3% 2.8 4.0 +42.9%
6 SF District 6 40 107 +167.5% 28 49 +75.0% $1,088,944 $1,206,000 +10.7% 30 38 +26.7% 1.8 4.4 +144.4%
7 SF District 7 72 134 +86.1% 30 42 +40.0% $1,300,000 $1,615,000 +24.2% 29 47 +62.1% 2.7 5.1 +88.9%
8 SF District 8 165 281 +70.3% 36 41 +13.9% $1,042,100 $1,030,000 -1.2% 39 60 +53.8% 4.2 8.5 +102.4%
9 SF District 9 279 568 +103.6% 90 89 -1.1% $1,187,500 $1,020,000 -14.1% 38 61 +60.5% 3.3 8.3 +151.5%
10 SF District 10 30 53 +76.7% 5 2 -60.0% $509,000 $920,000 +80.7% 32 54 +68.8% 5.1 11.0 +115.7%
Key metrics by report month for the districts of San Fransisco.
Current as of December 11, 2020. All data from the San Francisco MLS. Report © 2020 ShowingTime. | 16
Active Listings Sold Listings Median Sales Price Days on Market Months Supply

More Related Content

What's hot

San Francisco Market Report March 2021
San Francisco Market Report March 2021San Francisco Market Report March 2021
San Francisco Market Report March 2021
Ronny Budiutama
 
San Francisco market report August 2020
San Francisco market report August 2020San Francisco market report August 2020
San Francisco market report August 2020
Ronny Budiutama
 
San Francisco Market Report February 2021
San Francisco Market Report February 2021San Francisco Market Report February 2021
San Francisco Market Report February 2021
Ronny Budiutama
 
San Francisco market report June 2020
San Francisco market report June 2020San Francisco market report June 2020
San Francisco market report June 2020
Ronny Budiutama
 
San Francisco Market Report May 2021
San Francisco Market Report May 2021San Francisco Market Report May 2021
San Francisco Market Report May 2021
Ronny Budiutama
 
San Francisco Market Focus Report December 2018
San Francisco Market Focus Report December 2018San Francisco Market Focus Report December 2018
San Francisco Market Focus Report December 2018
Ronny Budiutama
 
San Francisco Market Report June 2021
San Francisco Market Report June 2021San Francisco Market Report June 2021
San Francisco Market Report June 2021
Ronny Budiutama
 
San Francisco Market Report April 2021
San Francisco Market Report April 2021San Francisco Market Report April 2021
San Francisco Market Report April 2021
Ronny Budiutama
 
San Francisco market report July 2020
San Francisco market report July 2020San Francisco market report July 2020
San Francisco market report July 2020
Ronny Budiutama
 
San Francisco market focus report June 2018
San Francisco market focus report June 2018San Francisco market focus report June 2018
San Francisco market focus report June 2018
Ronny Budiutama
 
San Francisco Market Report for March 2020
San Francisco Market Report for March 2020San Francisco Market Report for March 2020
San Francisco Market Report for March 2020
Ronny Budiutama
 
San Francisco Market Focus Report Feb 2020
San Francisco Market Focus Report Feb 2020San Francisco Market Focus Report Feb 2020
San Francisco Market Focus Report Feb 2020
Ronny Budiutama
 
San Francisco Market Report October 2021
San Francisco Market Report October 2021San Francisco Market Report October 2021
San Francisco Market Report October 2021
Ronny Budiutama
 
San Francisco Market Focus Report October 2018
San Francisco Market Focus Report October 2018San Francisco Market Focus Report October 2018
San Francisco Market Focus Report October 2018
Ronny Budiutama
 
San Francisco Market Focus April 2018
San Francisco Market Focus April 2018San Francisco Market Focus April 2018
San Francisco Market Focus April 2018
Ronny Budiutama
 
San Francisco market report April 2020
San Francisco market report April 2020San Francisco market report April 2020
San Francisco market report April 2020
Ronny Budiutama
 
San Francisco Market Focus May 2014
San Francisco Market Focus May 2014San Francisco Market Focus May 2014
San Francisco Market Focus May 2014
Ronny Budiutama
 
San Francisco Market Report November 2021
San Francisco Market Report November 2021San Francisco Market Report November 2021
San Francisco Market Report November 2021
Ronny Budiutama
 
San Francisco Market Focus Report May
San Francisco Market Focus Report MaySan Francisco Market Focus Report May
San Francisco Market Focus Report May
Ronny Budiutama
 
San Francisco Market Report January 2021
San Francisco Market Report January 2021San Francisco Market Report January 2021
San Francisco Market Report January 2021
Ronny Budiutama
 

What's hot (20)

San Francisco Market Report March 2021
San Francisco Market Report March 2021San Francisco Market Report March 2021
San Francisco Market Report March 2021
 
San Francisco market report August 2020
San Francisco market report August 2020San Francisco market report August 2020
San Francisco market report August 2020
 
San Francisco Market Report February 2021
San Francisco Market Report February 2021San Francisco Market Report February 2021
San Francisco Market Report February 2021
 
San Francisco market report June 2020
San Francisco market report June 2020San Francisco market report June 2020
San Francisco market report June 2020
 
San Francisco Market Report May 2021
San Francisco Market Report May 2021San Francisco Market Report May 2021
San Francisco Market Report May 2021
 
San Francisco Market Focus Report December 2018
San Francisco Market Focus Report December 2018San Francisco Market Focus Report December 2018
San Francisco Market Focus Report December 2018
 
San Francisco Market Report June 2021
San Francisco Market Report June 2021San Francisco Market Report June 2021
San Francisco Market Report June 2021
 
San Francisco Market Report April 2021
San Francisco Market Report April 2021San Francisco Market Report April 2021
San Francisco Market Report April 2021
 
San Francisco market report July 2020
San Francisco market report July 2020San Francisco market report July 2020
San Francisco market report July 2020
 
San Francisco market focus report June 2018
San Francisco market focus report June 2018San Francisco market focus report June 2018
San Francisco market focus report June 2018
 
San Francisco Market Report for March 2020
San Francisco Market Report for March 2020San Francisco Market Report for March 2020
San Francisco Market Report for March 2020
 
San Francisco Market Focus Report Feb 2020
San Francisco Market Focus Report Feb 2020San Francisco Market Focus Report Feb 2020
San Francisco Market Focus Report Feb 2020
 
San Francisco Market Report October 2021
San Francisco Market Report October 2021San Francisco Market Report October 2021
San Francisco Market Report October 2021
 
San Francisco Market Focus Report October 2018
San Francisco Market Focus Report October 2018San Francisco Market Focus Report October 2018
San Francisco Market Focus Report October 2018
 
San Francisco Market Focus April 2018
San Francisco Market Focus April 2018San Francisco Market Focus April 2018
San Francisco Market Focus April 2018
 
San Francisco market report April 2020
San Francisco market report April 2020San Francisco market report April 2020
San Francisco market report April 2020
 
San Francisco Market Focus May 2014
San Francisco Market Focus May 2014San Francisco Market Focus May 2014
San Francisco Market Focus May 2014
 
San Francisco Market Report November 2021
San Francisco Market Report November 2021San Francisco Market Report November 2021
San Francisco Market Report November 2021
 
San Francisco Market Focus Report May
San Francisco Market Focus Report MaySan Francisco Market Focus Report May
San Francisco Market Focus Report May
 
San Francisco Market Report January 2021
San Francisco Market Report January 2021San Francisco Market Report January 2021
San Francisco Market Report January 2021
 

Similar to San Francisco Market Focus Report Nov 2020

San Francisco market report May 2020
San Francisco market report May 2020San Francisco market report May 2020
San Francisco market report May 2020
Ronny Budiutama
 
San Francisco Market Focus May 2013
San Francisco Market Focus May 2013San Francisco Market Focus May 2013
San Francisco Market Focus May 2013
Ronny Budiutama
 
San Francisco Market Report October 2022.pdf
San Francisco Market Report October 2022.pdfSan Francisco Market Report October 2022.pdf
San Francisco Market Report October 2022.pdf
Ronny Budiutama
 
San Francisco Market Focus August 2013
San Francisco Market Focus August 2013San Francisco Market Focus August 2013
San Francisco Market Focus August 2013
Ronny Budiutama
 
San Francisco Market Focus April 2017
San Francisco Market Focus April 2017San Francisco Market Focus April 2017
San Francisco Market Focus April 2017
Ronny Budiutama
 
San Francisco Market Report March 2022
San Francisco Market Report March 2022San Francisco Market Report March 2022
San Francisco Market Report March 2022
Ronny Budiutama
 
San Francisco Market Focus Report May 2019
San Francisco Market Focus Report May 2019San Francisco Market Focus Report May 2019
San Francisco Market Focus Report May 2019
Ronny Budiutama
 
San Francisco Market Focus October 2014
San Francisco Market Focus October 2014San Francisco Market Focus October 2014
San Francisco Market Focus October 2014
Ronny Budiutama
 
San Francisco Market Focus Report July
San Francisco Market Focus Report JulySan Francisco Market Focus Report July
San Francisco Market Focus Report July
Ronny Budiutama
 
San Francisco Market Focus Report Feb 2019
San Francisco Market Focus Report Feb 2019San Francisco Market Focus Report Feb 2019
San Francisco Market Focus Report Feb 2019
Ronny Budiutama
 
San Francisco Market Focus June 2015
San Francisco Market Focus June 2015San Francisco Market Focus June 2015
San Francisco Market Focus June 2015
Ronny Budiutama
 
San Francisco Market Focus Report April 2019
San Francisco Market Focus Report April 2019San Francisco Market Focus Report April 2019
San Francisco Market Focus Report April 2019
Ronny Budiutama
 
San Francisco Market Focus July 2013
San Francisco Market Focus July 2013San Francisco Market Focus July 2013
San Francisco Market Focus July 2013
Ronny Budiutama
 
San Francisco Real Estate Housing Market December 2016
San Francisco Real Estate Housing Market December 2016San Francisco Real Estate Housing Market December 2016
San Francisco Real Estate Housing Market December 2016
Ronny Budiutama
 

Similar to San Francisco Market Focus Report Nov 2020 (14)

San Francisco market report May 2020
San Francisco market report May 2020San Francisco market report May 2020
San Francisco market report May 2020
 
San Francisco Market Focus May 2013
San Francisco Market Focus May 2013San Francisco Market Focus May 2013
San Francisco Market Focus May 2013
 
San Francisco Market Report October 2022.pdf
San Francisco Market Report October 2022.pdfSan Francisco Market Report October 2022.pdf
San Francisco Market Report October 2022.pdf
 
San Francisco Market Focus August 2013
San Francisco Market Focus August 2013San Francisco Market Focus August 2013
San Francisco Market Focus August 2013
 
San Francisco Market Focus April 2017
San Francisco Market Focus April 2017San Francisco Market Focus April 2017
San Francisco Market Focus April 2017
 
San Francisco Market Report March 2022
San Francisco Market Report March 2022San Francisco Market Report March 2022
San Francisco Market Report March 2022
 
San Francisco Market Focus Report May 2019
San Francisco Market Focus Report May 2019San Francisco Market Focus Report May 2019
San Francisco Market Focus Report May 2019
 
San Francisco Market Focus October 2014
San Francisco Market Focus October 2014San Francisco Market Focus October 2014
San Francisco Market Focus October 2014
 
San Francisco Market Focus Report July
San Francisco Market Focus Report JulySan Francisco Market Focus Report July
San Francisco Market Focus Report July
 
San Francisco Market Focus Report Feb 2019
San Francisco Market Focus Report Feb 2019San Francisco Market Focus Report Feb 2019
San Francisco Market Focus Report Feb 2019
 
San Francisco Market Focus June 2015
San Francisco Market Focus June 2015San Francisco Market Focus June 2015
San Francisco Market Focus June 2015
 
San Francisco Market Focus Report April 2019
San Francisco Market Focus Report April 2019San Francisco Market Focus Report April 2019
San Francisco Market Focus Report April 2019
 
San Francisco Market Focus July 2013
San Francisco Market Focus July 2013San Francisco Market Focus July 2013
San Francisco Market Focus July 2013
 
San Francisco Real Estate Housing Market December 2016
San Francisco Real Estate Housing Market December 2016San Francisco Real Estate Housing Market December 2016
San Francisco Real Estate Housing Market December 2016
 

More from Ronny Budiutama

San Francisco Market Update -February 2024
San Francisco Market Update -February 2024San Francisco Market Update -February 2024
San Francisco Market Update -February 2024
Ronny Budiutama
 
San Francisco Market Update - March 2024
San Francisco Market Update - March 2024San Francisco Market Update - March 2024
San Francisco Market Update - March 2024
Ronny Budiutama
 
San Francisco January 2024 Market Report
San Francisco January 2024 Market ReportSan Francisco January 2024 Market Report
San Francisco January 2024 Market Report
Ronny Budiutama
 
San Francisco December 2023 Market Report
San Francisco December 2023 Market ReportSan Francisco December 2023 Market Report
San Francisco December 2023 Market Report
Ronny Budiutama
 
San Francisco November 2023 Market Report
San Francisco November 2023 Market ReportSan Francisco November 2023 Market Report
San Francisco November 2023 Market Report
Ronny Budiutama
 
2023 Annual San Francisco Housing Market
2023 Annual San Francisco Housing Market2023 Annual San Francisco Housing Market
2023 Annual San Francisco Housing Market
Ronny Budiutama
 
October 2023 Report: San Francisco Real Estate Market Insights
October 2023 Report: San Francisco Real Estate Market InsightsOctober 2023 Report: San Francisco Real Estate Market Insights
October 2023 Report: San Francisco Real Estate Market Insights
Ronny Budiutama
 
CA Weekly MLS Market Data Report - August 2023
CA Weekly MLS Market Data Report - August 2023CA Weekly MLS Market Data Report - August 2023
CA Weekly MLS Market Data Report - August 2023
Ronny Budiutama
 
San Francisco Market Report July 2023.pdf
San Francisco Market Report July 2023.pdfSan Francisco Market Report July 2023.pdf
San Francisco Market Report July 2023.pdf
Ronny Budiutama
 
San Francisco May 2023 Market Report.pdf
San Francisco May 2023 Market Report.pdfSan Francisco May 2023 Market Report.pdf
San Francisco May 2023 Market Report.pdf
Ronny Budiutama
 
San Francisco June 2023 Market Report.pdf
San Francisco June 2023 Market Report.pdfSan Francisco June 2023 Market Report.pdf
San Francisco June 2023 Market Report.pdf
Ronny Budiutama
 
San Francisco Market Report March 2023.pdf
San Francisco Market Report March 2023.pdfSan Francisco Market Report March 2023.pdf
San Francisco Market Report March 2023.pdf
Ronny Budiutama
 
San Francisco Market Report February 2023
San Francisco Market Report February 2023San Francisco Market Report February 2023
San Francisco Market Report February 2023
Ronny Budiutama
 
San Francisco Market Report January 2023.pdf
San Francisco Market Report January 2023.pdfSan Francisco Market Report January 2023.pdf
San Francisco Market Report January 2023.pdf
Ronny Budiutama
 
Annual Report on the San Francisco County Housing Market.pdf
Annual Report on the San Francisco County Housing Market.pdfAnnual Report on the San Francisco County Housing Market.pdf
Annual Report on the San Francisco County Housing Market.pdf
Ronny Budiutama
 
San Francisco Market Report December 2022.pdf
San Francisco Market Report December 2022.pdfSan Francisco Market Report December 2022.pdf
San Francisco Market Report December 2022.pdf
Ronny Budiutama
 
San Francisco Market Report November 2022.pdf
San Francisco Market Report November 2022.pdfSan Francisco Market Report November 2022.pdf
San Francisco Market Report November 2022.pdf
Ronny Budiutama
 
San Francisco Market Report September 2022.pdf
San Francisco Market Report September 2022.pdfSan Francisco Market Report September 2022.pdf
San Francisco Market Report September 2022.pdf
Ronny Budiutama
 
San Francisco Market Report August 2022.pdf
San Francisco Market Report August 2022.pdfSan Francisco Market Report August 2022.pdf
San Francisco Market Report August 2022.pdf
Ronny Budiutama
 
San Francisco Market Report July 2022.pdf
San Francisco Market Report July 2022.pdfSan Francisco Market Report July 2022.pdf
San Francisco Market Report July 2022.pdf
Ronny Budiutama
 

More from Ronny Budiutama (20)

San Francisco Market Update -February 2024
San Francisco Market Update -February 2024San Francisco Market Update -February 2024
San Francisco Market Update -February 2024
 
San Francisco Market Update - March 2024
San Francisco Market Update - March 2024San Francisco Market Update - March 2024
San Francisco Market Update - March 2024
 
San Francisco January 2024 Market Report
San Francisco January 2024 Market ReportSan Francisco January 2024 Market Report
San Francisco January 2024 Market Report
 
San Francisco December 2023 Market Report
San Francisco December 2023 Market ReportSan Francisco December 2023 Market Report
San Francisco December 2023 Market Report
 
San Francisco November 2023 Market Report
San Francisco November 2023 Market ReportSan Francisco November 2023 Market Report
San Francisco November 2023 Market Report
 
2023 Annual San Francisco Housing Market
2023 Annual San Francisco Housing Market2023 Annual San Francisco Housing Market
2023 Annual San Francisco Housing Market
 
October 2023 Report: San Francisco Real Estate Market Insights
October 2023 Report: San Francisco Real Estate Market InsightsOctober 2023 Report: San Francisco Real Estate Market Insights
October 2023 Report: San Francisco Real Estate Market Insights
 
CA Weekly MLS Market Data Report - August 2023
CA Weekly MLS Market Data Report - August 2023CA Weekly MLS Market Data Report - August 2023
CA Weekly MLS Market Data Report - August 2023
 
San Francisco Market Report July 2023.pdf
San Francisco Market Report July 2023.pdfSan Francisco Market Report July 2023.pdf
San Francisco Market Report July 2023.pdf
 
San Francisco May 2023 Market Report.pdf
San Francisco May 2023 Market Report.pdfSan Francisco May 2023 Market Report.pdf
San Francisco May 2023 Market Report.pdf
 
San Francisco June 2023 Market Report.pdf
San Francisco June 2023 Market Report.pdfSan Francisco June 2023 Market Report.pdf
San Francisco June 2023 Market Report.pdf
 
San Francisco Market Report March 2023.pdf
San Francisco Market Report March 2023.pdfSan Francisco Market Report March 2023.pdf
San Francisco Market Report March 2023.pdf
 
San Francisco Market Report February 2023
San Francisco Market Report February 2023San Francisco Market Report February 2023
San Francisco Market Report February 2023
 
San Francisco Market Report January 2023.pdf
San Francisco Market Report January 2023.pdfSan Francisco Market Report January 2023.pdf
San Francisco Market Report January 2023.pdf
 
Annual Report on the San Francisco County Housing Market.pdf
Annual Report on the San Francisco County Housing Market.pdfAnnual Report on the San Francisco County Housing Market.pdf
Annual Report on the San Francisco County Housing Market.pdf
 
San Francisco Market Report December 2022.pdf
San Francisco Market Report December 2022.pdfSan Francisco Market Report December 2022.pdf
San Francisco Market Report December 2022.pdf
 
San Francisco Market Report November 2022.pdf
San Francisco Market Report November 2022.pdfSan Francisco Market Report November 2022.pdf
San Francisco Market Report November 2022.pdf
 
San Francisco Market Report September 2022.pdf
San Francisco Market Report September 2022.pdfSan Francisco Market Report September 2022.pdf
San Francisco Market Report September 2022.pdf
 
San Francisco Market Report August 2022.pdf
San Francisco Market Report August 2022.pdfSan Francisco Market Report August 2022.pdf
San Francisco Market Report August 2022.pdf
 
San Francisco Market Report July 2022.pdf
San Francisco Market Report July 2022.pdfSan Francisco Market Report July 2022.pdf
San Francisco Market Report July 2022.pdf
 

Recently uploaded

Gianluigi Torzi | Managing Director and Head of Capital Markets
Gianluigi Torzi | Managing Director and Head of Capital MarketsGianluigi Torzi | Managing Director and Head of Capital Markets
Gianluigi Torzi | Managing Director and Head of Capital Markets
Gianluigi Torzi
 
Sunrise Infra Properties Company Profile Pradeep.pdf
Sunrise Infra Properties Company Profile Pradeep.pdfSunrise Infra Properties Company Profile Pradeep.pdf
Sunrise Infra Properties Company Profile Pradeep.pdf
babugunda75
 
Office Building for Sale - 2810 City View Drive, Madison, WI
Office Building for Sale - 2810 City View Drive, Madison, WIOffice Building for Sale - 2810 City View Drive, Madison, WI
Office Building for Sale - 2810 City View Drive, Madison, WI
Lee & Associates of Madison, WI
 
Future of andhra pradesh real estate.pdf
Future of andhra pradesh real estate.pdfFuture of andhra pradesh real estate.pdf
Future of andhra pradesh real estate.pdf
narinav14
 
The Slifkin Real Estate Team Listing Presentation
The Slifkin Real Estate Team Listing PresentationThe Slifkin Real Estate Team Listing Presentation
The Slifkin Real Estate Team Listing Presentation
Eric B. Slifkin, PA
 
Listing Turkey - Piyalepasa Istanbul Catalog
Listing Turkey -  Piyalepasa Istanbul CatalogListing Turkey -  Piyalepasa Istanbul Catalog
Listing Turkey - Piyalepasa Istanbul Catalog
Listing Turkey
 
SVN Live 6.17.24 Weekly Property Broadcast
SVN Live 6.17.24 Weekly Property BroadcastSVN Live 6.17.24 Weekly Property Broadcast
SVN Live 6.17.24 Weekly Property Broadcast
SVN International Corp.
 
Stark Builders: Where Quality Meets Craftsmanship!
Stark Builders: Where Quality Meets Craftsmanship!Stark Builders: Where Quality Meets Craftsmanship!
Stark Builders: Where Quality Meets Craftsmanship!
shuilykhatunnil
 
Marbo Medic Real Estate - Belgrade City.pdf
Marbo Medic Real Estate - Belgrade City.pdfMarbo Medic Real Estate - Belgrade City.pdf
Marbo Medic Real Estate - Belgrade City.pdf
IrinaKovacevic4
 
Floople Real Estate Market in the UK - Current Trends and Future Prospects
Floople Real Estate Market in the UK - Current Trends and Future ProspectsFloople Real Estate Market in the UK - Current Trends and Future Prospects
Floople Real Estate Market in the UK - Current Trends and Future Prospects
Floople
 
Expressways of India: A Comprehensive Guide
Expressways of India: A Comprehensive GuideExpressways of India: A Comprehensive Guide
Expressways of India: A Comprehensive Guide
narinav14
 
Selling your home can be easy. Our team helps make it happen.
Selling your home can be easy. Our team helps make it happen.Selling your home can be easy. Our team helps make it happen.
Selling your home can be easy. Our team helps make it happen.
Eric B. Slifkin, PA
 
Why is Revit MEP Outsourcing considered an as good option for construction pr...
Why is Revit MEP Outsourcing considered an as good option for construction pr...Why is Revit MEP Outsourcing considered an as good option for construction pr...
Why is Revit MEP Outsourcing considered an as good option for construction pr...
MarsBIM1
 
GUIA_LEGAL_CHAPTER_11_REAL STATE PROPERTY .pdf
GUIA_LEGAL_CHAPTER_11_REAL STATE PROPERTY .pdfGUIA_LEGAL_CHAPTER_11_REAL STATE PROPERTY .pdf
GUIA_LEGAL_CHAPTER_11_REAL STATE PROPERTY .pdf
ProexportColombia1
 
Living in an UBER World - June '24 Sales Meeting
Living in an UBER World - June '24 Sales MeetingLiving in an UBER World - June '24 Sales Meeting
Living in an UBER World - June '24 Sales Meeting
Tom Blefko
 
Signature Global TITANIUM SPR | 3.5 & 4.5BHK High rise Apartments in Gurgaon
Signature Global TITANIUM SPR  | 3.5 & 4.5BHK High rise Apartments in GurgaonSignature Global TITANIUM SPR  | 3.5 & 4.5BHK High rise Apartments in Gurgaon
Signature Global TITANIUM SPR | 3.5 & 4.5BHK High rise Apartments in Gurgaon
globalsignature2022
 
Anilesh Ahuja Pioneering a Paradigm Shift in Real Estate Success.pptx
Anilesh Ahuja Pioneering a Paradigm Shift in Real Estate Success.pptxAnilesh Ahuja Pioneering a Paradigm Shift in Real Estate Success.pptx
Anilesh Ahuja Pioneering a Paradigm Shift in Real Estate Success.pptx
neilahuja668
 

Recently uploaded (17)

Gianluigi Torzi | Managing Director and Head of Capital Markets
Gianluigi Torzi | Managing Director and Head of Capital MarketsGianluigi Torzi | Managing Director and Head of Capital Markets
Gianluigi Torzi | Managing Director and Head of Capital Markets
 
Sunrise Infra Properties Company Profile Pradeep.pdf
Sunrise Infra Properties Company Profile Pradeep.pdfSunrise Infra Properties Company Profile Pradeep.pdf
Sunrise Infra Properties Company Profile Pradeep.pdf
 
Office Building for Sale - 2810 City View Drive, Madison, WI
Office Building for Sale - 2810 City View Drive, Madison, WIOffice Building for Sale - 2810 City View Drive, Madison, WI
Office Building for Sale - 2810 City View Drive, Madison, WI
 
Future of andhra pradesh real estate.pdf
Future of andhra pradesh real estate.pdfFuture of andhra pradesh real estate.pdf
Future of andhra pradesh real estate.pdf
 
The Slifkin Real Estate Team Listing Presentation
The Slifkin Real Estate Team Listing PresentationThe Slifkin Real Estate Team Listing Presentation
The Slifkin Real Estate Team Listing Presentation
 
Listing Turkey - Piyalepasa Istanbul Catalog
Listing Turkey -  Piyalepasa Istanbul CatalogListing Turkey -  Piyalepasa Istanbul Catalog
Listing Turkey - Piyalepasa Istanbul Catalog
 
SVN Live 6.17.24 Weekly Property Broadcast
SVN Live 6.17.24 Weekly Property BroadcastSVN Live 6.17.24 Weekly Property Broadcast
SVN Live 6.17.24 Weekly Property Broadcast
 
Stark Builders: Where Quality Meets Craftsmanship!
Stark Builders: Where Quality Meets Craftsmanship!Stark Builders: Where Quality Meets Craftsmanship!
Stark Builders: Where Quality Meets Craftsmanship!
 
Marbo Medic Real Estate - Belgrade City.pdf
Marbo Medic Real Estate - Belgrade City.pdfMarbo Medic Real Estate - Belgrade City.pdf
Marbo Medic Real Estate - Belgrade City.pdf
 
Floople Real Estate Market in the UK - Current Trends and Future Prospects
Floople Real Estate Market in the UK - Current Trends and Future ProspectsFloople Real Estate Market in the UK - Current Trends and Future Prospects
Floople Real Estate Market in the UK - Current Trends and Future Prospects
 
Expressways of India: A Comprehensive Guide
Expressways of India: A Comprehensive GuideExpressways of India: A Comprehensive Guide
Expressways of India: A Comprehensive Guide
 
Selling your home can be easy. Our team helps make it happen.
Selling your home can be easy. Our team helps make it happen.Selling your home can be easy. Our team helps make it happen.
Selling your home can be easy. Our team helps make it happen.
 
Why is Revit MEP Outsourcing considered an as good option for construction pr...
Why is Revit MEP Outsourcing considered an as good option for construction pr...Why is Revit MEP Outsourcing considered an as good option for construction pr...
Why is Revit MEP Outsourcing considered an as good option for construction pr...
 
GUIA_LEGAL_CHAPTER_11_REAL STATE PROPERTY .pdf
GUIA_LEGAL_CHAPTER_11_REAL STATE PROPERTY .pdfGUIA_LEGAL_CHAPTER_11_REAL STATE PROPERTY .pdf
GUIA_LEGAL_CHAPTER_11_REAL STATE PROPERTY .pdf
 
Living in an UBER World - June '24 Sales Meeting
Living in an UBER World - June '24 Sales MeetingLiving in an UBER World - June '24 Sales Meeting
Living in an UBER World - June '24 Sales Meeting
 
Signature Global TITANIUM SPR | 3.5 & 4.5BHK High rise Apartments in Gurgaon
Signature Global TITANIUM SPR  | 3.5 & 4.5BHK High rise Apartments in GurgaonSignature Global TITANIUM SPR  | 3.5 & 4.5BHK High rise Apartments in Gurgaon
Signature Global TITANIUM SPR | 3.5 & 4.5BHK High rise Apartments in Gurgaon
 
Anilesh Ahuja Pioneering a Paradigm Shift in Real Estate Success.pptx
Anilesh Ahuja Pioneering a Paradigm Shift in Real Estate Success.pptxAnilesh Ahuja Pioneering a Paradigm Shift in Real Estate Success.pptx
Anilesh Ahuja Pioneering a Paradigm Shift in Real Estate Success.pptx
 

San Francisco Market Focus Report Nov 2020

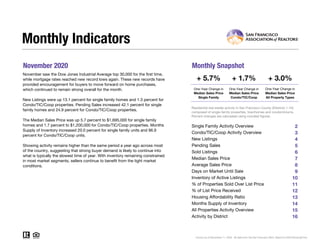
  • 1. November 2020 Monthly Snapshot One-Year Change in One-Year Change in Median Sales Price Single Family Median Sales Price Condo/TIC/Coop 2 3 4 5 6 7 8 9 10 11 12 13 14 15 16 Current as of December 11, 2020. All data from the San Francisco MLS. Report © 2020 ShowingTime. Condo/TIC/Coop Activity Overview Inventory of Active Listings % of Properties Sold Over List Price % of List Price Received Housing Affordability Ratio All Properties Activity Overview New Listings Pending Sales Sold Listings Median Sales Price Average Sales Price Days on Market Until Sale Activity by District Monthly Indicators + 5.7% + 1.7% + 3.0% One-Year Change in November saw the Dow Jones Industrial Average top 30,000 for the first time, while mortgage rates reached new record lows again. These new records have provided encouragement for buyers to move forward on home purchases, which continued to remain strong overall for the month. New Listings were up 13.1 percent for single family homes and 1.3 percent for Condo/TIC/Coop properties. Pending Sales increased 42.1 percent for single family homes and 24.9 percent for Condo/TIC/Coop properties. The Median Sales Price was up 5.7 percent to $1,695,000 for single family homes and 1.7 percent to $1,200,000 for Condo/TIC/Coop properties. Months Supply of Inventory increased 20.0 percent for single family units and 96.9 percent for Condo/TIC/Coop units. Showing activity remains higher than the same period a year ago across most of the country, suggesting that strong buyer demand is likely to continue into what is typically the slowest time of year. With inventory remaining constrained in most market segments, sellers continue to benefit from the tight market conditions. Median Sales Price All Property Types Residential real estate activity in San Francisco County (Districts 1-10) composed of single-family properties, townhomes and condominiums. Percent changes are calculated using rounded figures. Single Family Activity Overview Months Supply of Inventory
  • 2. Single Family Activity Overview Key metrics by report month and for year-to-date (YTD) starting from the first of the year. Key Metrics Historical Sparkbars 11-2019 11-2020 Percent Change YTD 2019 YTD 2020 Percent Change + 10.1%2,812 1,958 - 2.2% $1,652,500 + 3.0% + 2.0% Pending Sales 190 270 + 42.1% + 1.2%2,070 2,095 New Listings 137 155 + 13.1% 2,554 Sold Listings 200 253 + 26.5% 2,003 Median Sales Price $1,604,000 $1,695,000 + 5.7% $1,605,000 26 + 4.0% $2,059,850 -- -- Days on Market 24 32 + 33.3% 25 Avg. Sales Price $1,986,456 $2,107,712 + 6.1% $2,018,526 Active Listings 450 545 + 21.1% -- % of Properties Sold Over List Price 77.5% 63.2% - 18.5% 77.6% 33 65.9% - 15.1% - 4.5% 35 + 6.1% 107.9%% of List Price Received 111.9% 106.3% - 5.0% 113.0% Current as of December 11, 2020. All data from the San Francisco MLS. Report © 2020 ShowingTime. | 2 Months Supply 2.5 3.0 + 20.0% -- -- -- Affordability Ratio 33 34 + 3.0% 11-2017 11-2018 11-2019 11-2020 11-2017 11-2018 11-2019 11-2020 11-2017 11-2018 11-2019 11-2020 11-2017 11-2018 11-2019 11-2020 11-2017 11-2018 11-2019 11-2020 11-2017 11-2018 11-2019 11-2020 11-2017 11-2018 11-2019 11-2020 11-2017 11-2018 11-2019 11-2020 11-2017 11-2018 11-2019 11-2020 11-2017 11-2018 11-2019 11-2020 11-2017 11-2018 11-2019 11-2020
  • 3. Condo/TIC/Coop Activity Overview Key metrics by report month and for year-to-date (YTD) starting from the first of the year. Key Metrics Historical Sparkbars 11-2019 11-2020 Percent Change YTD 2019 YTD 2020 Percent Change + 28.2% Pending Sales 233 291 + 24.9% 2,722 2,498 - 8.2% New Listings 160 162 + 1.3% 3,713 4,761 Sold Listings 272 327 + 20.2% 2,638 2,388 - 9.5% Median Sales Price $1,180,000 $1,200,000 + 1.7% $1,236,500 $1,216,500 - 1.6% - 1.3% 40 + 17.6% $1,345,467 -- -- Days on Market 34 49 + 44.1% 34 Avg. Sales Price $1,322,998 $1,301,598 - 1.6% $1,363,192 Active Listings 760 1,394 + 83.4% -- % of Properties Sold Over List Price 64.3% 33.0% - 48.7% 60.7% 50 42.7% - 29.7% - 4.0% 57 + 14.0% 101.5%% of List Price Received 105.1% 100.2% - 4.7% 105.7% Current as of December 11, 2020. All data from the San Francisco MLS. Report © 2020 ShowingTime. | 3 Months Supply 3.2 6.3 + 96.9% -- -- -- Affordability Ratio 52 57 + 9.6% 11-2017 11-2018 11-2019 11-2020 11-2017 11-2018 11-2019 11-2020 11-2017 11-2018 11-2019 11-2020 11-2017 11-2018 11-2019 11-2020 11-2017 11-2018 11-2019 11-2020 11-2017 11-2018 11-2019 11-2020 11-2017 11-2018 11-2019 11-2020 11-2017 11-2018 11-2019 11-2020 11-2017 11-2018 11-2019 11-2020 11-2017 11-2018 11-2019 11-2020 11-2017 11-2018 11-2019 11-2020
  • 4. New Listings New Listings Single Family Year-Over-Year Change Condo/TIC/ Coop Year-Over-Year Change Dec-2019 86 +4.9% 134 +9.8% Jan-2020 232 +3.1% 372 +3.9% Feb-2020 247 +30.7% 393 +28.4% Mar-2020 155 -36.2% 248 -29.5% Apr-2020 155 -38.5% 213 -43.5% May-2020 250 -9.1% 496 +34.1% Jun-2020 317 +35.5% 549 +90.6% Jul-2020 363 +84.3% 655 +104.0% Aug-2020 317 +28.3% 615 +86.9% Sep-2020 318 +2.6% 594 +16.9% Oct-2020 303 +23.7% 464 +34.9% Nov-2020 155 +13.1% 162 +1.3% 12-Month Avg 242 +9.9% 408 +27.6% Historical New Listings by Month Current as of December 11, 2020. All data from the San Francisco MLS. Report © 2020 ShowingTime. | 4 A count of the properties that have been newly listed on the market in a given month. 159 196 137 160155 162 Single Family Condo/TIC/Coop November 0 100 200 300 400 500 600 700 1-2005 1-2006 1-2007 1-2008 1-2009 1-2010 1-2011 1-2012 1-2013 1-2014 1-2015 1-2016 1-2017 1-2018 1-2019 1-2020 Single Family Condo/TIC/Coop 2,726 3,777 2,554 3,713 2,812 4,761 Single Family Condo/TIC/Coop Year to Date 2018 2019 2020 + 1.3%- 18.4%+ 13.1%- 13.8% - 1.7%+ 10.1%- 6.3% + 28.2% 2018 2019 2020 2018 2019 2020 2018 2019 2020 + 9.7% + 8.1% + 7.5%- 6.2%
  • 5. Pending Sales Pending Sales Single Family Year-Over-Year Change Condo/TIC/ Coop Year-Over-Year Change Dec-2019 113 -6.6% 153 +4.1% Jan-2020 101 +13.5% 155 +28.1% Feb-2020 133 -7.6% 234 +2.6% Mar-2020 153 -27.1% 181 -39.5% Apr-2020 72 -67.6% 89 -71.4% May-2020 148 -40.3% 138 -58.9% Jun-2020 198 +2.1% 231 -5.3% Jul-2020 250 +37.4% 238 +15.0% Aug-2020 225 +51.0% 314 +48.1% Sep-2020 254 +30.3% 299 +31.7% Oct-2020 291 +17.8% 328 +7.9% Nov-2020 270 +42.1% 291 +24.9% 12-Month Avg 184 +0.8% 221 -7.6% Historical Pending Sales by Month Current as of December 11, 2020. All data from the San Francisco MLS. Report © 2020 ShowingTime. | 5 A count of the properties on which offers have been accepted in a given month. 187 222 190 233 270 291 Single Family Condo/TIC/Coop November 0 100 200 300 400 1-2005 1-2006 1-2007 1-2008 1-2009 1-2010 1-2011 1-2012 1-2013 1-2014 1-2015 1-2016 1-2017 1-2018 1-2019 1-2020 Single Family Condo/TIC/Coop 2,112 2,836 2,070 2,722 2,095 2,498 Single Family Condo/TIC/Coop Year to Date 2018 2019 2020 + 24.9%+ 5.0%+ 42.1%+ 1.6% - 4.0%+ 1.2%- 2.0% - 8.2% 2018 2019 2020 2018 2019 2020 2018 2019 2020 - 5.6% - 2.0% + 4.8%- 5.1%
  • 6. Sold Listings Sold Listings Single Family Year-Over-Year Change Condo/TIC/ Coop Year-Over-Year Change Dec-2019 175 +9.4% 216 +11.3% Jan-2020 96 -4.0% 150 +31.6% Feb-2020 115 +1.8% 179 +9.1% Mar-2020 162 -5.8% 230 -13.2% Apr-2020 104 -54.0% 114 -64.3% May-2020 106 -55.6% 109 -67.7% Jun-2020 166 -12.6% 179 -32.5% Jul-2020 213 0.0% 260 +6.6% Aug-2020 217 +29.2% 236 +14.0% Sep-2020 239 +88.2% 314 +63.5% Oct-2020 287 +12.5% 290 +12.0% Nov-2020 253 +26.5% 327 +20.2% 12-Month Avg 178 -1.4% 217 -8.1% Historical Sold Listings by Month Current as of December 11, 2020. All data from the San Francisco MLS. Report © 2020 ShowingTime. | 6 A count of the actual sales that closed in a given month. 220 264 200 272 253 327 Single Family Condo/TIC/Coop November 0 100 200 300 400 1-2005 1-2006 1-2007 1-2008 1-2009 1-2010 1-2011 1-2012 1-2013 1-2014 1-2015 1-2016 1-2017 1-2018 1-2019 1-2020 Single Family Condo/TIC/Coop 2,070 2,825 2,003 2,638 1,958 2,388 Single Family Condo/TIC/Coop Year to Date 2018 2019 2020 + 20.2%+ 3.0%+ 26.5%- 9.1% - 6.6%- 2.2%- 3.2% - 9.5% 2018 2019 2020 2018 2019 2020 2018 2019 2020 - 10.2% - 2.3% + 6.8%- 5.0%
  • 7. Median Sales Price Median Sales Price Single Family Year-Over-Year Change Condo/TIC/ Coop Year-Over-Year Change Dec-2019 $1,450,000 -2.8% $1,198,283 +2.4% Jan-2020 $1,462,500 +5.3% $1,172,000 +12.7% Feb-2020 $1,610,000 +7.3% $1,300,000 +15.0% Mar-2020 $1,650,000 0.0% $1,261,000 +1.3% Apr-2020 $1,687,000 +4.6% $1,294,000 +5.6% May-2020 $1,627,500 -3.4% $1,100,222 -11.6% Jun-2020 $1,802,500 +3.0% $1,200,000 -7.6% Jul-2020 $1,660,000 +5.3% $1,268,200 +3.7% Aug-2020 $1,656,000 +3.3% $1,244,500 -2.9% Sep-2020 $1,650,000 +7.8% $1,202,500 -9.2% Oct-2020 $1,625,555 -1.5% $1,156,250 -12.7% Nov-2020 $1,695,000 +5.7% $1,200,000 +1.7% 12-Month Avg* $1,648,800 +3.1% $1,210,000 -1.5% Historical Median Sales Price by Month * Median Sales Price for all properties from December 2019 through November 2020. This is not the average of the individual figures above. Current as of December 11, 2020. All data from the San Francisco MLS. Report © 2020 ShowingTime. | 7 Point at which half of the sales sold for more and half sold for less, not accounting for seller concessions, in a given month. $1,427,500 $1,193,625 $1,604,000 $1,180,000 $1,695,000 $1,200,000 Single Family Condo/TIC/Coop November $500,000 $750,000 $1,000,000 $1,250,000 $1,500,000 $1,750,000 $2,000,000 1-2005 1-2006 1-2007 1-2008 1-2009 1-2010 1-2011 1-2012 1-2013 1-2014 1-2015 1-2016 1-2017 1-2018 1-2019 1-2020 Single Family Condo/TIC/Coop $1,600,000 $1,200,000 $1,605,000 $1,236,500 $1,652,500 $1,216,500 Single Family Condo/TIC/Coop Year to Date 2018 2019 2020 + 1.7%- 1.1%+ 5.7%+ 12.4% + 3.0%+ 3.0%+ 0.3% - 1.6% 2018 2019 2020 2018 2019 2020 2018 2019 2020 - 4.5% + 13.5% + 4.3%- 3.5%
  • 8. Average Sales Price Avg. Sales Price Single Family Year-Over-Year Change Condo/TIC/ Coop Year-Over-Year Change Dec-2019 $1,948,749 +9.1% $1,261,689 -5.1% Jan-2020 $2,212,609 +26.3% $1,319,209 +12.1% Feb-2020 $1,953,875 +4.4% $1,404,496 +3.0% Mar-2020 $2,084,487 +1.9% $1,377,863 +3.2% Apr-2020 $2,324,543 +4.0% $1,381,974 +1.4% May-2020 $1,893,729 -11.6% $1,289,927 -3.4% Jun-2020 $2,282,142 +6.2% $1,412,552 -1.4% Jul-2020 $2,082,541 +6.3% $1,408,069 +7.4% Aug-2020 $2,040,201 +9.0% $1,358,295 -2.1% Sep-2020 $1,928,578 -6.6% $1,329,883 -8.3% Oct-2020 $1,939,321 +1.4% $1,261,814 -12.8% Nov-2020 $2,107,712 +6.1% $1,301,598 -1.6% 12-Month Avg* $2,050,735 +2.5% $1,338,518 -1.6% Historical Average Sales Price by Month * Avg. Sales Price for all properties from December 2019 through November 2020. This is not the average of the individual figures above. Current as of December 11, 2020. All data from the San Francisco MLS. Report © 2020 ShowingTime. | 8 Average sales price for all closed sales, not accounting for seller concessions, in a given month. $1,864,335 $1,263,347 $1,986,456 $1,322,998 $2,107,712 $1,301,598 Single Family Condo/TIC/Coop November $500,000 $1,000,000 $1,500,000 $2,000,000 $2,500,000 1-2005 1-2006 1-2007 1-2008 1-2009 1-2010 1-2011 1-2012 1-2013 1-2014 1-2015 1-2016 1-2017 1-2018 1-2019 1-2020 Single Family Condo/TIC/Coop $1,974,856 $1,321,217 $2,018,526 $1,363,192 $2,059,850 $1,345,467 Single Family Condo/TIC/Coop Year to Date 2018 2019 2020 - 1.6%+ 4.7%+ 6.1%+ 6.6% + 3.2%+ 2.0%+ 2.2% - 1.3% 2018 2019 2020 2018 2019 2020 2018 2019 2020 + 6.2% + 11.7% + 1.8%- 8.9%
  • 9. Days on Market Until Sale Days on Market Single Family Year-Over-Year Change Condo/TIC/ Coop Year-Over-Year Change Dec-2019 31 -6.1% 49 +11.4% Jan-2020 38 -2.6% 62 +12.7% Feb-2020 25 -13.8% 29 -27.5% Mar-2020 20 -23.1% 27 -22.9% Apr-2020 21 -19.2% 32 -15.8% May-2020 24 +9.1% 39 +34.5% Jun-2020 26 +18.2% 34 +9.7% Jul-2020 26 +13.0% 37 +12.1% Aug-2020 24 -4.0% 39 +18.2% Sep-2020 25 -10.7% 44 +29.4% Oct-2020 26 +18.2% 41 +46.4% Nov-2020 32 +33.3% 49 +44.1% 12-Month Avg* 27 +4.0% 41 +16.7% Historical Days on Market Until Sale by Month * Days on Market for all properties from December 2019 through November 2020. This is not the average of the individual figures above. Current as of December 11, 2020. All data from the San Francisco MLS. Report © 2020 ShowingTime. | 9 Average number of days between when a property is listed and when an offer is accepted in a given month. 26 38 24 34 32 49 Single Family Condo/TIC/Coop November 0 20 40 60 80 100 120 1-2005 1-2006 1-2007 1-2008 1-2009 1-2010 1-2011 1-2012 1-2013 1-2014 1-2015 1-2016 1-2017 1-2018 1-2019 1-2020 Single Family Condo/TIC/Coop 22 31 25 34 26 40 Single Family Condo/TIC/Coop Year to Date 2018 2019 2020 + 44.1%- 10.5%+ 33.3%- 7.7% + 9.7%+ 4.0%+ 13.6% + 17.6% 2018 2019 2020 2018 2019 2020 2018 2019 2020 0.0% - 18.5% - 13.9%+ 8.6%
  • 10. Inventory of Active Listings Active Listings Single Family Year-Over-Year Change Condo/TIC/ Coop Year-Over-Year Change Dec-2019 339 +3.0% 563 +10.4% Jan-2020 452 +0.9% 743 +7.5% Feb-2020 550 +19.3% 845 +17.2% Mar-2020 502 +6.6% 766 +6.7% Apr-2020 556 +14.9% 833 +12.9% May-2020 634 +33.5% 1,114 +51.6% Jun-2020 703 +42.3% 1,293 +79.6% Jul-2020 761 +63.3% 1,585 +114.8% Aug-2020 796 +53.1% 1,707 +123.7% Sep-2020 793 +32.8% 1,822 +88.2% Oct-2020 723 +31.5% 1,737 +88.2% Nov-2020 545 +21.1% 1,394 +83.4% 12-Month Avg* 613 +28.0% 1,200 +60.3% Historical Inventory of Active Listings by Month * Active Listings for all properties from December 2019 through November 2020. This is not the average of the individual figures above. Current as of December 11, 2020. All data from the San Francisco MLS. Report © 2020 ShowingTime. | 10 The number of properties available for sale in active status at the end of a given month. 464 717 450 760 545 1,394 Single Family Condo/TIC/Coop November 0 500 1,000 1,500 2,000 1-2005 1-2006 1-2007 1-2008 1-2009 1-2010 1-2011 1-2012 1-2013 1-2014 1-2015 1-2016 1-2017 1-2018 1-2019 1-2020 Single Family Condo/TIC/Coop 2018 2019 2020 + 83.4%+ 6.0%+ 21.1%- 3.0% 2018 2019 2020 + 43.2% + 20.1%
  • 11. % of Properties Sold Over List Price % of Properties Sold Over List Price Single Family Year-Over-Year Change Condo/TIC/ Coop Year-Over-Year Change Dec-2019 66.3% -2.6% 47.7% +3.9% Jan-2020 60.4% +0.7% 33.3% -19.2% Feb-2020 72.2% -7.3% 62.6% +18.1% Mar-2020 78.4% +7.0% 60.4% +8.2% Apr-2020 69.2% -6.4% 59.6% +8.0% May-2020 63.2% -20.9% 42.2% -35.1% Jun-2020 54.2% -33.2% 33.0% -48.8% Jul-2020 64.3% -22.2% 45.8% -35.0% Aug-2020 66.4% -19.1% 35.2% -40.2% Sep-2020 64.9% -12.3% 35.0% -41.1% Oct-2020 68.6% -15.1% 43.1% -34.0% Nov-2020 63.2% -18.5% 33.0% -48.7% 12-Month Avg 65.9% -14.3% 43.1% -27.8% Historical % of Properties Sold Over List Price by Month * % of Properties Sold Over List Price for all properties from December 2019 through November 2020. This is not the average of the individual figures above. Current as of December 11, 2020. All data from the San Francisco MLS. Report © 2020 ShowingTime. | 11 Percentage found when dividing the number of properties sold by properties sold over its original list price, not accounting for seller concessions. 73.6% 54.5% 77.5% 64.3%63.2% 33.0% Single Family Condo/TIC/Coop November 0.0% 20.0% 40.0% 60.0% 80.0% 100.0% 1-2005 1-2006 1-2007 1-2008 1-2009 1-2010 1-2011 1-2012 1-2013 1-2014 1-2015 1-2016 1-2017 1-2018 1-2019 1-2020 Single Family Condo/TIC/Coop 80.9% 61.5% 77.6% 60.7% 65.9% 42.7% Single Family Condo/TIC/Coop Year to Date 2018 2019 2020 - 48.7%+ 18.0%- 18.5%+ 5.3% - 1.3%- 15.1%- 4.1% - 29.7% 2018 2019 2020 2018 2019 2020 2018 2019 2020 - 8.9% + 2.1% + 3.5%- 6.5%
  • 12. % of List Price Received % of List Price Received Single Family Year-Over-Year Change Condo/TIC/ Coop Year-Over-Year Change Dec-2019 109.7% -0.7% 103.1% +1.0% Jan-2020 107.1% +1.0% 100.4% -0.6% Feb-2020 111.9% -0.6% 105.2% +1.0% Mar-2020 114.5% +3.6% 104.3% -0.4% Apr-2020 109.0% -3.0% 105.5% +0.6% May-2020 106.1% -6.3% 100.6% -6.3% Jun-2020 105.4% -8.6% 100.1% -6.6% Jul-2020 106.4% -7.8% 101.2% -5.9% Aug-2020 107.6% -6.7% 100.4% -5.1% Sep-2020 107.1% -4.7% 100.3% -4.7% Oct-2020 108.3% -5.0% 101.3% -4.3% Nov-2020 106.3% -5.0% 100.2% -4.7% 12-Month Avg* 108.1% -4.2% 101.7% -3.6% Historical % of List Price Received by Month * % of List Price Received for all properties from December 2019 through November 2020. This is not the average of the individual figures above. Current as of December 11, 2020. All data from the San Francisco MLS. Report © 2020 ShowingTime. | 12 Percentage found when dividing a property’s sales price by its most recent list price, then taking the average for all properties sold in a given month, not accounting for seller concessions. 111.2% 104.1% 111.9% 105.1%106.3% 100.2% Single Family Condo/TIC/Coop November 116.3% 106.6% 113.0% 105.7%107.9% 101.5% Single Family Condo/TIC/Coop Year to Date 90.0% 100.0% 110.0% 120.0% 130.0% 1-2005 1-2006 1-2007 1-2008 1-2009 1-2010 1-2011 1-2012 1-2013 1-2014 1-2015 1-2016 1-2017 1-2018 1-2019 1-2020 Single Family Condo/TIC/Coop 2018 2019 2020 - 4.7%+ 1.0%- 5.0%+ 0.6% 2018 2019 2020 - 3.7% - 0.4% 2018 2019 2020 - 4.0%- 0.8%- 4.5%- 2.8% 2018 2019 2020 + 1.0% + 1.4%
  • 13. Housing Affordability Ratio Affordability Ratio Single Family Year-Over-Year Change Condo/TIC/ Coop Year-Over-Year Change Dec-2019 36 +9.1% 51 +6.3% Jan-2020 37 +5.7% 54 0.0% Feb-2020 34 +3.0% 49 -3.9% Mar-2020 32 +6.7% 49 +4.3% Apr-2020 33 +6.5% 50 +4.2% May-2020 34 +13.3% 58 +23.4% Jun-2020 31 +6.9% 55 +22.2% Jul-2020 34 +3.0% 53 +8.2% Aug-2020 34 0.0% 54 +10.2% Sep-2020 35 0.0% 56 +19.1% Oct-2020 35 +6.1% 59 +22.9% Nov-2020 34 +3.0% 57 +9.6% 12-Month Avg* 34 +5.4% 32 +16.9% Historical Housing Affordability Ratio by Month * Affordability Ratio for all properties from December 2019 through November 2020. This is not the average of the individual figures above. Current as of December 11, 2020. All data from the San Francisco MLS. Report © 2020 ShowingTime. | 13 This index measures housing affordability for the region. For example, an index of 120 means the median household income is 120% of what is necessary to qualify for the median-priced home under prevailing interest rates. A higher number means greater affordability. 32 43 33 52 34 57 Single Family Condo/TIC/Coop November 20 40 60 80 100 1-2005 1-2006 1-2007 1-2008 1-2009 1-2010 1-2011 1-2012 1-2013 1-2014 1-2015 1-2016 1-2017 1-2018 1-2019 1-2020 Single Family Condo/TIC/Coop 2018 2019 2020 + 9.6%+ 20.9%+ 3.0%+ 3.1% 2018 2019 2020 - 8.6% - 12.2% 28 43 33 50 35 57 Single Family Condo/TIC/Coop Year to Date 2018 2019 2020 + 14.0%+ 16.3%+ 6.1%+ 17.9% 2018 2019 2020 - 24.3% - 17.3%
  • 14. Months Supply of Inventory Months Supply Single Family Year-Over-Year Change Condo/TIC/ Coop Year-Over-Year Change Dec-2019 1.9 +5.6% 2.3 +9.5% Jan-2020 2.5 +4.2% 3.1 +10.7% Feb-2020 3.0 +20.0% 3.5 +16.7% Mar-2020 2.8 +7.7% 3.3 +10.0% Apr-2020 3.4 +30.8% 3.9 +30.0% May-2020 4.1 +57.7% 5.6 +86.7% Jun-2020 4.5 +66.7% 6.6 +120.0% Jul-2020 4.7 +88.0% 7.9 +154.8% Aug-2020 4.7 +67.9% 8.2 +156.3% Sep-2020 4.6 +39.4% 8.5 +107.3% Oct-2020 4.1 +36.7% 8.0 +105.1% Nov-2020 3.0 +20.0% 6.3 +96.9% 12-Month Avg* 3.6 +38.0% 5.6 +80.3% Historical Months Supply of Inventory by Month * Months Supply for all properties from December 2019 through November 2020. This is not the average of the individual figures above. Current as of December 11, 2020. All data from the San Francisco MLS. Report © 2020 ShowingTime. | 14 The inventory of homes for sale at the end of a given month, divided by the average monthly pending sales from the last 12 months. 2.5 2.8 2.5 3.23.0 6.3 Single Family Condo/TIC/Coop November 0.0 2.0 4.0 6.0 8.0 10.0 1-2005 1-2006 1-2007 1-2008 1-2009 1-2010 1-2011 1-2012 1-2013 1-2014 1-2015 1-2016 1-2017 1-2018 1-2019 1-2020 Single Family Condo/TIC/Coop 2018 2019 2020 + 96.9%+ 14.3%+ 20.0%0.0% 2018 2019 2020 + 47.1% + 12.0%
  • 15. All Properties Activity Overview Key metrics by report month and for year-to-date (YTD) starting from the first of the year. Key Metrics Historical Sparkbars 11-2019 11-2020 Percent Change YTD 2019 YTD 2020 Percent Change + 20.8% Pending Sales 423 561 + 32.6% 4,792 4,593 - 4.2% New Listings 297 317 + 6.7% 6,267 7,573 Sold Listings 472 580 + 22.9% 4,641 4,346 - 6.4% Median Sales Price $1,359,000 $1,400,000 + 3.0% $1,385,000 $1,420,000 + 2.5% + 1.3% 34 + 13.3% $1,667,318 -- -- Days on Market 30 41 + 36.7% 30 Avg. Sales Price $1,604,125 $1,653,230 + 3.1% $1,646,026 Active Listings 1,210 1,939 + 60.2% -- % of Properties Sold Over List Price 69.9% 46.2% - 33.9% 68.0% 38 53.1% - 21.9% - 4.0% 42 + 10.5% 104.4%% of List Price Received 108.0% 102.9% - 4.7% 108.8% Current as of December 11, 2020. All data from the San Francisco MLS. Report © 2020 ShowingTime. | 15 Months Supply 2.9 4.8 + 65.5% -- -- -- Affordability Ratio 39 42 + 7.7% 11-2017 11-2018 11-2019 11-2020 11-2017 11-2018 11-2019 11-2020 11-2017 11-2018 11-2019 11-2020 11-2017 11-2018 11-2019 11-2020 11-2017 11-2018 11-2019 11-2020 11-2017 11-2018 11-2019 11-2020 11-2017 11-2018 11-2019 11-2020 11-2017 11-2018 11-2019 11-2020 11-2017 11-2018 11-2019 11-2020 11-2017 11-2018 11-2019 11-2020 11-2017 11-2018 11-2019 11-2020
  • 16. Activity by District SF District 1: Northwest (Sea Cliff, Lake, Jordan Park / Laurel Heights, Outer Richmond, Central Richmond, Inner Richmond, Lone Mountain) SF District 2: Central West (Outer Sunset, Central Sunset, Inner Sunset, Outer Parkside, Parkside, Inner Parkside, Golden Gate Heights) SF District 3: Southwest (Pine Lake Park, Lake Shore, Merced Manor, Stonestown, Lakeside, Merced Heights, Ingleside, Ingleside Heights, Oceanview) SF District 4: Twin Peaks W (Forest Hill (& Ext), W Portal, St Francis Wd, Balboa Terr, Mt Dav Manor, Ingleside Terr, Monterey Hts, Wstwd Pk & H'lnds, Shrwd Fst, Miraloma Pk, Dmnd Hts, Mdtwn Terr) SF District 5: Central (Haight Ashbury, Cole Vly / Prnssus Hts, Clarndn Hts, Corona Hts, Twin Pks, Glen Pk, Noe Vly, Eureka Vly / Dolores Hts, Mission Dolores, Duboce Trngl, Buena Vista / Ashbury Hts) SF District 6: Central North (Lower Pacific Heights, Anza Vista, Western Addition, North Panhandle, Alamo Square, Hayes Valley) SF District 7: North (Marina, Cow Hollow, Presidio Heights, Pacific Heights) SF District 8: Northeast (North Waterfront, North Beach, Russian Hill, Telegraph Hill, Nob Hill, Financial District / Barbary Coast, Downtown, Van Ness / Civic Center, Tenderloin) SF District 9: Central East (Yerba Buena, South Beach, South of Market, Mission Bay, Inner Mission, Potrero Hill, Central Waterfront / Dogpatch, Bernal Heights) SF District 10: Southeast (Outer Mission, Mission Terr, Excelsior, Portola, Bayview, Silver Terr, Hunters Pt, Candlestick Pt, Bayview Hts, Little Hollywood, Visitation Vly, Crocker Amazon) 11-2019 11-2020 + / – 11-2019 11-2020 + / – 11-2019 11-2020 + / – 11-2019 11-2020 + / – 11-2019 11-2020 + / – Single Family 1 SF District 1 39 31 -20.5% 18 24 +33.3% $1,812,500 $2,212,500 +22.1% 18 26 +44.4% 2.5 1.7 -32.0% 2 SF District 2 47 52 +10.6% 41 43 +4.9% $1,401,000 $1,569,000 +12.0% 18 20 +11.1% 1.4 1.6 +14.3% 3 SF District 3 22 31 +40.9% 13 10 -23.1% $1,160,000 $1,437,500 +23.9% 34 29 -14.7% 1.8 2.7 +50.0% 4 SF District 4 42 46 +9.5% 27 48 +77.8% $1,510,000 $1,700,000 +12.6% 25 26 +4.0% 1.7 1.8 +5.9% 5 SF District 5 78 95 +21.8% 30 41 +36.7% $2,275,000 $2,500,000 +9.9% 28 36 +28.6% 2.8 3.3 +17.9% 6 SF District 6 24 17 -29.2% 3 2 -33.3% $3,210,000 $2,275,000 -29.1% 47 32 -31.9% 7.2 3.8 -47.2% 7 SF District 7 38 52 +36.8% 10 9 -10.0% $5,150,000 $4,900,000 -4.9% 34 51 +50.0% 4.4 7.1 +61.4% 8 SF District 8 24 23 -4.2% 3 3 0.0% $2,175,000 $1,818,000 -16.4% 23 37 +60.9% 10.7 12.2 +14.0% 9 SF District 9 59 90 +52.5% 24 30 +25.0% $1,815,000 $1,710,000 -5.8% 23 50 +117.4% 3.1 4.3 +38.7% 10 SF District 10 77 108 +40.3% 31 43 +38.7% $1,130,000 $999,990 -11.5% 21 34 +61.9% 2.1 3.3 +57.1% Condo/TIC/Coop 1 SF District 1 41 45 +9.8% 15 24 +60.0% $1,495,000 $1,487,500 -0.5% 35 31 -11.4% 3.1 3.2 +3.2% 2 SF District 2 10 21 +110.0% 6 6 0.0% $995,000 $1,361,250 +36.8% 27 31 +14.8% 2.5 4.4 +76.0% 3 SF District 3 6 13 +116.7% 6 5 -16.7% $1,006,500 $1,160,000 +15.3% 41 72 +75.6% 1.6 4.9 +206.3% 4 SF District 4 17 19 +11.8% 8 12 +50.0% $844,000 $813,000 -3.7% 48 54 +12.5% 3.0 4.0 +33.3% 5 SF District 5 100 153 +53.0% 48 57 +18.8% $1,350,000 $1,257,000 -6.9% 24 38 +58.3% 2.8 4.0 +42.9% 6 SF District 6 40 107 +167.5% 28 49 +75.0% $1,088,944 $1,206,000 +10.7% 30 38 +26.7% 1.8 4.4 +144.4% 7 SF District 7 72 134 +86.1% 30 42 +40.0% $1,300,000 $1,615,000 +24.2% 29 47 +62.1% 2.7 5.1 +88.9% 8 SF District 8 165 281 +70.3% 36 41 +13.9% $1,042,100 $1,030,000 -1.2% 39 60 +53.8% 4.2 8.5 +102.4% 9 SF District 9 279 568 +103.6% 90 89 -1.1% $1,187,500 $1,020,000 -14.1% 38 61 +60.5% 3.3 8.3 +151.5% 10 SF District 10 30 53 +76.7% 5 2 -60.0% $509,000 $920,000 +80.7% 32 54 +68.8% 5.1 11.0 +115.7% Key metrics by report month for the districts of San Fransisco. Current as of December 11, 2020. All data from the San Francisco MLS. Report © 2020 ShowingTime. | 16 Active Listings Sold Listings Median Sales Price Days on Market Months Supply