SlideShare a Scribd company logo
1 of 16
Download to read offline
August 2015 Monthly Snapshot
One-Year Change in One-Year Change in
Median Sales Price
Single Family
Median Sales Price
Condo/TIC/Coop
2
3
4
5
6
7
8
9
10
11
12
13
14
15
16
Monthly Indicators
+ 26.6% + 12.4% + 21.1%
One-Year Change in
Home prices were up during summer across the nation in year-over-year
comparisons. With the economy on full mend, Federal Reserve Chair Janet
Yellen has predicted a fine-tuning of monetary policy before the year ends. In
tandem with the improved economy, the unemployment rate for July 2015
remained at 5.3 percent for the second month in a row. It is widely believed that
interest rates will go up before the year is over. Generally, this does not happen
without careful consideration for the impact such a move will have on residential
real estate.
New Listings were down 16.0 percent for single family homes and 21.6 percent
for Condo/TIC/Coop properties. Pending Sales decreased 3.9 percent for single
family homes and 10.5 percent for Condo/TIC/Coop properties.
The Median Sales Price was up 26.6 percent to $1,225,444 for single family
homes and 12.4 percent to $1,045,000 for Condo/TIC/Coop properties. Months
Supply of Inventory decreased 25.0 percent for single family units and 26.3
percent for Condo/TIC/Coop units.
Statistics released by the U.S. Census Bureau and the Department of Housing
and Urban Development indicate that privately-owned housing starts in July
2015 rose 10.1 percent compared to last year to the highest level the market
has seen since October 2007. This bodes well for the eventual landing of a flock
of potential buyers currently holding in a rental pattern. As ideal summer
weather diverges toward autumn, we will begin to see some seasonal
relaxation, but the market should still look positive when compared to last year.
Median Sales Price
All Property Types
Residential real estate activity in San Francisco County (Districts 1-10),
comprised of single-family properties, townhomes and condominiums.
Percent changes are calculated using rounded figures.
Single Family Activity Overview
Months Supply of Inventory
Current as of September 11, 2015. All data from the San Francisco MLS. Powered by 10K Research and Marketing.
Condo/TIC/Coop Activity Overview
Inventory of Active Listings
% of Properties Sold Over List Price
% of List Price Received
Housing Affordability Ratio
All Properties Activity Overview
New Listings
Pending Sales
Sold Listings
Median Sales Price
Average Sales Price
Days on Market Until Sale
Activity by District
Single Family Activity Overview
Key metrics by report month and for year-to-date (YTD) starting from the first of the year.
Key Metrics Historical Sparkbars 8-2014 8-2015 Percent Change YTD 2014 YTD 2015 Percent Change
Current as of September 11, 2015. All data from the San Francisco MLS. Powered by 10K Research and Marketing. | 2
Months Supply 2.0 1.5 - 25.0% -- -- --
Affordability Ratio 47 39 - 17.0%
% of List Price Received 111.2% 117.5% + 5.7% 112.8%
43
82.7% + 2.4%
+ 2.9%
39 - 9.3%
116.1%
% of Properties Sold Over List Price 80.6% 89.9% + 11.5% 80.8%
Active Listings 395 298 - 24.6% --
Avg. Sales Price $1,326,578 $1,489,918 + 12.3% $1,431,035
Days on Market 27 28 + 3.7% 31 26 - 16.1%
$1,671,608
-- --
Median Sales Price $968,000 $1,225,444 + 26.6% $1,050,000
Sold Listings 211 188 - 10.9% 1,534
New Listings 225 189 - 16.0% 1,917
Pending Sales 204 196 - 3.9% - 1.8%1,566 1,538
- 3.0%1,859
1,486 - 3.1%
$1,250,000 + 19.0%
+ 16.8%
8-2012 8-2013 8-2014 8-2015
8-2012 8-2013 8-2014 8-2015
8-2012 8-2013 8-2014 8-2015
8-2012 8-2013 8-2014 8-2015
8-2012 8-2013 8-2014 8-2015
8-2012 8-2013 8-2014 8-2015
8-2012 8-2013 8-2014 8-2015
8-2012 8-2013 8-2014 8-2015
8-2012 8-2013 8-2014 8-2015
8-2012 8-2013 8-2014 8-2015
8-2012 8-2013 8-2014 8-2015
Condo/TIC/Coop Activity Overview
Key metrics by report month and for year-to-date (YTD) starting from the first of the year.
Key Metrics Historical Sparkbars 8-2014 8-2015 Percent Change YTD 2014 YTD 2015 Percent Change
Current as of September 11, 2015. All data from the San Francisco MLS. Powered by 10K Research and Marketing. | 3
Months Supply 1.9 1.4 - 26.3% -- -- --
Affordability Ratio 56 53 - 5.4%
% of List Price Received 106.4% 108.8% + 2.3% 107.5%
56
71.4% + 3.8%
+ 1.7%
52 - 7.1%
109.3%
% of Properties Sold Over List Price 69.3% 71.7% + 3.5% 68.8%
Active Listings 518 345 - 33.4% --
Avg. Sales Price $1,092,040 $1,161,136 + 6.3% $1,101,981
Days on Market 33 28 - 15.2% 34
$1,069,500 + 14.2%
+ 13.6%
30 - 11.8%
$1,251,808
-- --
Sold Listings 287 223 - 22.3% 2,139 1,928 - 9.9%
Median Sales Price $930,000 $1,045,000 + 12.4% $936,500
- 11.3%
Pending Sales 266 238 - 10.5% 2,166 2,001 - 7.6%
New Listings 273 214 - 21.6% 2,649 2,350
8-2012 8-2013 8-2014 8-2015
8-2012 8-2013 8-2014 8-2015
8-2012 8-2013 8-2014 8-2015
8-2012 8-2013 8-2014 8-2015
8-2012 8-2013 8-2014 8-2015
8-2012 8-2013 8-2014 8-2015
8-2012 8-2013 8-2014 8-2015
8-2012 8-2013 8-2014 8-2015
8-2012 8-2013 8-2014 8-2015
8-2012 8-2013 8-2014 8-2015
8-2012 8-2013 8-2014 8-2015
New Listings
New Listings
Single
Family
Year-Over-Year
Change
Condo/TIC/
Coop
Year-Over-Year
Change
Sep-2014 349 +19.5% 389 -13.0%
Oct-2014 250 -9.1% 335 +4.0%
Nov-2014 128 -23.8% 167 -12.6%
Dec-2014 77 -30.0% 110 -1.8%
Jan-2015 199 -2.0% 265 -20.7%
Feb-2015 236 +21.6% 296 -2.6%
Mar-2015 249 +5.5% 331 +9.6%
Apr-2015 247 +2.5% 350 -4.6%
May-2015 254 -7.6% 327 -8.4%
Jun-2015 246 -11.2% 304 -15.3%
Jul-2015 239 -10.2% 263 -25.5%
Aug-2015 189 -16.0% 214 -21.6%
12-Month Avg 222 -3.6% 279 -9.9%
Historical New Listings by Month
Current as of September 11, 2015. All data from the San Francisco MLS. Powered by 10K Research and Marketing. | 4
A count of the properties that have been newly listed on the market in a given month.
272
340
225
273
189
214
Single Family Condo/TIC/Coop
August
0
100
200
300
400
500
600
700
1-2005 1-2006 1-2007 1-2008 1-2009 1-2010 1-2011 1-2012 1-2013 1-2014 1-2015
Single Family Condo/TIC/Coop
2,129
2,807
1,917
2,649
1,859
2,350
Single Family Condo/TIC/Coop
Year to Date
2013 2014 2015
- 21.6%- 19.7%- 16.0%- 17.3% - 5.6%- 3.0%- 10.0% - 11.3%
2013 2014 2015 2013 2014 2015 2013 2014 2015
+ 7.1% + 2.1% + 9.1%+ 8.6%
Pending Sales
Pending Sales
Single
Family
Year-Over-Year
Change
Condo/TIC/
Coop
Year-Over-Year
Change
Sep-2014 213 +1.9% 268 +5.5%
Oct-2014 267 +9.4% 301 -11.5%
Nov-2014 210 -5.0% 218 -19.0%
Dec-2014 135 -21.1% 208 +3.0%
Jan-2015 109 -17.4% 149 -18.6%
Feb-2015 138 -16.4% 213 -15.1%
Mar-2015 232 +6.9% 292 -1.0%
Apr-2015 225 +8.7% 279 -4.8%
May-2015 208 -2.8% 293 -1.0%
Jun-2015 220 +10.0% 289 -5.9%
Jul-2015 210 -7.5% 248 -9.8%
Aug-2015 196 -3.9% 238 -10.5%
12-Month Avg 197 -2.0% 250 -7.3%
Historical Pending Sales by Month
A count of the properties on which offers have been accepted in a given month.
Current as of September 11, 2015. All data from the San Francisco MLS. Powered by 10K Research and Marketing. | 5
229
302
204
266
196
238
Single Family Condo/TIC/Coop
August
0
100
200
300
400
1-2005 1-2006 1-2007 1-2008 1-2009 1-2010 1-2011 1-2012 1-2013 1-2014 1-2015
Single Family Condo/TIC/Coop
1,777
2,285
1,566
2,166
1,538
2,001
Single Family Condo/TIC/Coop
Year to Date
2013 2014 2015
- 10.5%- 11.9%- 3.9%- 10.9% - 5.2%- 1.8%- 11.9% - 7.6%
2013 2014 2015 2013 2014 2015 2013 2014 2015
+ 1.3% + 1.1% + 4.6%+ 4.5%
Sold Listings
Sold Listings
Single
Family
Year-Over-Year
Change
Condo/TIC/
Coop
Year-Over-Year
Change
Sep-2014 196 +3.7% 248 +7.8%
Oct-2014 278 +8.6% 319 -5.1%
Nov-2014 201 -16.3% 216 -23.9%
Dec-2014 195 -8.9% 227 -7.7%
Jan-2015 110 -17.3% 158 -11.2%
Feb-2015 128 -18.5% 161 -27.5%
Mar-2015 189 +6.8% 264 -1.5%
Apr-2015 216 +4.9% 287 -12.0%
May-2015 204 -11.3% 286 -3.1%
Jun-2015 216 +12.5% 284 -0.7%
Jul-2015 235 +3.1% 265 -4.3%
Aug-2015 188 -10.9% 223 -22.3%
12-Month Avg 196 -3.2% 245 -9.2%
Historical Sold Listings by Month
A count of the actual sales that closed in a given month.
Current as of September 11, 2015. All data from the San Francisco MLS. Powered by 10K Research and Marketing. | 6
238
303
211
287
188
223
Single Family Condo/TIC/Coop
August
0
100
200
300
400
1-2005 1-2006 1-2007 1-2008 1-2009 1-2010 1-2011 1-2012 1-2013 1-2014 1-2015
Single Family Condo/TIC/Coop
1,760
2,237
1,534
2,139
1,486
1,928
Single Family Condo/TIC/Coop
Year to Date
2013 2014 2015
- 22.3%- 5.3%- 10.9%- 11.3% - 4.4%- 3.1%- 12.8% - 9.9%
2013 2014 2015 2013 2014 2015 2013 2014 2015
- 1.7% + 2.4% + 4.3%- 6.2%
Median Sales Price
Median Sales Price
Single
Family
Year-Over-Year
Change
Condo/TIC/
Coop
Year-Over-Year
Change
Sep-2014 $1,037,500 +11.8% $915,000 +10.8%
Oct-2014 $1,190,000 +31.5% $955,000 +10.5%
Nov-2014 $1,126,000 +17.7% $1,020,000 +23.5%
Dec-2014 $1,075,000 +14.1% $925,000 +21.3%
Jan-2015 $975,000 +5.4% $899,500 -5.3%
Feb-2015 $1,124,000 +7.0% $1,100,000 +17.4%
Mar-2015 $1,250,000 +28.2% $1,100,000 +14.0%
Apr-2015 $1,320,000 +20.0% $1,080,000 +19.3%
May-2015 $1,393,500 +27.8% $1,112,500 +18.4%
Jun-2015 $1,300,000 +10.6% $1,100,000 +15.2%
Jul-2015 $1,280,000 +18.4% $1,025,018 +7.9%
Aug-2015 $1,225,444 +26.6% $1,045,000 +12.4%
12-Month Avg* $1,200,000 +20.0% $1,020,000 +13.3%
Historical Median Sales Price by Month
Point at which half of the sales sold for more and half sold for less, not accounting for seller concessions, in a given month.
* Median Sales Price for all properties from September 2014 through August 2015. This is not the
average of the individual figures above.
Current as of September 11, 2015. All data from the San Francisco MLS. Powered by 10K Research and Marketing. | 7
$934,000
$810,000
$968,000
$930,000
$1,225,444
$1,045,000
Single Family Condo/TIC/Coop
August
$400,000
$600,000
$800,000
$1,000,000
$1,200,000
$1,400,000
1-2005 1-2006 1-2007 1-2008 1-2009 1-2010 1-2011 1-2012 1-2013 1-2014 1-2015
Single Family Condo/TIC/Coop
$900,000
$818,000
$1,050,000
$936,500
$1,250,000
$1,069,500
Single Family Condo/TIC/Coop
Year to Date
2013 2014 2015
+ 12.4%+ 14.8%+ 26.6%+ 3.6% + 14.5%+ 19.0%+ 16.7% + 14.2%
2013 2014 2015 2013 2014 2015 2013 2014 2015
+ 22.5% + 21.7% + 18.7%+ 11.7%
Average Sales Price
Avg. Sales Price
Single
Family
Year-Over-Year
Change
Condo/TIC/
Coop
Year-Over-Year
Change
Sep-2014 $1,321,054 +7.2% $1,015,335 +8.2%
Oct-2014 $1,670,076 +23.9% $1,067,327 +5.9%
Nov-2014 $1,460,978 +10.3% $1,121,938 +14.6%
Dec-2014 $1,343,423 -1.6% $1,144,474 +12.2%
Jan-2015 $1,279,424 +3.3% $1,094,504 -1.3%
Feb-2015 $1,559,194 +6.6% $1,204,301 +21.1%
Mar-2015 $1,748,561 +25.6% $1,300,064 +22.7%
Apr-2015 $1,772,557 +17.2% $1,319,922 +18.6%
May-2015 $1,827,245 +25.2% $1,329,588 +14.6%
Jun-2015 $1,793,511 +12.3% $1,284,151 +10.1%
Jul-2015 $1,659,935 +18.0% $1,210,314 +10.6%
Aug-2015 $1,489,918 +12.3% $1,161,136 +6.3%
12-Month Avg* $1,597,189 +14.9% $1,193,976 +12.3%
Historical Average Sales Price by Month
Average sales price for all closed sales, not accounting for seller concessions, in a given month.
* Avg. Sales Price for all properties from September 2014 through August 2015. This is not the
average of the individual figures above.
Current as of September 11, 2015. All data from the San Francisco MLS. Powered by 10K Research and Marketing. | 8
$1,301,708
$929,734
$1,326,578
$1,092,040
$1,489,918
$1,161,136
Single Family Condo/TIC/Coop
August
$600,000
$800,000
$1,000,000
$1,200,000
$1,400,000
$1,600,000
$1,800,000
$2,000,000
1-2005 1-2006 1-2007 1-2008 1-2009 1-2010 1-2011 1-2012 1-2013 1-2014 1-2015
Single Family Condo/TIC/Coop
$1,277,106
$949,301
$1,431,035
$1,101,981
$1,671,608
$1,251,808
Single Family Condo/TIC/Coop
Year to Date
2013 2014 2015
+ 6.3%+ 17.5%+ 12.3%+ 1.9% + 16.1%+ 16.8%+ 12.1% + 13.6%
2013 2014 2015 2013 2014 2015 2013 2014 2015
+ 31.8% + 20.8% + 22.1%+ 15.4%
Days on Market Until Sale
Days on Market
Single
Family
Year-Over-Year
Change
Condo/TIC/
Coop
Year-Over-Year
Change
Sep-2014 26 -13.3% 37 +5.7%
Oct-2014 30 -11.8% 37 0.0%
Nov-2014 31 -6.1% 38 -5.0%
Dec-2014 38 -7.3% 47 +6.8%
Jan-2015 43 +7.5% 49 -2.0%
Feb-2015 27 -28.9% 29 -23.7%
Mar-2015 24 -25.0% 28 -9.7%
Apr-2015 23 -34.3% 31 0.0%
May-2015 23 -4.2% 28 0.0%
Jun-2015 26 -3.7% 26 -21.2%
Jul-2015 25 -16.7% 29 -12.1%
Aug-2015 28 +3.7% 28 -15.2%
12-Month Avg* 28 -12.7% 33 -6.3%
Historical Days on Market Until Sale by Month
Average number of days between when a property is listed and when an offer is accepted in a given month.
* Days on Market for all properties from September 2014 through August 2015. This is not the
average of the individual figures above.
Current as of September 11, 2015. All data from the San Francisco MLS. Powered by 10K Research and Marketing. | 9
37 38
27
33
28 28
Single Family Condo/TIC/Coop
August
20
40
60
80
100
120
1-2005 1-2006 1-2007 1-2008 1-2009 1-2010 1-2011 1-2012 1-2013 1-2014 1-2015
Single Family Condo/TIC/Coop
36
40
31
34
26
30
Single Family Condo/TIC/Coop
Year to Date
2013 2014 2015
- 15.2%- 13.2%+ 3.7%- 27.0% - 15.0%- 16.1%- 13.9% - 11.8%
2013 2014 2015 2013 2014 2015 2013 2014 2015
- 26.0% - 35.7% - 38.5%- 29.6%
Inventory of Active Listings
Active Listings
Single
Family
Year-Over-Year
Change
Condo/TIC/
Coop
Year-Over-Year
Change
Sep-2014 490 -1.8% 581 -19.0%
Oct-2014 426 -12.5% 561 -11.9%
Nov-2014 316 -19.2% 458 -8.9%
Dec-2014 206 -22.8% 272 -18.1%
Jan-2015 278 -11.5% 371 -18.8%
Feb-2015 355 +10.6% 430 -11.5%
Mar-2015 352 +8.3% 443 -5.1%
Apr-2015 346 +3.3% 480 -7.0%
May-2015 369 -1.3% 475 -14.1%
Jun-2015 364 -13.3% 448 -21.7%
Jul-2015 353 -16.5% 424 -27.4%
Aug-2015 298 -24.6% 345 -33.4%
12-Month Avg* 346 -8.7% 441 -16.6%
Historical Inventory of Active Listings by Month
The number of properties available for sale in active status at the end of a given month.
* Active Listings for all properties from September 2014 through August 2015. This is not the
average of the individual figures above.
Current as of September 11, 2015. All data from the San Francisco MLS. Powered by 10K Research and Marketing. | 10
466
588
395
518
298
345
Single Family Condo/TIC/Coop
August
200
400
600
800
1,000
1,200
1,400
1,600
1-2005 1-2006 1-2007 1-2008 1-2009 1-2010 1-2011 1-2012 1-2013 1-2014 1-2015
Single Family Condo/TIC/Coop
2013 2014 2015
- 33.4%- 11.9%- 24.6%- 15.2%
2013 2014 2015
- 7.5% - 6.8%
% of Properties Sold Over List Price
% of Properties
Sold Over List Price
Single
Family
Year-Over-Year
Change
Condo/TIC/
Coop
Year-Over-Year
Change
Sep-2014 77.6% -1.5% 66.5% -3.2%
Oct-2014 82.4% +2.0% 69.3% +2.5%
Nov-2014 80.0% +3.2% 67.1% +7.7%
Dec-2014 73.8% +14.4% 55.5% +2.6%
Jan-2015 64.5% -1.4% 58.2% +32.0%
Feb-2015 82.0% +8.2% 65.8% -4.5%
Mar-2015 76.7% -1.7% 68.6% -4.2%
Apr-2015 84.3% -1.9% 71.4% +2.1%
May-2015 83.8% -3.7% 76.6% +0.4%
Jun-2015 87.0% +9.8% 76.1% +10.0%
Jul-2015 84.3% -2.0% 74.7% +4.5%
Aug-2015 89.9% +11.5% 71.7% +3.5%
12-Month Avg 81.3% +3.1% 69.2% +3.4%
Historical % of Properties Sold Over List Price by Month
Percentage found when dividing the number of properties sold by properties sold over its original list price, not accounting for seller
concessions.
* % of Properties Sold Over List Price for all properties from September 2014 through August
2015. This is not the average of the individual figures above.
Current as of September 11, 2015. All data from the San Francisco MLS. Powered by 10K Research and Marketing. | 11
75.2%
66.0%
80.6%
69.3%
89.9%
71.7%
Single Family Condo/TIC/Coop
August
0.0%
20.0%
40.0%
60.0%
80.0%
100.0%
1-2005 1-2006 1-2007 1-2008 1-2009 1-2010 1-2011 1-2012 1-2013 1-2014 1-2015
Single Family Condo/TIC/Coop
76.1%
65.1%
80.8%
68.8%
82.7%
71.4%
Single Family Condo/TIC/Coop
Year to Date
2013 2014 2015
+ 3.5%+ 5.0%+ 11.5%+ 7.2% + 5.7%+ 2.4%+ 6.2% + 3.8%
2013 2014 2015 2013 2014 2015 2013 2014 2015
+ 13.8% + 35.9% + 56.5%+ 45.1%
% of List Price Received
% of List Price
Received
Single
Family
Year-Over-Year
Change
Condo/TIC/
Coop
Year-Over-Year
Change
Sep-2014 111.7% +1.7% 105.2% -0.5%
Oct-2014 113.0% +2.5% 106.9% +1.3%
Nov-2014 111.3% +2.4% 106.4% +1.3%
Dec-2014 109.0% +2.1% 103.5% +0.1%
Jan-2015 107.9% +0.2% 104.9% +1.8%
Feb-2015 114.6% +4.0% 108.1% +1.8%
Mar-2015 113.7% +1.7% 109.6% +1.2%
Apr-2015 117.0% +1.7% 109.4% +1.1%
May-2015 118.5% +2.4% 111.7% +2.4%
Jun-2015 117.3% +3.1% 110.3% +1.8%
Jul-2015 117.8% +3.2% 109.4% +1.2%
Aug-2015 117.5% +5.7% 108.8% +2.3%
12-Month Avg* 114.4% +2.7% 108.1% +1.4%
Historical % of List Price Received by Month
Percentage found when dividing a property’s sales price by its most recent list price, then taking the average for all properties sold in a given
month, not accounting for seller concessions.
* % of List Price Received for all properties from September 2014 through August 2015. This is
not the average of the individual figures above.
Current as of September 11, 2015. All data from the San Francisco MLS. Powered by 10K Research and Marketing. | 12
110.1%
105.5%
111.2%
106.4%
117.5%
108.8%
Single Family Condo/TIC/Coop
August
110.2%
105.5%
112.8%
107.5%
116.1%
109.3%
Single Family Condo/TIC/Coop
Year to Date
90.0%
100.0%
110.0%
120.0%
130.0%
1-2005 1-2006 1-2007 1-2008 1-2009 1-2010 1-2011 1-2012 1-2013 1-2014 1-2015
Single Family Condo/TIC/Coop
2013 2014 2015
+ 2.3%+ 0.9%+ 5.7%+ 1.0%
2013 2014 2015
+ 4.1% + 3.4%
2013 2014 2015
+ 1.7%+ 1.9%+ 2.9%+ 2.4%
2013 2014 2015
+ 6.4% + 4.5%
Housing Affordability Ratio
Affordability Ratio
Single
Family
Year-Over-Year
Change
Condo/TIC/
Coop
Year-Over-Year
Change
Sep-2014 43 -12.2% 57 -9.5%
Oct-2014 39 -23.5% 55 -9.8%
Nov-2014 41 -19.6% 52 -22.4%
Dec-2014 43 -12.2% 58 -15.9%
Jan-2015 51 +8.5% 63 +18.9%
Feb-2015 44 +4.8% 52 -3.7%
Mar-2015 39 -15.2% 52 -1.9%
Apr-2015 37 -7.5% 53 -5.4%
May-2015 36 -14.3% 52 -7.1%
Jun-2015 37 -5.1% 51 -7.3%
Jul-2015 37 -11.9% 54 -1.8%
Aug-2015 39 -17.0% 53 -5.4%
12-Month Avg* 41 -14.0% 45 -8.9%
Historical Housing Affordability Ratio by Month
This index measures housing affordability for the region. An index of 120 means the median household income is 120% of what is necessary to
qualify for the median-priced home under prevailing interest rates. A higher number means greater affordability.
* Affordability Ratio for all properties from September 2014 through August 2015. This is not the
average of the individual figures above.
Current as of September 11, 2015. All data from the San Francisco MLS. Powered by 10K Research and Marketing. | 13
48
63
47
56
39
53
Single Family Condo/TIC/Coop
August
30
40
50
60
70
80
90
100
1-2005 1-2006 1-2007 1-2008 1-2009 1-2010 1-2011 1-2012 1-2013 1-2014 1-2015
Single Family Condo/TIC/Coop
2013 2014 2015
- 5.4%- 11.1%- 17.0%- 2.1%
2013 2014 2015
- 26.2% - 19.2%
50
63
43
56
39
52
Single Family Condo/TIC/Coop
Year to Date
2013 2014 2015
- 7.1%- 11.1%- 9.3%- 14.0%
2013 2014 2015
- 25.4% - 23.2%
Months Supply of Inventory
Months Supply
Single
Family
Year-Over-Year
Change
Condo/TIC/
Coop
Year-Over-Year
Change
Sep-2014 2.4 +9.1% 2.1 -19.2%
Oct-2014 2.1 -4.5% 2.1 -8.7%
Nov-2014 1.6 -11.1% 1.7 -5.6%
Dec-2014 1.0 -16.7% 1.0 -16.7%
Jan-2015 1.4 -6.7% 1.4 -12.5%
Feb-2015 1.8 +20.0% 1.7 0.0%
Mar-2015 1.8 +20.0% 1.7 0.0%
Apr-2015 1.7 +6.3% 1.9 +5.6%
May-2015 1.9 +5.6% 1.9 -5.0%
Jun-2015 1.8 -14.3% 1.8 -14.3%
Jul-2015 1.8 -14.3% 1.7 -19.0%
Aug-2015 1.5 -25.0% 1.4 -26.3%
12-Month Avg* 1.7 -1.8% 1.7 -10.8%
Historical Months Supply of Inventory by Month
The inventory of homes for sale at the end of a given month, divided by the average monthly pending sales from the last 12 months.
* Months Supply for all properties from September 2014 through August 2015. This is not the
average of the individual figures above.
Current as of September 11, 2015. All data from the San Francisco MLS. Powered by 10K Research and Marketing. | 14
2.1 2.2
2.0 1.9
1.5
1.4
Single Family Condo/TIC/Coop
August
0.0
2.0
4.0
6.0
8.0
10.0
1-2005 1-2006 1-2007 1-2008 1-2009 1-2010 1-2011 1-2012 1-2013 1-2014 1-2015
Single Family Condo/TIC/Coop
2013 2014 2015
- 26.3%- 13.6%- 25.0%- 4.8%
2013 2014 2015
- 12.5% - 15.4%
All Properties Activity Overview
Key metrics by report month and for year-to-date (YTD) starting from the first of the year.
Key Metrics Historical Sparkbars 8-2014 8-2015 Percent Change YTD 2014 YTD 2015 Percent Change
Current as of September 11, 2015. All data from the San Francisco MLS. Powered by 10K Research and Marketing. | 15
Months Supply 1.9 1.4 - 26.3% -- -- --
Affordability Ratio 44 43 - 3.2%
% of List Price Received 108.4% 112.8% + 4.1% 109.7%
43
76.3% + 3.4%
+ 2.4%
39 - 7.8%
112.3%
% of Properties Sold Over List Price 74.1% 80.0% + 8.0% 73.8%
Active Listings 913 643 - 29.6% --
Avg. Sales Price $1,191,412 $1,311,528 + 10.1% $1,239,446
Days on Market 31 28 - 9.7% 33
$1,150,000 + 17.9%
+ 15.7%
28 - 15.2%
$1,434,533
-- --
Sold Listings 498 411 - 17.5% 3,673 3,414 - 7.1%
Median Sales Price $950,000 $1,150,000 + 21.1% $975,000
- 7.8%
Pending Sales 470 434 - 7.7% 3,732 3,539 - 5.2%
New Listings 498 403 - 19.1% 4,566 4,209
8-2012 8-2013 8-2014 8-2015
8-2012 8-2013 8-2014 8-2015
8-2012 8-2013 8-2014 8-2015
8-2012 8-2013 8-2014 8-2015
8-2012 8-2013 8-2014 8-2015
8-2012 8-2013 8-2014 8-2015
8-2012 8-2013 8-2014 8-2015
8-2012 8-2013 8-2014 8-2015
8-2012 8-2013 8-2014 8-2015
8-2012 8-2013 8-2014 8-2015
8-2012 8-2013 8-2014 8-2015
Activity by District
SF District 1: Northwest (Sea Cliff, Lake, Jordan Park / Laurel Heights, Outer Richmond, Central Richmond, Inner Richmond, Lone Mountain)
SF District 2: Central West (Outer Sunset, Central Sunset, Inner Sunset, Outer Parkside, Parkside, Inner Parkside, Golden Gate Heights)
SF District 3: Southwest (Pine Lake Park, Lake Shore, Merced Manor, Stonestown, Lakeside, Merced Heights, Ingleside, Ingleside Heights, Oceanview)
SF District 4: Twin Peaks W (Forest Hill (& Ext), W Portal, St Francis Wd, Balboa Terr, Mt Dav Manor, Ingleside Terr, Monterey Hts, Wstwd Pk & H'lnds, Shrwd Fst, Miraloma Pk, Dmnd Hts, Mdtwn Terr)
SF District 5: Central (Haight Ashbury, Cole Vly / Prnssus Hts, Clarndn Hts, Corona Hts, Twin Pks, Glen Pk, Noe Vly, Eureka Vly / Dolores Hts, Mission Dolores, Duboce Trngl, Buena Vista / Ashbury Hts)
SF District 6: Central North (Lower Pacific Heights, Anza Vista, Western Addition, North Panhandle, Alamo Square, Hayes Valley)
SF District 7: North (Marina, Cow Hollow, Presidio Heights, Pacific Heights)
SF District 8: Northeast (North Waterfront, North Beach, Russian Hill, Telegraph Hill, Nob Hill, Financial District / Barbary Coast, Downtown, Van Ness / Civic Center, Tenderloin)
SF District 9: Central East (Yerba Buena, South Beach, South of Market, Mission Bay, Inner Mission, Potrero Hill, Central Waterfront / Dogpatch, Bernal Heights)
SF District 10: Southeast (Outer Mission, Mission Terr, Excelsior, Portola, Bayview, Silver Terr, Hunters Pt, Candlestick Pt, Bayview Hts, Little Hollywood, Visitation Vly, Crocker Amazon)
8-2014 8-2015 + / – 8-2014 8-2015 + / – 8-2014 8-2015 + / – 8-2014 8-2015 + / – 8-2014 8-2015 + / –
Single Family
1 SF District 1 36 20 -44.4% 18 14 -22.2% $1,315,000 $1,637,800 +24.5% 24 24 0.0% 2.1 1.1 -47.6%
2 SF District 2 65 47 -27.7% 42 35 -16.7% $921,500 $1,200,000 +30.2% 26 20 -23.1% 1.7 1.3 -23.5%
3 SF District 3 31 28 -9.7% 19 12 -36.8% $750,000 $827,500 +10.3% 29 43 +48.3% 1.9 2.4 +26.3%
4 SF District 4 38 30 -21.1% 24 28 +16.7% $1,295,000 $1,445,500 +11.6% 22 23 +4.5% 1.5 1.1 -26.7%
5 SF District 5 34 25 -26.5% 24 19 -20.8% $1,912,500 $2,000,000 +4.6% 25 26 +4.0% 1.3 1.0 -23.1%
6 SF District 6 7 5 -28.6% 1 4 +300.0% $2,525,000 $2,745,000 +8.7% 26 15 -42.3% 1.9 1.4 -26.3%
7 SF District 7 25 16 -36.0% 10 2 -80.0% $3,575,000 $3,275,000 -8.4% 19 6 -68.4% 2.5 1.9 -24.0%
8 SF District 8 4 5 +25.0% 4 3 -25.0% $2,462,500 $7,650,000 +210.7% 27 189 +600.0% 2.0 2.5 +25.0%
9 SF District 9 39 25 -35.9% 21 25 +19.0% $1,097,000 $1,300,000 +18.5% 34 20 -41.2% 2.0 1.2 -40.0%
10 SF District 10 116 97 -16.4% 48 46 -4.2% $692,500 $800,000 +15.5% 31 30 -3.2% 2.7 2.3 -14.8%
Condo/TIC/Coop
1 SF District 1 29 21 -27.6% 15 16 +6.7% $900,000 $879,000 -2.3% 32 20 -37.5% 2.3 1.6 -30.4%
2 SF District 2 10 9 -10.0% 3 2 -33.3% $800,000 $477,000 -40.4% 26 23 -11.5% 1.9 2.4 +26.3%
3 SF District 3 8 5 -37.5% 1 8 +700.0% $420,000 $666,500 +58.7% 10 20 +100.0% 3.3 0.9 -72.7%
4 SF District 4 6 1 -83.3% 5 13 +160.0% $363,000 $730,000 +101.1% 57 29 -49.1% 1.2 0.2 -83.3%
5 SF District 5 66 37 -43.9% 41 27 -34.1% $1,100,000 $1,250,000 +13.6% 38 34 -10.5% 1.6 1.0 -37.5%
6 SF District 6 56 31 -44.6% 23 20 -13.0% $965,000 $1,196,000 +23.9% 21 29 +38.1% 2.1 1.2 -42.9%
7 SF District 7 40 19 -52.5% 37 15 -59.5% $1,450,000 $1,650,000 +13.8% 31 29 -6.5% 1.5 0.8 -46.7%
8 SF District 8 86 68 -20.9% 36 38 +5.6% $827,500 $1,225,000 +48.0% 34 25 -26.5% 1.9 1.8 -5.3%
9 SF District 9 192 131 -31.8% 118 77 -34.7% $882,500 $1,100,000 +24.6% 33 30 -9.1% 1.9 1.5 -21.1%
10 SF District 10 25 23 -8.0% 8 7 -12.5% $529,000 $730,000 +38.0% 40 28 -30.0% 5.3 4.1 -22.6%
Key metrics by report month for the districts of San Fransisco.
Current as of September 11, 2015. All data from the San Francisco MLS. Powered by 10K Research and Marketing. | 16
Active Listings Sold Listings Median Sales Price Days on Market Months Supply

More Related Content

What's hot

San Francisco Real Estate Market Report August 2014
San Francisco Real Estate Market Report August 2014San Francisco Real Estate Market Report August 2014
San Francisco Real Estate Market Report August 2014
Ronny Budiutama
 

What's hot (20)

San Francisco Market Focus August 2016
San Francisco Market Focus August 2016San Francisco Market Focus August 2016
San Francisco Market Focus August 2016
 
San Francisco Real Estate Market Report August 2014
San Francisco Real Estate Market Report August 2014San Francisco Real Estate Market Report August 2014
San Francisco Real Estate Market Report August 2014
 
San Francisco Market Focus July 2016
San Francisco Market Focus July 2016San Francisco Market Focus July 2016
San Francisco Market Focus July 2016
 
San Francisco Market Focus November 2015
San Francisco Market Focus November 2015San Francisco Market Focus November 2015
San Francisco Market Focus November 2015
 
San Francisco Market Focus April 2015
San Francisco Market Focus April 2015San Francisco Market Focus April 2015
San Francisco Market Focus April 2015
 
San Francisco Market Focus August 2017
San Francisco Market Focus August 2017San Francisco Market Focus August 2017
San Francisco Market Focus August 2017
 
San Francisco Market Focus February 2016
San Francisco Market Focus February 2016San Francisco Market Focus February 2016
San Francisco Market Focus February 2016
 
San Francisco Market Focus January 2016
San Francisco Market Focus January 2016San Francisco Market Focus January 2016
San Francisco Market Focus January 2016
 
San Francisco Real Estate Housing Market January 2017
San Francisco Real Estate Housing Market January 2017San Francisco Real Estate Housing Market January 2017
San Francisco Real Estate Housing Market January 2017
 
San Francisco Market Focus January 2015
San Francisco Market Focus January 2015San Francisco Market Focus January 2015
San Francisco Market Focus January 2015
 
San Francisco Market Focus September 2016
San Francisco Market Focus September 2016San Francisco Market Focus September 2016
San Francisco Market Focus September 2016
 
San Francisco Market Focus November 2016
San Francisco Market Focus November 2016San Francisco Market Focus November 2016
San Francisco Market Focus November 2016
 
San Francisco Market Focus May 2016
San Francisco Market Focus May 2016San Francisco Market Focus May 2016
San Francisco Market Focus May 2016
 
San Francisco Market Focus March 2016
San Francisco Market Focus March 2016San Francisco Market Focus March 2016
San Francisco Market Focus March 2016
 
San Francisco Market Focus March 2014
San Francisco Market Focus March 2014San Francisco Market Focus March 2014
San Francisco Market Focus March 2014
 
San Francisco Market Focus July 2014
San Francisco Market Focus July 2014San Francisco Market Focus July 2014
San Francisco Market Focus July 2014
 
San Francisco Market Focus June 2016
San Francisco Market Focus June 2016San Francisco Market Focus June 2016
San Francisco Market Focus June 2016
 
San Francisco Market Focus Report Aug 2018
San Francisco Market Focus Report Aug 2018San Francisco Market Focus Report Aug 2018
San Francisco Market Focus Report Aug 2018
 
San Francisco Market Focus September 2014
San Francisco Market Focus September 2014San Francisco Market Focus September 2014
San Francisco Market Focus September 2014
 
San Francisco market focus report June 2018
San Francisco market focus report June 2018San Francisco market focus report June 2018
San Francisco market focus report June 2018
 

Viewers also liked

San Francisco South Beach april 2011 april 2013
San Francisco South Beach april 2011   april 2013San Francisco South Beach april 2011   april 2013
San Francisco South Beach april 2011 april 2013
Ronny Budiutama
 
San Francisco Market Focus November 2013
San Francisco Market Focus November 2013San Francisco Market Focus November 2013
San Francisco Market Focus November 2013
Ronny Budiutama
 
the Personal Project by Meg Cavanagh
the Personal Project by Meg Cavanaghthe Personal Project by Meg Cavanagh
the Personal Project by Meg Cavanagh
lindatw
 

Viewers also liked (19)

San Francisco Market Focus Jan 2014
San Francisco Market Focus Jan 2014 San Francisco Market Focus Jan 2014
San Francisco Market Focus Jan 2014
 
San Francisco South Beach april 2011 april 2013
San Francisco South Beach april 2011   april 2013San Francisco South Beach april 2011   april 2013
San Francisco South Beach april 2011 april 2013
 
San Francisco Market Focus November 2013
San Francisco Market Focus November 2013San Francisco Market Focus November 2013
San Francisco Market Focus November 2013
 
San Francisco Market Focus June 2013
San Francisco Market Focus June 2013San Francisco Market Focus June 2013
San Francisco Market Focus June 2013
 
San Francisco Market Focus October 2013
San Francisco Market Focus October 2013San Francisco Market Focus October 2013
San Francisco Market Focus October 2013
 
San Francisco Market Data November 2014
San Francisco Market Data November 2014San Francisco Market Data November 2014
San Francisco Market Data November 2014
 
California housing forecast 2013 (Summary)
California housing forecast 2013 (Summary)California housing forecast 2013 (Summary)
California housing forecast 2013 (Summary)
 
2014 Market Forecast - California Association of Realtors
2014 Market Forecast - California Association of Realtors2014 Market Forecast - California Association of Realtors
2014 Market Forecast - California Association of Realtors
 
San Francisco Market Focus September 2013
San Francisco Market Focus September 2013San Francisco Market Focus September 2013
San Francisco Market Focus September 2013
 
San Francisco asking and sold price property 4 16 2014
San Francisco asking and sold price property 4 16 2014San Francisco asking and sold price property 4 16 2014
San Francisco asking and sold price property 4 16 2014
 
Short sale information for sellers
Short sale information for sellersShort sale information for sellers
Short sale information for sellers
 
San francisco residential april10 april 12
San francisco residential april10   april 12San francisco residential april10   april 12
San francisco residential april10 april 12
 
Guia argentina de tratamiento de la EPOC
Guia argentina de tratamiento de la EPOCGuia argentina de tratamiento de la EPOC
Guia argentina de tratamiento de la EPOC
 
Bluespot - ingyenes mobil kommunikációs rendszer bluetooth felett
Bluespot - ingyenes mobil kommunikációs rendszer bluetooth felettBluespot - ingyenes mobil kommunikációs rendszer bluetooth felett
Bluespot - ingyenes mobil kommunikációs rendszer bluetooth felett
 
Veternička rampa
Veternička rampaVeternička rampa
Veternička rampa
 
Newsbank Access World News
Newsbank Access World NewsNewsbank Access World News
Newsbank Access World News
 
Sifilis
SifilisSifilis
Sifilis
 
the Personal Project by Meg Cavanagh
the Personal Project by Meg Cavanaghthe Personal Project by Meg Cavanagh
the Personal Project by Meg Cavanagh
 
Liga socijaldemokrata Vojvodine
Liga socijaldemokrata VojvodineLiga socijaldemokrata Vojvodine
Liga socijaldemokrata Vojvodine
 

Similar to San Francisco Market Focus August 2015

Similar to San Francisco Market Focus August 2015 (13)

San Francisco Market Focus April 2016
San Francisco Market Focus April 2016San Francisco Market Focus April 2016
San Francisco Market Focus April 2016
 
San Francisco Market Focus August 2017
San Francisco Market Focus August 2017San Francisco Market Focus August 2017
San Francisco Market Focus August 2017
 
August 2015 Greater Boston Real Estate Market Trends Report
August 2015 Greater Boston Real Estate Market Trends ReportAugust 2015 Greater Boston Real Estate Market Trends Report
August 2015 Greater Boston Real Estate Market Trends Report
 
San Francisco Market Focus June 2017
San Francisco Market Focus June 2017San Francisco Market Focus June 2017
San Francisco Market Focus June 2017
 
San Francisco Market Focus Report July
San Francisco Market Focus Report JulySan Francisco Market Focus Report July
San Francisco Market Focus Report July
 
San Francisco Market Focus October 2014
San Francisco Market Focus October 2014San Francisco Market Focus October 2014
San Francisco Market Focus October 2014
 
San Francisco Market Focus February 2014
San Francisco Market Focus February 2014San Francisco Market Focus February 2014
San Francisco Market Focus February 2014
 
San Francisco Market Focus Report September 2018
San Francisco Market Focus Report September 2018San Francisco Market Focus Report September 2018
San Francisco Market Focus Report September 2018
 
San Fancisco Market Focus Report June 2019
San Fancisco Market Focus Report June 2019San Fancisco Market Focus Report June 2019
San Fancisco Market Focus Report June 2019
 
San Francisco Market Focus March 2017
San Francisco Market Focus March 2017San Francisco Market Focus March 2017
San Francisco Market Focus March 2017
 
San Francisco Market Focus Report August 2019
San Francisco Market Focus Report August 2019San Francisco Market Focus Report August 2019
San Francisco Market Focus Report August 2019
 
January 2015 Greater Boston Real Estate Market Trends Report
January 2015 Greater Boston Real Estate Market Trends ReportJanuary 2015 Greater Boston Real Estate Market Trends Report
January 2015 Greater Boston Real Estate Market Trends Report
 
San Francisco Market Focus Report December 2018
San Francisco Market Focus Report December 2018San Francisco Market Focus Report December 2018
San Francisco Market Focus Report December 2018
 

More from Ronny Budiutama

More from Ronny Budiutama (20)

San Francisco Market Update -February 2024
San Francisco Market Update -February 2024San Francisco Market Update -February 2024
San Francisco Market Update -February 2024
 
San Francisco Market Update - March 2024
San Francisco Market Update - March 2024San Francisco Market Update - March 2024
San Francisco Market Update - March 2024
 
San Francisco January 2024 Market Report
San Francisco January 2024 Market ReportSan Francisco January 2024 Market Report
San Francisco January 2024 Market Report
 
San Francisco December 2023 Market Report
San Francisco December 2023 Market ReportSan Francisco December 2023 Market Report
San Francisco December 2023 Market Report
 
San Francisco November 2023 Market Report
San Francisco November 2023 Market ReportSan Francisco November 2023 Market Report
San Francisco November 2023 Market Report
 
2023 Annual San Francisco Housing Market
2023 Annual San Francisco Housing Market2023 Annual San Francisco Housing Market
2023 Annual San Francisco Housing Market
 
October 2023 Report: San Francisco Real Estate Market Insights
October 2023 Report: San Francisco Real Estate Market InsightsOctober 2023 Report: San Francisco Real Estate Market Insights
October 2023 Report: San Francisco Real Estate Market Insights
 
CA Weekly MLS Market Data Report - August 2023
CA Weekly MLS Market Data Report - August 2023CA Weekly MLS Market Data Report - August 2023
CA Weekly MLS Market Data Report - August 2023
 
San Francisco Market Report July 2023.pdf
San Francisco Market Report July 2023.pdfSan Francisco Market Report July 2023.pdf
San Francisco Market Report July 2023.pdf
 
San Francisco May 2023 Market Report.pdf
San Francisco May 2023 Market Report.pdfSan Francisco May 2023 Market Report.pdf
San Francisco May 2023 Market Report.pdf
 
San Francisco June 2023 Market Report.pdf
San Francisco June 2023 Market Report.pdfSan Francisco June 2023 Market Report.pdf
San Francisco June 2023 Market Report.pdf
 
San Francisco Market Report March 2023.pdf
San Francisco Market Report March 2023.pdfSan Francisco Market Report March 2023.pdf
San Francisco Market Report March 2023.pdf
 
San Francisco Market Report February 2023
San Francisco Market Report February 2023San Francisco Market Report February 2023
San Francisco Market Report February 2023
 
San Francisco Market Report January 2023.pdf
San Francisco Market Report January 2023.pdfSan Francisco Market Report January 2023.pdf
San Francisco Market Report January 2023.pdf
 
Annual Report on the San Francisco County Housing Market.pdf
Annual Report on the San Francisco County Housing Market.pdfAnnual Report on the San Francisco County Housing Market.pdf
Annual Report on the San Francisco County Housing Market.pdf
 
San Francisco Market Report December 2022.pdf
San Francisco Market Report December 2022.pdfSan Francisco Market Report December 2022.pdf
San Francisco Market Report December 2022.pdf
 
San Francisco Market Report November 2022.pdf
San Francisco Market Report November 2022.pdfSan Francisco Market Report November 2022.pdf
San Francisco Market Report November 2022.pdf
 
San Francisco Market Report October 2022.pdf
San Francisco Market Report October 2022.pdfSan Francisco Market Report October 2022.pdf
San Francisco Market Report October 2022.pdf
 
San Francisco Market Report September 2022.pdf
San Francisco Market Report September 2022.pdfSan Francisco Market Report September 2022.pdf
San Francisco Market Report September 2022.pdf
 
San Francisco Market Report August 2022.pdf
San Francisco Market Report August 2022.pdfSan Francisco Market Report August 2022.pdf
San Francisco Market Report August 2022.pdf
 

Recently uploaded

Low Rate Call girls in Sant Nagar{Delhi }8447779280} Service Escorts In South...
Low Rate Call girls in Sant Nagar{Delhi }8447779280} Service Escorts In South...Low Rate Call girls in Sant Nagar{Delhi }8447779280} Service Escorts In South...
Low Rate Call girls in Sant Nagar{Delhi }8447779280} Service Escorts In South...
asmaqueen5
 
Cheap Rate ✨➥9582086666▻✨Call Girls In Gurgaon Sector 11 (Gurgaon)
Cheap Rate ✨➥9582086666▻✨Call Girls In Gurgaon Sector 11 (Gurgaon)Cheap Rate ✨➥9582086666▻✨Call Girls In Gurgaon Sector 11 (Gurgaon)
Cheap Rate ✨➥9582086666▻✨Call Girls In Gurgaon Sector 11 (Gurgaon)
delhi24hrs1
 
Cheap Rate ✨➥9582086666▻✨Call Girls In Gurgaon Sector 34 (Gurgaon)
Cheap Rate ✨➥9582086666▻✨Call Girls In Gurgaon Sector 34 (Gurgaon)Cheap Rate ✨➥9582086666▻✨Call Girls In Gurgaon Sector 34 (Gurgaon)
Cheap Rate ✨➥9582086666▻✨Call Girls In Gurgaon Sector 34 (Gurgaon)
delhi24hrs1
 
Call girls In Rana Pratap Bagh {Delhi ↫8447779280↬Escort Service (Delhi)
Call girls In Rana Pratap Bagh {Delhi ↫8447779280↬Escort Service (Delhi)Call girls In Rana Pratap Bagh {Delhi ↫8447779280↬Escort Service (Delhi)
Call girls In Rana Pratap Bagh {Delhi ↫8447779280↬Escort Service (Delhi)
asmaqueen5
 
Low Density Living New Project in BPTP THE AMAARIO Sector 37D Gurgaon Haryana...
Low Density Living New Project in BPTP THE AMAARIO Sector 37D Gurgaon Haryana...Low Density Living New Project in BPTP THE AMAARIO Sector 37D Gurgaon Haryana...
Low Density Living New Project in BPTP THE AMAARIO Sector 37D Gurgaon Haryana...
ApartmentWala1
 
Low Rate ✨➥9582086666▻✨Call Girls In Gurgaon Sector 23 (Gurgaon)
Low Rate ✨➥9582086666▻✨Call Girls In Gurgaon Sector 23 (Gurgaon)Low Rate ✨➥9582086666▻✨Call Girls In Gurgaon Sector 23 (Gurgaon)
Low Rate ✨➥9582086666▻✨Call Girls In Gurgaon Sector 23 (Gurgaon)
delhi24hrs1
 
Listing Turkey - 2024 - May Featured Portfolio
Listing Turkey - 2024 - May Featured PortfolioListing Turkey - 2024 - May Featured Portfolio
Listing Turkey - 2024 - May Featured Portfolio
Listing Turkey
 
Call Girls In Sarai Rohilla ☎️8447779280{Sarai Rohilla Escort Service In Delh...
Call Girls In Sarai Rohilla ☎️8447779280{Sarai Rohilla Escort Service In Delh...Call Girls In Sarai Rohilla ☎️8447779280{Sarai Rohilla Escort Service In Delh...
Call Girls In Sarai Rohilla ☎️8447779280{Sarai Rohilla Escort Service In Delh...
asmaqueen5
 
Low Rate ✨➥9582086666▻✨Call Girls In Gurgaon Sector 35 (Gurgaon)
Low Rate ✨➥9582086666▻✨Call Girls In Gurgaon Sector 35 (Gurgaon)Low Rate ✨➥9582086666▻✨Call Girls In Gurgaon Sector 35 (Gurgaon)
Low Rate ✨➥9582086666▻✨Call Girls In Gurgaon Sector 35 (Gurgaon)
delhi24hrs1
 
BPTP THE AMAARIO Luxury Project Invest Like Royalty in Sector 37D Gurgaon Dwa...
BPTP THE AMAARIO Luxury Project Invest Like Royalty in Sector 37D Gurgaon Dwa...BPTP THE AMAARIO Luxury Project Invest Like Royalty in Sector 37D Gurgaon Dwa...
BPTP THE AMAARIO Luxury Project Invest Like Royalty in Sector 37D Gurgaon Dwa...
ApartmentWala1
 

Recently uploaded (20)

Low Rate Call girls in Sant Nagar{Delhi }8447779280} Service Escorts In South...
Low Rate Call girls in Sant Nagar{Delhi }8447779280} Service Escorts In South...Low Rate Call girls in Sant Nagar{Delhi }8447779280} Service Escorts In South...
Low Rate Call girls in Sant Nagar{Delhi }8447779280} Service Escorts In South...
 
Best Interior Design Services in Haldwani
Best Interior Design Services in HaldwaniBest Interior Design Services in Haldwani
Best Interior Design Services in Haldwani
 
Cheap Rate ✨➥9582086666▻✨Call Girls In Gurgaon Sector 11 (Gurgaon)
Cheap Rate ✨➥9582086666▻✨Call Girls In Gurgaon Sector 11 (Gurgaon)Cheap Rate ✨➥9582086666▻✨Call Girls In Gurgaon Sector 11 (Gurgaon)
Cheap Rate ✨➥9582086666▻✨Call Girls In Gurgaon Sector 11 (Gurgaon)
 
Cheap Rate ✨➥9582086666▻✨Call Girls In Gurgaon Sector 34 (Gurgaon)
Cheap Rate ✨➥9582086666▻✨Call Girls In Gurgaon Sector 34 (Gurgaon)Cheap Rate ✨➥9582086666▻✨Call Girls In Gurgaon Sector 34 (Gurgaon)
Cheap Rate ✨➥9582086666▻✨Call Girls In Gurgaon Sector 34 (Gurgaon)
 
Call girls In Rana Pratap Bagh {Delhi ↫8447779280↬Escort Service (Delhi)
Call girls In Rana Pratap Bagh {Delhi ↫8447779280↬Escort Service (Delhi)Call girls In Rana Pratap Bagh {Delhi ↫8447779280↬Escort Service (Delhi)
Call girls In Rana Pratap Bagh {Delhi ↫8447779280↬Escort Service (Delhi)
 
Low Density Living New Project in BPTP THE AMAARIO Sector 37D Gurgaon Haryana...
Low Density Living New Project in BPTP THE AMAARIO Sector 37D Gurgaon Haryana...Low Density Living New Project in BPTP THE AMAARIO Sector 37D Gurgaon Haryana...
Low Density Living New Project in BPTP THE AMAARIO Sector 37D Gurgaon Haryana...
 
Yashwin Enchante Uppar Kharadi Pune E-Brochue.pdf
Yashwin Enchante Uppar Kharadi Pune  E-Brochue.pdfYashwin Enchante Uppar Kharadi Pune  E-Brochue.pdf
Yashwin Enchante Uppar Kharadi Pune E-Brochue.pdf
 
Parksville 96 Surrey Floor Plans May 2024
Parksville 96 Surrey Floor Plans May 2024Parksville 96 Surrey Floor Plans May 2024
Parksville 96 Surrey Floor Plans May 2024
 
Low Rate ✨➥9582086666▻✨Call Girls In Gurgaon Sector 23 (Gurgaon)
Low Rate ✨➥9582086666▻✨Call Girls In Gurgaon Sector 23 (Gurgaon)Low Rate ✨➥9582086666▻✨Call Girls In Gurgaon Sector 23 (Gurgaon)
Low Rate ✨➥9582086666▻✨Call Girls In Gurgaon Sector 23 (Gurgaon)
 
Yedi Mavi TOBB Zeytinburnu - Listing Turkey
Yedi Mavi TOBB Zeytinburnu - Listing TurkeyYedi Mavi TOBB Zeytinburnu - Listing Turkey
Yedi Mavi TOBB Zeytinburnu - Listing Turkey
 
Listing Turkey - 2024 - May Featured Portfolio
Listing Turkey - 2024 - May Featured PortfolioListing Turkey - 2024 - May Featured Portfolio
Listing Turkey - 2024 - May Featured Portfolio
 
Ganga Platinum Kharadi Pune brochure.pdf
Ganga Platinum Kharadi Pune brochure.pdfGanga Platinum Kharadi Pune brochure.pdf
Ganga Platinum Kharadi Pune brochure.pdf
 
Kohinoor Teiko Hinjewadi Phase 2 Pune E-Brochure.pdf
Kohinoor Teiko Hinjewadi Phase 2 Pune  E-Brochure.pdfKohinoor Teiko Hinjewadi Phase 2 Pune  E-Brochure.pdf
Kohinoor Teiko Hinjewadi Phase 2 Pune E-Brochure.pdf
 
Call Girls In Sarai Rohilla ☎️8447779280{Sarai Rohilla Escort Service In Delh...
Call Girls In Sarai Rohilla ☎️8447779280{Sarai Rohilla Escort Service In Delh...Call Girls In Sarai Rohilla ☎️8447779280{Sarai Rohilla Escort Service In Delh...
Call Girls In Sarai Rohilla ☎️8447779280{Sarai Rohilla Escort Service In Delh...
 
Low Rate ✨➥9582086666▻✨Call Girls In Gurgaon Sector 35 (Gurgaon)
Low Rate ✨➥9582086666▻✨Call Girls In Gurgaon Sector 35 (Gurgaon)Low Rate ✨➥9582086666▻✨Call Girls In Gurgaon Sector 35 (Gurgaon)
Low Rate ✨➥9582086666▻✨Call Girls In Gurgaon Sector 35 (Gurgaon)
 
Real Estate Finance and Investments (2019).pdf
Real Estate Finance and Investments (2019).pdfReal Estate Finance and Investments (2019).pdf
Real Estate Finance and Investments (2019).pdf
 
Kalpataru Exquisite Wakad Pune E-Brochure.pdf
Kalpataru Exquisite Wakad Pune  E-Brochure.pdfKalpataru Exquisite Wakad Pune  E-Brochure.pdf
Kalpataru Exquisite Wakad Pune E-Brochure.pdf
 
BPTP THE AMAARIO Luxury Project Invest Like Royalty in Sector 37D Gurgaon Dwa...
BPTP THE AMAARIO Luxury Project Invest Like Royalty in Sector 37D Gurgaon Dwa...BPTP THE AMAARIO Luxury Project Invest Like Royalty in Sector 37D Gurgaon Dwa...
BPTP THE AMAARIO Luxury Project Invest Like Royalty in Sector 37D Gurgaon Dwa...
 
Nyati Elite NIBM Road Pune E Brochure.pdf
Nyati Elite NIBM Road Pune E Brochure.pdfNyati Elite NIBM Road Pune E Brochure.pdf
Nyati Elite NIBM Road Pune E Brochure.pdf
 
Madhugiri Boucher Managed Farmland (knx)
Madhugiri Boucher Managed Farmland (knx)Madhugiri Boucher Managed Farmland (knx)
Madhugiri Boucher Managed Farmland (knx)
 

San Francisco Market Focus August 2015

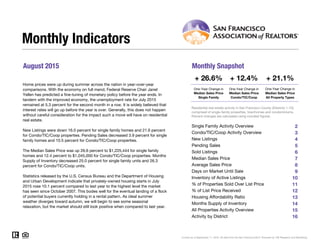
  • 1. August 2015 Monthly Snapshot One-Year Change in One-Year Change in Median Sales Price Single Family Median Sales Price Condo/TIC/Coop 2 3 4 5 6 7 8 9 10 11 12 13 14 15 16 Monthly Indicators + 26.6% + 12.4% + 21.1% One-Year Change in Home prices were up during summer across the nation in year-over-year comparisons. With the economy on full mend, Federal Reserve Chair Janet Yellen has predicted a fine-tuning of monetary policy before the year ends. In tandem with the improved economy, the unemployment rate for July 2015 remained at 5.3 percent for the second month in a row. It is widely believed that interest rates will go up before the year is over. Generally, this does not happen without careful consideration for the impact such a move will have on residential real estate. New Listings were down 16.0 percent for single family homes and 21.6 percent for Condo/TIC/Coop properties. Pending Sales decreased 3.9 percent for single family homes and 10.5 percent for Condo/TIC/Coop properties. The Median Sales Price was up 26.6 percent to $1,225,444 for single family homes and 12.4 percent to $1,045,000 for Condo/TIC/Coop properties. Months Supply of Inventory decreased 25.0 percent for single family units and 26.3 percent for Condo/TIC/Coop units. Statistics released by the U.S. Census Bureau and the Department of Housing and Urban Development indicate that privately-owned housing starts in July 2015 rose 10.1 percent compared to last year to the highest level the market has seen since October 2007. This bodes well for the eventual landing of a flock of potential buyers currently holding in a rental pattern. As ideal summer weather diverges toward autumn, we will begin to see some seasonal relaxation, but the market should still look positive when compared to last year. Median Sales Price All Property Types Residential real estate activity in San Francisco County (Districts 1-10), comprised of single-family properties, townhomes and condominiums. Percent changes are calculated using rounded figures. Single Family Activity Overview Months Supply of Inventory Current as of September 11, 2015. All data from the San Francisco MLS. Powered by 10K Research and Marketing. Condo/TIC/Coop Activity Overview Inventory of Active Listings % of Properties Sold Over List Price % of List Price Received Housing Affordability Ratio All Properties Activity Overview New Listings Pending Sales Sold Listings Median Sales Price Average Sales Price Days on Market Until Sale Activity by District
  • 2. Single Family Activity Overview Key metrics by report month and for year-to-date (YTD) starting from the first of the year. Key Metrics Historical Sparkbars 8-2014 8-2015 Percent Change YTD 2014 YTD 2015 Percent Change Current as of September 11, 2015. All data from the San Francisco MLS. Powered by 10K Research and Marketing. | 2 Months Supply 2.0 1.5 - 25.0% -- -- -- Affordability Ratio 47 39 - 17.0% % of List Price Received 111.2% 117.5% + 5.7% 112.8% 43 82.7% + 2.4% + 2.9% 39 - 9.3% 116.1% % of Properties Sold Over List Price 80.6% 89.9% + 11.5% 80.8% Active Listings 395 298 - 24.6% -- Avg. Sales Price $1,326,578 $1,489,918 + 12.3% $1,431,035 Days on Market 27 28 + 3.7% 31 26 - 16.1% $1,671,608 -- -- Median Sales Price $968,000 $1,225,444 + 26.6% $1,050,000 Sold Listings 211 188 - 10.9% 1,534 New Listings 225 189 - 16.0% 1,917 Pending Sales 204 196 - 3.9% - 1.8%1,566 1,538 - 3.0%1,859 1,486 - 3.1% $1,250,000 + 19.0% + 16.8% 8-2012 8-2013 8-2014 8-2015 8-2012 8-2013 8-2014 8-2015 8-2012 8-2013 8-2014 8-2015 8-2012 8-2013 8-2014 8-2015 8-2012 8-2013 8-2014 8-2015 8-2012 8-2013 8-2014 8-2015 8-2012 8-2013 8-2014 8-2015 8-2012 8-2013 8-2014 8-2015 8-2012 8-2013 8-2014 8-2015 8-2012 8-2013 8-2014 8-2015 8-2012 8-2013 8-2014 8-2015
  • 3. Condo/TIC/Coop Activity Overview Key metrics by report month and for year-to-date (YTD) starting from the first of the year. Key Metrics Historical Sparkbars 8-2014 8-2015 Percent Change YTD 2014 YTD 2015 Percent Change Current as of September 11, 2015. All data from the San Francisco MLS. Powered by 10K Research and Marketing. | 3 Months Supply 1.9 1.4 - 26.3% -- -- -- Affordability Ratio 56 53 - 5.4% % of List Price Received 106.4% 108.8% + 2.3% 107.5% 56 71.4% + 3.8% + 1.7% 52 - 7.1% 109.3% % of Properties Sold Over List Price 69.3% 71.7% + 3.5% 68.8% Active Listings 518 345 - 33.4% -- Avg. Sales Price $1,092,040 $1,161,136 + 6.3% $1,101,981 Days on Market 33 28 - 15.2% 34 $1,069,500 + 14.2% + 13.6% 30 - 11.8% $1,251,808 -- -- Sold Listings 287 223 - 22.3% 2,139 1,928 - 9.9% Median Sales Price $930,000 $1,045,000 + 12.4% $936,500 - 11.3% Pending Sales 266 238 - 10.5% 2,166 2,001 - 7.6% New Listings 273 214 - 21.6% 2,649 2,350 8-2012 8-2013 8-2014 8-2015 8-2012 8-2013 8-2014 8-2015 8-2012 8-2013 8-2014 8-2015 8-2012 8-2013 8-2014 8-2015 8-2012 8-2013 8-2014 8-2015 8-2012 8-2013 8-2014 8-2015 8-2012 8-2013 8-2014 8-2015 8-2012 8-2013 8-2014 8-2015 8-2012 8-2013 8-2014 8-2015 8-2012 8-2013 8-2014 8-2015 8-2012 8-2013 8-2014 8-2015
  • 4. New Listings New Listings Single Family Year-Over-Year Change Condo/TIC/ Coop Year-Over-Year Change Sep-2014 349 +19.5% 389 -13.0% Oct-2014 250 -9.1% 335 +4.0% Nov-2014 128 -23.8% 167 -12.6% Dec-2014 77 -30.0% 110 -1.8% Jan-2015 199 -2.0% 265 -20.7% Feb-2015 236 +21.6% 296 -2.6% Mar-2015 249 +5.5% 331 +9.6% Apr-2015 247 +2.5% 350 -4.6% May-2015 254 -7.6% 327 -8.4% Jun-2015 246 -11.2% 304 -15.3% Jul-2015 239 -10.2% 263 -25.5% Aug-2015 189 -16.0% 214 -21.6% 12-Month Avg 222 -3.6% 279 -9.9% Historical New Listings by Month Current as of September 11, 2015. All data from the San Francisco MLS. Powered by 10K Research and Marketing. | 4 A count of the properties that have been newly listed on the market in a given month. 272 340 225 273 189 214 Single Family Condo/TIC/Coop August 0 100 200 300 400 500 600 700 1-2005 1-2006 1-2007 1-2008 1-2009 1-2010 1-2011 1-2012 1-2013 1-2014 1-2015 Single Family Condo/TIC/Coop 2,129 2,807 1,917 2,649 1,859 2,350 Single Family Condo/TIC/Coop Year to Date 2013 2014 2015 - 21.6%- 19.7%- 16.0%- 17.3% - 5.6%- 3.0%- 10.0% - 11.3% 2013 2014 2015 2013 2014 2015 2013 2014 2015 + 7.1% + 2.1% + 9.1%+ 8.6%
  • 5. Pending Sales Pending Sales Single Family Year-Over-Year Change Condo/TIC/ Coop Year-Over-Year Change Sep-2014 213 +1.9% 268 +5.5% Oct-2014 267 +9.4% 301 -11.5% Nov-2014 210 -5.0% 218 -19.0% Dec-2014 135 -21.1% 208 +3.0% Jan-2015 109 -17.4% 149 -18.6% Feb-2015 138 -16.4% 213 -15.1% Mar-2015 232 +6.9% 292 -1.0% Apr-2015 225 +8.7% 279 -4.8% May-2015 208 -2.8% 293 -1.0% Jun-2015 220 +10.0% 289 -5.9% Jul-2015 210 -7.5% 248 -9.8% Aug-2015 196 -3.9% 238 -10.5% 12-Month Avg 197 -2.0% 250 -7.3% Historical Pending Sales by Month A count of the properties on which offers have been accepted in a given month. Current as of September 11, 2015. All data from the San Francisco MLS. Powered by 10K Research and Marketing. | 5 229 302 204 266 196 238 Single Family Condo/TIC/Coop August 0 100 200 300 400 1-2005 1-2006 1-2007 1-2008 1-2009 1-2010 1-2011 1-2012 1-2013 1-2014 1-2015 Single Family Condo/TIC/Coop 1,777 2,285 1,566 2,166 1,538 2,001 Single Family Condo/TIC/Coop Year to Date 2013 2014 2015 - 10.5%- 11.9%- 3.9%- 10.9% - 5.2%- 1.8%- 11.9% - 7.6% 2013 2014 2015 2013 2014 2015 2013 2014 2015 + 1.3% + 1.1% + 4.6%+ 4.5%
  • 6. Sold Listings Sold Listings Single Family Year-Over-Year Change Condo/TIC/ Coop Year-Over-Year Change Sep-2014 196 +3.7% 248 +7.8% Oct-2014 278 +8.6% 319 -5.1% Nov-2014 201 -16.3% 216 -23.9% Dec-2014 195 -8.9% 227 -7.7% Jan-2015 110 -17.3% 158 -11.2% Feb-2015 128 -18.5% 161 -27.5% Mar-2015 189 +6.8% 264 -1.5% Apr-2015 216 +4.9% 287 -12.0% May-2015 204 -11.3% 286 -3.1% Jun-2015 216 +12.5% 284 -0.7% Jul-2015 235 +3.1% 265 -4.3% Aug-2015 188 -10.9% 223 -22.3% 12-Month Avg 196 -3.2% 245 -9.2% Historical Sold Listings by Month A count of the actual sales that closed in a given month. Current as of September 11, 2015. All data from the San Francisco MLS. Powered by 10K Research and Marketing. | 6 238 303 211 287 188 223 Single Family Condo/TIC/Coop August 0 100 200 300 400 1-2005 1-2006 1-2007 1-2008 1-2009 1-2010 1-2011 1-2012 1-2013 1-2014 1-2015 Single Family Condo/TIC/Coop 1,760 2,237 1,534 2,139 1,486 1,928 Single Family Condo/TIC/Coop Year to Date 2013 2014 2015 - 22.3%- 5.3%- 10.9%- 11.3% - 4.4%- 3.1%- 12.8% - 9.9% 2013 2014 2015 2013 2014 2015 2013 2014 2015 - 1.7% + 2.4% + 4.3%- 6.2%
  • 7. Median Sales Price Median Sales Price Single Family Year-Over-Year Change Condo/TIC/ Coop Year-Over-Year Change Sep-2014 $1,037,500 +11.8% $915,000 +10.8% Oct-2014 $1,190,000 +31.5% $955,000 +10.5% Nov-2014 $1,126,000 +17.7% $1,020,000 +23.5% Dec-2014 $1,075,000 +14.1% $925,000 +21.3% Jan-2015 $975,000 +5.4% $899,500 -5.3% Feb-2015 $1,124,000 +7.0% $1,100,000 +17.4% Mar-2015 $1,250,000 +28.2% $1,100,000 +14.0% Apr-2015 $1,320,000 +20.0% $1,080,000 +19.3% May-2015 $1,393,500 +27.8% $1,112,500 +18.4% Jun-2015 $1,300,000 +10.6% $1,100,000 +15.2% Jul-2015 $1,280,000 +18.4% $1,025,018 +7.9% Aug-2015 $1,225,444 +26.6% $1,045,000 +12.4% 12-Month Avg* $1,200,000 +20.0% $1,020,000 +13.3% Historical Median Sales Price by Month Point at which half of the sales sold for more and half sold for less, not accounting for seller concessions, in a given month. * Median Sales Price for all properties from September 2014 through August 2015. This is not the average of the individual figures above. Current as of September 11, 2015. All data from the San Francisco MLS. Powered by 10K Research and Marketing. | 7 $934,000 $810,000 $968,000 $930,000 $1,225,444 $1,045,000 Single Family Condo/TIC/Coop August $400,000 $600,000 $800,000 $1,000,000 $1,200,000 $1,400,000 1-2005 1-2006 1-2007 1-2008 1-2009 1-2010 1-2011 1-2012 1-2013 1-2014 1-2015 Single Family Condo/TIC/Coop $900,000 $818,000 $1,050,000 $936,500 $1,250,000 $1,069,500 Single Family Condo/TIC/Coop Year to Date 2013 2014 2015 + 12.4%+ 14.8%+ 26.6%+ 3.6% + 14.5%+ 19.0%+ 16.7% + 14.2% 2013 2014 2015 2013 2014 2015 2013 2014 2015 + 22.5% + 21.7% + 18.7%+ 11.7%
  • 8. Average Sales Price Avg. Sales Price Single Family Year-Over-Year Change Condo/TIC/ Coop Year-Over-Year Change Sep-2014 $1,321,054 +7.2% $1,015,335 +8.2% Oct-2014 $1,670,076 +23.9% $1,067,327 +5.9% Nov-2014 $1,460,978 +10.3% $1,121,938 +14.6% Dec-2014 $1,343,423 -1.6% $1,144,474 +12.2% Jan-2015 $1,279,424 +3.3% $1,094,504 -1.3% Feb-2015 $1,559,194 +6.6% $1,204,301 +21.1% Mar-2015 $1,748,561 +25.6% $1,300,064 +22.7% Apr-2015 $1,772,557 +17.2% $1,319,922 +18.6% May-2015 $1,827,245 +25.2% $1,329,588 +14.6% Jun-2015 $1,793,511 +12.3% $1,284,151 +10.1% Jul-2015 $1,659,935 +18.0% $1,210,314 +10.6% Aug-2015 $1,489,918 +12.3% $1,161,136 +6.3% 12-Month Avg* $1,597,189 +14.9% $1,193,976 +12.3% Historical Average Sales Price by Month Average sales price for all closed sales, not accounting for seller concessions, in a given month. * Avg. Sales Price for all properties from September 2014 through August 2015. This is not the average of the individual figures above. Current as of September 11, 2015. All data from the San Francisco MLS. Powered by 10K Research and Marketing. | 8 $1,301,708 $929,734 $1,326,578 $1,092,040 $1,489,918 $1,161,136 Single Family Condo/TIC/Coop August $600,000 $800,000 $1,000,000 $1,200,000 $1,400,000 $1,600,000 $1,800,000 $2,000,000 1-2005 1-2006 1-2007 1-2008 1-2009 1-2010 1-2011 1-2012 1-2013 1-2014 1-2015 Single Family Condo/TIC/Coop $1,277,106 $949,301 $1,431,035 $1,101,981 $1,671,608 $1,251,808 Single Family Condo/TIC/Coop Year to Date 2013 2014 2015 + 6.3%+ 17.5%+ 12.3%+ 1.9% + 16.1%+ 16.8%+ 12.1% + 13.6% 2013 2014 2015 2013 2014 2015 2013 2014 2015 + 31.8% + 20.8% + 22.1%+ 15.4%
  • 9. Days on Market Until Sale Days on Market Single Family Year-Over-Year Change Condo/TIC/ Coop Year-Over-Year Change Sep-2014 26 -13.3% 37 +5.7% Oct-2014 30 -11.8% 37 0.0% Nov-2014 31 -6.1% 38 -5.0% Dec-2014 38 -7.3% 47 +6.8% Jan-2015 43 +7.5% 49 -2.0% Feb-2015 27 -28.9% 29 -23.7% Mar-2015 24 -25.0% 28 -9.7% Apr-2015 23 -34.3% 31 0.0% May-2015 23 -4.2% 28 0.0% Jun-2015 26 -3.7% 26 -21.2% Jul-2015 25 -16.7% 29 -12.1% Aug-2015 28 +3.7% 28 -15.2% 12-Month Avg* 28 -12.7% 33 -6.3% Historical Days on Market Until Sale by Month Average number of days between when a property is listed and when an offer is accepted in a given month. * Days on Market for all properties from September 2014 through August 2015. This is not the average of the individual figures above. Current as of September 11, 2015. All data from the San Francisco MLS. Powered by 10K Research and Marketing. | 9 37 38 27 33 28 28 Single Family Condo/TIC/Coop August 20 40 60 80 100 120 1-2005 1-2006 1-2007 1-2008 1-2009 1-2010 1-2011 1-2012 1-2013 1-2014 1-2015 Single Family Condo/TIC/Coop 36 40 31 34 26 30 Single Family Condo/TIC/Coop Year to Date 2013 2014 2015 - 15.2%- 13.2%+ 3.7%- 27.0% - 15.0%- 16.1%- 13.9% - 11.8% 2013 2014 2015 2013 2014 2015 2013 2014 2015 - 26.0% - 35.7% - 38.5%- 29.6%
  • 10. Inventory of Active Listings Active Listings Single Family Year-Over-Year Change Condo/TIC/ Coop Year-Over-Year Change Sep-2014 490 -1.8% 581 -19.0% Oct-2014 426 -12.5% 561 -11.9% Nov-2014 316 -19.2% 458 -8.9% Dec-2014 206 -22.8% 272 -18.1% Jan-2015 278 -11.5% 371 -18.8% Feb-2015 355 +10.6% 430 -11.5% Mar-2015 352 +8.3% 443 -5.1% Apr-2015 346 +3.3% 480 -7.0% May-2015 369 -1.3% 475 -14.1% Jun-2015 364 -13.3% 448 -21.7% Jul-2015 353 -16.5% 424 -27.4% Aug-2015 298 -24.6% 345 -33.4% 12-Month Avg* 346 -8.7% 441 -16.6% Historical Inventory of Active Listings by Month The number of properties available for sale in active status at the end of a given month. * Active Listings for all properties from September 2014 through August 2015. This is not the average of the individual figures above. Current as of September 11, 2015. All data from the San Francisco MLS. Powered by 10K Research and Marketing. | 10 466 588 395 518 298 345 Single Family Condo/TIC/Coop August 200 400 600 800 1,000 1,200 1,400 1,600 1-2005 1-2006 1-2007 1-2008 1-2009 1-2010 1-2011 1-2012 1-2013 1-2014 1-2015 Single Family Condo/TIC/Coop 2013 2014 2015 - 33.4%- 11.9%- 24.6%- 15.2% 2013 2014 2015 - 7.5% - 6.8%
  • 11. % of Properties Sold Over List Price % of Properties Sold Over List Price Single Family Year-Over-Year Change Condo/TIC/ Coop Year-Over-Year Change Sep-2014 77.6% -1.5% 66.5% -3.2% Oct-2014 82.4% +2.0% 69.3% +2.5% Nov-2014 80.0% +3.2% 67.1% +7.7% Dec-2014 73.8% +14.4% 55.5% +2.6% Jan-2015 64.5% -1.4% 58.2% +32.0% Feb-2015 82.0% +8.2% 65.8% -4.5% Mar-2015 76.7% -1.7% 68.6% -4.2% Apr-2015 84.3% -1.9% 71.4% +2.1% May-2015 83.8% -3.7% 76.6% +0.4% Jun-2015 87.0% +9.8% 76.1% +10.0% Jul-2015 84.3% -2.0% 74.7% +4.5% Aug-2015 89.9% +11.5% 71.7% +3.5% 12-Month Avg 81.3% +3.1% 69.2% +3.4% Historical % of Properties Sold Over List Price by Month Percentage found when dividing the number of properties sold by properties sold over its original list price, not accounting for seller concessions. * % of Properties Sold Over List Price for all properties from September 2014 through August 2015. This is not the average of the individual figures above. Current as of September 11, 2015. All data from the San Francisco MLS. Powered by 10K Research and Marketing. | 11 75.2% 66.0% 80.6% 69.3% 89.9% 71.7% Single Family Condo/TIC/Coop August 0.0% 20.0% 40.0% 60.0% 80.0% 100.0% 1-2005 1-2006 1-2007 1-2008 1-2009 1-2010 1-2011 1-2012 1-2013 1-2014 1-2015 Single Family Condo/TIC/Coop 76.1% 65.1% 80.8% 68.8% 82.7% 71.4% Single Family Condo/TIC/Coop Year to Date 2013 2014 2015 + 3.5%+ 5.0%+ 11.5%+ 7.2% + 5.7%+ 2.4%+ 6.2% + 3.8% 2013 2014 2015 2013 2014 2015 2013 2014 2015 + 13.8% + 35.9% + 56.5%+ 45.1%
  • 12. % of List Price Received % of List Price Received Single Family Year-Over-Year Change Condo/TIC/ Coop Year-Over-Year Change Sep-2014 111.7% +1.7% 105.2% -0.5% Oct-2014 113.0% +2.5% 106.9% +1.3% Nov-2014 111.3% +2.4% 106.4% +1.3% Dec-2014 109.0% +2.1% 103.5% +0.1% Jan-2015 107.9% +0.2% 104.9% +1.8% Feb-2015 114.6% +4.0% 108.1% +1.8% Mar-2015 113.7% +1.7% 109.6% +1.2% Apr-2015 117.0% +1.7% 109.4% +1.1% May-2015 118.5% +2.4% 111.7% +2.4% Jun-2015 117.3% +3.1% 110.3% +1.8% Jul-2015 117.8% +3.2% 109.4% +1.2% Aug-2015 117.5% +5.7% 108.8% +2.3% 12-Month Avg* 114.4% +2.7% 108.1% +1.4% Historical % of List Price Received by Month Percentage found when dividing a property’s sales price by its most recent list price, then taking the average for all properties sold in a given month, not accounting for seller concessions. * % of List Price Received for all properties from September 2014 through August 2015. This is not the average of the individual figures above. Current as of September 11, 2015. All data from the San Francisco MLS. Powered by 10K Research and Marketing. | 12 110.1% 105.5% 111.2% 106.4% 117.5% 108.8% Single Family Condo/TIC/Coop August 110.2% 105.5% 112.8% 107.5% 116.1% 109.3% Single Family Condo/TIC/Coop Year to Date 90.0% 100.0% 110.0% 120.0% 130.0% 1-2005 1-2006 1-2007 1-2008 1-2009 1-2010 1-2011 1-2012 1-2013 1-2014 1-2015 Single Family Condo/TIC/Coop 2013 2014 2015 + 2.3%+ 0.9%+ 5.7%+ 1.0% 2013 2014 2015 + 4.1% + 3.4% 2013 2014 2015 + 1.7%+ 1.9%+ 2.9%+ 2.4% 2013 2014 2015 + 6.4% + 4.5%
  • 13. Housing Affordability Ratio Affordability Ratio Single Family Year-Over-Year Change Condo/TIC/ Coop Year-Over-Year Change Sep-2014 43 -12.2% 57 -9.5% Oct-2014 39 -23.5% 55 -9.8% Nov-2014 41 -19.6% 52 -22.4% Dec-2014 43 -12.2% 58 -15.9% Jan-2015 51 +8.5% 63 +18.9% Feb-2015 44 +4.8% 52 -3.7% Mar-2015 39 -15.2% 52 -1.9% Apr-2015 37 -7.5% 53 -5.4% May-2015 36 -14.3% 52 -7.1% Jun-2015 37 -5.1% 51 -7.3% Jul-2015 37 -11.9% 54 -1.8% Aug-2015 39 -17.0% 53 -5.4% 12-Month Avg* 41 -14.0% 45 -8.9% Historical Housing Affordability Ratio by Month This index measures housing affordability for the region. An index of 120 means the median household income is 120% of what is necessary to qualify for the median-priced home under prevailing interest rates. A higher number means greater affordability. * Affordability Ratio for all properties from September 2014 through August 2015. This is not the average of the individual figures above. Current as of September 11, 2015. All data from the San Francisco MLS. Powered by 10K Research and Marketing. | 13 48 63 47 56 39 53 Single Family Condo/TIC/Coop August 30 40 50 60 70 80 90 100 1-2005 1-2006 1-2007 1-2008 1-2009 1-2010 1-2011 1-2012 1-2013 1-2014 1-2015 Single Family Condo/TIC/Coop 2013 2014 2015 - 5.4%- 11.1%- 17.0%- 2.1% 2013 2014 2015 - 26.2% - 19.2% 50 63 43 56 39 52 Single Family Condo/TIC/Coop Year to Date 2013 2014 2015 - 7.1%- 11.1%- 9.3%- 14.0% 2013 2014 2015 - 25.4% - 23.2%
  • 14. Months Supply of Inventory Months Supply Single Family Year-Over-Year Change Condo/TIC/ Coop Year-Over-Year Change Sep-2014 2.4 +9.1% 2.1 -19.2% Oct-2014 2.1 -4.5% 2.1 -8.7% Nov-2014 1.6 -11.1% 1.7 -5.6% Dec-2014 1.0 -16.7% 1.0 -16.7% Jan-2015 1.4 -6.7% 1.4 -12.5% Feb-2015 1.8 +20.0% 1.7 0.0% Mar-2015 1.8 +20.0% 1.7 0.0% Apr-2015 1.7 +6.3% 1.9 +5.6% May-2015 1.9 +5.6% 1.9 -5.0% Jun-2015 1.8 -14.3% 1.8 -14.3% Jul-2015 1.8 -14.3% 1.7 -19.0% Aug-2015 1.5 -25.0% 1.4 -26.3% 12-Month Avg* 1.7 -1.8% 1.7 -10.8% Historical Months Supply of Inventory by Month The inventory of homes for sale at the end of a given month, divided by the average monthly pending sales from the last 12 months. * Months Supply for all properties from September 2014 through August 2015. This is not the average of the individual figures above. Current as of September 11, 2015. All data from the San Francisco MLS. Powered by 10K Research and Marketing. | 14 2.1 2.2 2.0 1.9 1.5 1.4 Single Family Condo/TIC/Coop August 0.0 2.0 4.0 6.0 8.0 10.0 1-2005 1-2006 1-2007 1-2008 1-2009 1-2010 1-2011 1-2012 1-2013 1-2014 1-2015 Single Family Condo/TIC/Coop 2013 2014 2015 - 26.3%- 13.6%- 25.0%- 4.8% 2013 2014 2015 - 12.5% - 15.4%
  • 15. All Properties Activity Overview Key metrics by report month and for year-to-date (YTD) starting from the first of the year. Key Metrics Historical Sparkbars 8-2014 8-2015 Percent Change YTD 2014 YTD 2015 Percent Change Current as of September 11, 2015. All data from the San Francisco MLS. Powered by 10K Research and Marketing. | 15 Months Supply 1.9 1.4 - 26.3% -- -- -- Affordability Ratio 44 43 - 3.2% % of List Price Received 108.4% 112.8% + 4.1% 109.7% 43 76.3% + 3.4% + 2.4% 39 - 7.8% 112.3% % of Properties Sold Over List Price 74.1% 80.0% + 8.0% 73.8% Active Listings 913 643 - 29.6% -- Avg. Sales Price $1,191,412 $1,311,528 + 10.1% $1,239,446 Days on Market 31 28 - 9.7% 33 $1,150,000 + 17.9% + 15.7% 28 - 15.2% $1,434,533 -- -- Sold Listings 498 411 - 17.5% 3,673 3,414 - 7.1% Median Sales Price $950,000 $1,150,000 + 21.1% $975,000 - 7.8% Pending Sales 470 434 - 7.7% 3,732 3,539 - 5.2% New Listings 498 403 - 19.1% 4,566 4,209 8-2012 8-2013 8-2014 8-2015 8-2012 8-2013 8-2014 8-2015 8-2012 8-2013 8-2014 8-2015 8-2012 8-2013 8-2014 8-2015 8-2012 8-2013 8-2014 8-2015 8-2012 8-2013 8-2014 8-2015 8-2012 8-2013 8-2014 8-2015 8-2012 8-2013 8-2014 8-2015 8-2012 8-2013 8-2014 8-2015 8-2012 8-2013 8-2014 8-2015 8-2012 8-2013 8-2014 8-2015
  • 16. Activity by District SF District 1: Northwest (Sea Cliff, Lake, Jordan Park / Laurel Heights, Outer Richmond, Central Richmond, Inner Richmond, Lone Mountain) SF District 2: Central West (Outer Sunset, Central Sunset, Inner Sunset, Outer Parkside, Parkside, Inner Parkside, Golden Gate Heights) SF District 3: Southwest (Pine Lake Park, Lake Shore, Merced Manor, Stonestown, Lakeside, Merced Heights, Ingleside, Ingleside Heights, Oceanview) SF District 4: Twin Peaks W (Forest Hill (& Ext), W Portal, St Francis Wd, Balboa Terr, Mt Dav Manor, Ingleside Terr, Monterey Hts, Wstwd Pk & H'lnds, Shrwd Fst, Miraloma Pk, Dmnd Hts, Mdtwn Terr) SF District 5: Central (Haight Ashbury, Cole Vly / Prnssus Hts, Clarndn Hts, Corona Hts, Twin Pks, Glen Pk, Noe Vly, Eureka Vly / Dolores Hts, Mission Dolores, Duboce Trngl, Buena Vista / Ashbury Hts) SF District 6: Central North (Lower Pacific Heights, Anza Vista, Western Addition, North Panhandle, Alamo Square, Hayes Valley) SF District 7: North (Marina, Cow Hollow, Presidio Heights, Pacific Heights) SF District 8: Northeast (North Waterfront, North Beach, Russian Hill, Telegraph Hill, Nob Hill, Financial District / Barbary Coast, Downtown, Van Ness / Civic Center, Tenderloin) SF District 9: Central East (Yerba Buena, South Beach, South of Market, Mission Bay, Inner Mission, Potrero Hill, Central Waterfront / Dogpatch, Bernal Heights) SF District 10: Southeast (Outer Mission, Mission Terr, Excelsior, Portola, Bayview, Silver Terr, Hunters Pt, Candlestick Pt, Bayview Hts, Little Hollywood, Visitation Vly, Crocker Amazon) 8-2014 8-2015 + / – 8-2014 8-2015 + / – 8-2014 8-2015 + / – 8-2014 8-2015 + / – 8-2014 8-2015 + / – Single Family 1 SF District 1 36 20 -44.4% 18 14 -22.2% $1,315,000 $1,637,800 +24.5% 24 24 0.0% 2.1 1.1 -47.6% 2 SF District 2 65 47 -27.7% 42 35 -16.7% $921,500 $1,200,000 +30.2% 26 20 -23.1% 1.7 1.3 -23.5% 3 SF District 3 31 28 -9.7% 19 12 -36.8% $750,000 $827,500 +10.3% 29 43 +48.3% 1.9 2.4 +26.3% 4 SF District 4 38 30 -21.1% 24 28 +16.7% $1,295,000 $1,445,500 +11.6% 22 23 +4.5% 1.5 1.1 -26.7% 5 SF District 5 34 25 -26.5% 24 19 -20.8% $1,912,500 $2,000,000 +4.6% 25 26 +4.0% 1.3 1.0 -23.1% 6 SF District 6 7 5 -28.6% 1 4 +300.0% $2,525,000 $2,745,000 +8.7% 26 15 -42.3% 1.9 1.4 -26.3% 7 SF District 7 25 16 -36.0% 10 2 -80.0% $3,575,000 $3,275,000 -8.4% 19 6 -68.4% 2.5 1.9 -24.0% 8 SF District 8 4 5 +25.0% 4 3 -25.0% $2,462,500 $7,650,000 +210.7% 27 189 +600.0% 2.0 2.5 +25.0% 9 SF District 9 39 25 -35.9% 21 25 +19.0% $1,097,000 $1,300,000 +18.5% 34 20 -41.2% 2.0 1.2 -40.0% 10 SF District 10 116 97 -16.4% 48 46 -4.2% $692,500 $800,000 +15.5% 31 30 -3.2% 2.7 2.3 -14.8% Condo/TIC/Coop 1 SF District 1 29 21 -27.6% 15 16 +6.7% $900,000 $879,000 -2.3% 32 20 -37.5% 2.3 1.6 -30.4% 2 SF District 2 10 9 -10.0% 3 2 -33.3% $800,000 $477,000 -40.4% 26 23 -11.5% 1.9 2.4 +26.3% 3 SF District 3 8 5 -37.5% 1 8 +700.0% $420,000 $666,500 +58.7% 10 20 +100.0% 3.3 0.9 -72.7% 4 SF District 4 6 1 -83.3% 5 13 +160.0% $363,000 $730,000 +101.1% 57 29 -49.1% 1.2 0.2 -83.3% 5 SF District 5 66 37 -43.9% 41 27 -34.1% $1,100,000 $1,250,000 +13.6% 38 34 -10.5% 1.6 1.0 -37.5% 6 SF District 6 56 31 -44.6% 23 20 -13.0% $965,000 $1,196,000 +23.9% 21 29 +38.1% 2.1 1.2 -42.9% 7 SF District 7 40 19 -52.5% 37 15 -59.5% $1,450,000 $1,650,000 +13.8% 31 29 -6.5% 1.5 0.8 -46.7% 8 SF District 8 86 68 -20.9% 36 38 +5.6% $827,500 $1,225,000 +48.0% 34 25 -26.5% 1.9 1.8 -5.3% 9 SF District 9 192 131 -31.8% 118 77 -34.7% $882,500 $1,100,000 +24.6% 33 30 -9.1% 1.9 1.5 -21.1% 10 SF District 10 25 23 -8.0% 8 7 -12.5% $529,000 $730,000 +38.0% 40 28 -30.0% 5.3 4.1 -22.6% Key metrics by report month for the districts of San Fransisco. Current as of September 11, 2015. All data from the San Francisco MLS. Powered by 10K Research and Marketing. | 16 Active Listings Sold Listings Median Sales Price Days on Market Months Supply