2. reserved. Pearson, Q-global, and Q Local are trademarks, in the
US and/or
other countries, of Pearson plc. MMPI is a registered trademark
of the Regents of the University of Minnesota. CLINA24805-F
EL 6/20
https://www.pearsonassessments.com/store/usassessments/en/St
ore/Professional-Assessments/Personality-%26-
Biopsychosocial/Minnesota-Multiphasic-Personality-Inventory-
3/p/P100000004.html
10. Press.
Minnesota Multiphasic Personality Inventory and MMPI are
registered trademarks of the University of Minnesota. Pearson is
a trademark
in the U.S. and/or other countries of Pearson Education, Inc., or
its affiliate(s).
This report contains copyrighted material and trade secrets.
Qualified licensees may excerpt portions of this output report,
limited to the
minimum text necessary to accurately describe their significant
core conclusions, for incorporation into a written evaluation of
the examinee, in
accordance with their profession's citation standards, if any. No
adaptations, translations, modifications, or special versions may
be made of
this report without prior written permission from the University
of Minnesota Press.
[ 1.0 / RE1 / QG1 ]
SA
MP
LE
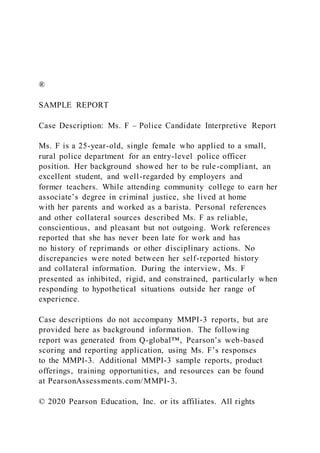
MMPI-3 Validity Scales
20
100
90
13. 110
Cannot Say (Raw): 0
T Score: F
444342
F
F
39 52 45 5745
5 4425 6 126
F
Comparison Group Data: Police Candidate (Men and Women),
N = 1,924
---
---
---
--- ---
---
---
---
---
15. Uncommon Virtues
Adjustment Validity
RBS
13
71
65
7
8293
The highest and lowest T scores possible on each scale are
indicated by a "---"; MMPI-3 T scores are non-gendered.
CRIN
4
45
39
5
92
100100 100 100 100 100 100 100 100 100
MMPI®-3 Police Candidate Interpretive Report ID: Ms. F
10/14/2019, Page 2
16. SA
MP
LE
MMPI-3 Higher-Order (H-O) and Restructured Clinical (RC)
Scales
20
100
90
80
70
60
50
40
30
RC9RC8RC7RC6RC4RC2RC1RCdBXDTHDEID
Raw Score:
T Score:
Response %:
21. ---
---
Comparison Group Data: Police Candidate (Men and Women),
N = 1,924
Standard Dev
Mean Score
1 SD+( ):
( ):
_
Percent scoring at or
below test taker:
91 80891296 99.1 24 92 9241 10
The highest and lowest T scores possible on each scale are
indicated by a "---"; MMPI-3 T scores are non-gendered.
MMPI®-3 Police Candidate Interpretive Report ID: Ms. F
10/14/2019, Page 3
SA
MP
LE
MMPI-3 Somatic/Cognitive Dysfunction and Internalizing
28. Mean Score
1 SD+( ):
( ):
_
Percent scoring at or
below test taker:
The highest and lowest T scores possible on each scale are
indicated by a "---"; MMPI-3 T scores are non-gendered.
MMPI®-3 Police Candidate Interpretive Report ID: Ms. F
10/14/2019, Page 4
SA
MP
LE
MMPI-3 Externalizing and Interpersonal Scales
20
100
90
80
70
29. 60
50
40
30
SFI SHYSAVACTIMPSUBJCP AGG DSFCYN DOM
Raw Score:
T Score:
Response %:
ACT
AGG
CYN
Activation
Aggression
Cynicism
1
43
FML
JCP
SUB
IMP
Family Problems
Juvenile Conduct Problems
33. ---
---
78 23576854 71 3923 10 99.670
Comparison Group Data: Police Candidate (Men and Women),
N = 1,924
Standard Dev
Mean Score
1 SD+( ):
( ):
_
Percent scoring at or
below test taker:
The highest and lowest T scores possible on each scale are
indicated by a "---"; MMPI-3 T scores are non-gendered.
FML
0
38
42
6
37. ---
---
Comparison Group Data: Police Candidate (Men and Women),
N = 1,924
Standard Dev
Mean Score
1 SD+( ):
( ):
_
Percent scoring at or
below test taker:
19 99771998
The highest and lowest T scores possible on each scale are
indicated by a "---"; MMPI-3 T scores are non-gendered.
MMPI®-3 Police Candidate Interpretive Report ID: Ms. F
10/14/2019, Page 6
SA
MP
LE
MMPI-3 T SCORES (BY DOMAIN)
38. PROTOCOL VALIDITY
SUBSTANTIVE SCALES
Scale scores shown in bold font are interpreted in the report.
Note. This information is provided to facilitate interpretation
following the recommended structure for MMPI-3 interpretation
in Chapter 5 of the
MMPI-3 Manual for Administration, Scoring, and
Interpretation, which provides details in the text and an outline
in Table 5-1.
Content Non-Responsiveness 0 45 39 54 F
CNS CRIN VRIN TRIN
Over-Reporting 47 58 42 51 58
F Fp Fs FBS RBS
Under-Reporting 85 71
L K
Somatic/Cognitive Dysfunction 42 40 38 44 38
RC1 MLS NUC EAT COG
Emotional Dysfunction 44 41 44 40 40 44
EID RCd SUI HLP SFD NFC
57 60
RC2 INTR
34 49 37 36 37 44 56 41
RC7 STR WRY CMP ARX ANP BRF NEGE
39. Thought Dysfunction 53 50
THD RC6
49
RC8
56
PSYC
Behavioral Dysfunction 33 35 43 39 39
BXD RC4 FML JCP SUB
32 37 35 39 32
RC9 IMP ACT AGG CYN
34
DISC
Interpersonal Functioning 46 41 41 40 66 38
SFI DOM AGGR DSF SAV SHY
MMPI®-3 Police Candidate Interpretive Report ID: Ms. F
10/14/2019, Page 7
SA
MP
LE
SYNOPSIS
Scores on the MMPI-3 Validity Scales raise substantial
concerns about the possible impact of under-reporting on
the validity of this protocol. With that caution noted, scores on
40. the Substantive Scales indicate clinically significant
interpersonal dysfunction. Interpersonal difficulties relate to
social avoidance.
Comparison group findings point to additional possible
concerns about a low level of positive emotions and
overcontrolled behavior.
Possible job-relevant problems are identified in the following
domains: Emotional Control and Stress Tolerance,
Routine Task Performance, Decision-Making and Judgment,
Feedback Acceptance, Assertiveness, Social
Competence and Teamwork, and Conscientiousness and
Dependability.
PROTOCOL VALIDITY
Content Non-Responsiveness
The test taker produced scorable responses to all the MMPI-3
items. She also responded relevantly to the items
on the basis of their content.
Over-Reporting
There are no indications of over-reporting in this protocol.
This interpretive report is intended for use by a professional
qualified to interpret the MMPI-3 in the context
of preemployment psychological evaluations of police and other
law enforcement candidates. It focuses on
identifying problems; it does not convey potential strengths.
The information it contains should be
considered in the context of the test taker's background, the
41. demands of the position under consideration,
the clinical interview, findings from supplemental tests, and
other relevant information.
The interpretive statements in the Protocol Validity section of
the report are based on T scores derived from
the general MMPI-3 normative sample, as well as scores
obtained by the multisite sample of 1,924
individuals that make up the Police Candidate Comparison
Group.
The interpretive statements in the Clinical Findings and
Diagnostic Considerations sections of the report are
based on T scores derived from the general MMPI-3 normative
sample. Following recommended practice,
only T scores of 65 and higher (with a few exceptions) are
considered clinically significant. Scores at this
clinical level are generally rare among police candidates.
Statements in the Comparison Group Findings and Job-Relevant
Correlates sections are based on
comparisons with scores obtained by the Police Candidate
Comparison Group. Statements in these sections
may be based on T scores that, although less than 65, are
nevertheless uncommon in reference to the
comparison group.
The report includes extensive annotation, which appears as
superscripts following each statement in the
narrative, keyed to Endnotes with accompanying Research
References, which appear in the final two
sections of the report. Additional information about the
annotation features is provided in the headnotes to
these sections and in the MMPI-3 User's Guide for the Police
Candidate Interpretive Report.
42. MMPI®-3 Police Candidate Interpretive Report ID: Ms. F
10/14/2019, Page 8
SA
MP
LE
Under-Reporting
The test taker presented herself in an extremely positive light
by denying a very large number of minor faults and
shortcomings that most people acknowledge1. This level of
virtuous self-presentation is very uncommon even
among individuals with a background stressing traditional
values2. It is also quite uncommon among police
candidates. Only 1.9% of the comparison group members
claimed this many or more uncommon virtues. Any
absence of elevation on the Substantive Scales is
uninterpretable3. Elevated scores on the Substantive Scales
may underestimate the problems assessed by those scales4. The
candidate's responses may be a result of
unintentional (e.g., naïve) or intentional under-reporting. One
way to distinguish between the two is to compare
her responses to items with historical content against available
collateral information (e.g., background
information, interview data). Following are the test taker's
responses to items with potentially verifiable historical
content:
Item number and content omitted. (True)
Item number and content omitted. (False)
Item number andcontent omitted. (False)
43. Item number and content omitted. (False)
Item number and content omitted. (False)
Item number and content omitted. (False)
Item number and content omitted. (True)
Item number and content omitted. (False)
Item number and content omitted. (False)
Item number and content omitted. (False)
Item number and content omitted. (False)
Item number and content omitted. (False)
Corroborated evidence of intentional under-reporting may be
incompatible with the integrity requirements of the
position. In addition, this level of virtuous self-presentation
may reflect uncooperativeness that precludes a reliable
determination of the candidate's suitability. Corroborating
evidence in support of this possibility may be found in
other test data, the clinical interview, or background
information.
The candidate's virtuous self-presentation may reflect an overly
rigid orientation to matters of morality and/or an
inability to self-examine that may impair her effectiveness as a
law enforcement officer. This can be explored
through interview and collateral sources.
In addition, she presented herself as very well-adjusted5. This
reported level of psychological adjustment is
relatively rare in the general population but rather common
among police candidates.
CLINICAL FINDINGS
Clinical-level symptoms, personality characteristics, and
behavioral tendencies of the test taker are described in
this section and organized according to an empirically guided
framework. (Please see Chapter 5 of the MMPI-3
44. Manual for Administration, Scoring, and Interpretation for
details.) Statements containing the word "reports" are
based on the item content of MMPI-3 scales, whereas statements
that include the word "likely" are based on
empirical correlates of scale scores. Specific sources for each
statement can be viewed with the annotation
features of this report.
In light of earlier-described evidence of considerable under-
reporting (claiming a large number of
uncommon virtues), the following statements may not identify,
or may underestimate, psychological
problems that could impede the candidate's ability to perform
the duties of a police officer.
MMPI®-3 Police Candidate Interpretive Report ID: Ms. F
10/14/2019, Page 9
SA
MP
LE
The test taker reports not enjoying social events and avoiding
social situations6. She likely is socially introverted7,
has difficulty forming close relationships8, and is emotionally
restricted9.
There are no indications of clinically significant somatic,
cognitive, emotional, thought, or behavioral dysfunction
in this protocol. However, because of indications of under -
reporting described earlier, such problems cannot be
ruled out.
45. DIAGNOSTIC CONSIDERATIONS
This section provides recommendations for psychodiagnostic
assessment based on the test taker's MMPI-3
results. It is recommended that she be evaluated for the
following, bearing in mind possible threats to protocol
validity noted earlier in this report:
Interpersonal Disorders
- Disorders associated with social avoidance such as avoidant
personality disorder10
COMPARISON GROUP FINDINGS
This section describes the MMPI-3 Substantive Scale findings
in the context of the Police Candidate Comparison
Group. Specific sources for each statement can be accessed with
the annotation features of this report.
Job-related correlates of these results, if any, are provided in
the subsequent Job-Relevant Correlates
section.
In light of earlier-described evidence of considerable under-
reporting, the comparison group findings
discussed below may not identify, or may underestimate,
psychological problems that could impede the
candidate's ability to perform the duties of a police officer.
Emotional/Internalizing Problems
The test taker reports a comparatively high level of introversion
and low positive emotions for a police candidate11.
Only 3.4% of comparison group members convey this or a
46. greater level of social withdrawal and low positive
emotional experience.
Behavioral/Externalizing Problems
The test taker's responses indicate a very low level of energy
together with inhibited, overcontrolled behavior,
which may be incompatible with public safety requirements for
behavioral adaptability12. This level of inhibited
behavior is very uncommon among police candidates. Only
5.4% of comparison group members give evidence of
this level of overly constrained behavior and low activation.
Interpersonal Problems
The test taker's responses indicate a level of social avoidance
that may be incompatible with public safety
requirements for good interpersonal functioning13. This level of
socially avoidant behavior is very uncommon
among police candidates. Only 1.7% of comparison group
members give evidence of this or a greater level of
social avoidance.
JOB-RELEVANT CORRELATES
Job-relevant personality characteristics and behavioral
tendencies of the test taker are described in this section
and organized according to ten problem domains commonly
identified in the professional literature as relevant to
police candidate suitability. (Please see MMPI-3 User's Guide
for the Police Candidate Interpretive Report for
MMPI®-3 Police Candidate Interpretive Report ID: Ms. F
10/14/2019, Page 10
47. SA
MP
LE
details.) Statements that begin with "Compared with other
police candidates" are based on correlations with other
self-report measures obtained in police candidate samples that
included individuals who were subsequently hired
as well as those who were not. Statements that begin with "She
is more likely than most police officers or
trainees" are based on correlations with outcome data obtained
in samples of hired candidates during academy or
field training, probation, and/or the post-probation period.
Specific sources for each statement can be accessed
with the annotation features of this report.
In light of earlier-described evidence of considerable under-
reporting, the job-relevant correlates
described in this section may not identify, or may
underestimate, problematic tendencies that could
impede the candidate's ability to perform the duties of a police
officer.
Emotional Control and Stress Tolerance Problems
Compared with other police candidates, the test taker is more
likely to become easily discouraged14; to have
difficulty coping with stress14; and to worry about problems
and be uncertain about how to deal with them15. She is
also more likely to be unprepared to take decisive action in
times of stress or emergency16.
48. She is more likely than most police officers or trainees to
exhibit difficulties applying instructions appropriately
under stressful conditions17 and performing under stressful
conditions18.
Routine Task Performance Problems
The test taker is more likely than most police officers or
trainees to exhibit difficulties carrying out tasks under
non-stressful conditions19.
Decision-Making and Judgment Problems
Compared with other police candidates, the test taker is more
likely to be made anxious by change and
uncertainty20.
Feedback Acceptance Problems
The test taker is more likely than most police officers or
trainees to exhibit difficulties accepting and responding to
constructive performance feedback21.
Assertiveness Problems
Compared with other police candidates, the test taker is more
likely to avoid situations that others generally view
as benign and non-intimidating22; to be ill at ease in dealing
with others23; and to be unsure and act hesitantly24.
She is more likely than most police officers or trainees to
49. exhibit difficulties engaging or confronting subjects in
circumstances in which an officer would normally approach or
intervene25. She is also more likely to exhibit
difficulties in demonstrating a command presence and
controlling situations requiring order or resolution26.
Social Competence and Teamwork Problems
Compared with other police candidates, the test taker is more
likely to have difficulty creating and sustaining
mutually satisfying relationships27 and to have a limited social
support network28.
She is more likely than most police officers or trainees to
exhibit difficulties reading people, listening to others,
and adapting her language and approach to the requirements of
the situation29.
Conscientiousness and Dependability Problems
The test taker is more likely than most police officers or
trainees to exhibit difficulties reliably attending court30; in
her dedication to improvement of knowledge and skills31; and
with punctuality and attendance32. She is also more
likely to exhibit difficulties with reliable work behavior and
dependable follow-through33.
MMPI®-3 Police Candidate Interpretive Report ID: Ms. F
10/14/2019, Page 11
SA
MP
LE
50. The candidate's test scores are not associated with problems in
the following domains:
- Integrity
- Substance Use
- Impulse Control
ITEM-LEVEL INFORMATION
Unscorable Responses
The test taker produced scorable responses to all the MMPI-3
items.
Critical Responses
Seven MMPI-3 scales—Suicidal/Death Ideation (SUI),
Helplessness/Hopelessness (HLP), Anxiety-Related
Experiences (ARX), Ideas of Persecution (RC6), Aberrant
Experiences (RC8), Substance Abuse (SUB), and
Aggression (AGG)—have been designated by the test authors as
having critical item content that may require
immediate attention and follow-up. Items answered by the
individual in the keyed direction (True or False) on a
critical scale are listed below if her T score on that scale is 65
or higher. However, any item answered in the
keyed direction on SUI is listed.
The test taker has not produced an elevated T score (> 65) on
any of these scales or answered any SUI items in
51. the keyed direction.
User-Designated Item-Level Information
The following item-level information is based on the report
user's selection of additional scales, and/or of lower
cutoffs for the critical scales from the previous section. Items
answered by the test taker in the keyed direction
(True or False) on a selected scale are listed below if her T
score on that scale is at the user-designated cutoff
score or higher. The percentage of the MMPI-3 normative
sample (NS) and of the Police Candidate (Men and
Women) Comparison Group (CG) that answered each item in the
keyed direction are provided in parentheses
following the item content.
Uncommon Virtues (L, T Score = 85)
Item number and content omitted. (False; NS 24.0%, CG 41.5%)
Item number and content omitted. (False; NS 45.1%, CG 65.4%)
Item number and content omitted. (False; NS 30.9%, CG 56.0%)
Item number and content omitted. (False; NS 9.5%, CG 29.4%)
Item number and content omitted. (False; NS 9.1%, CG 22.9%)
Item number and content omitted. (False; NS 50.2%, CG 59.5%)
Item number and content omitted. (False; NS 31.1%, CG 61.7%)
Item number and content omitted. (False; NS 19.7%, CG 29.5%)
Item number and content omitted. (False; NS 23.6%, CG 37.6%)
Item number and content omitted. (True; NS 22.6%, CG 19.0%)
Item number and content omitted. (False; NS 48.7%, CG 71.9%)
Item number and content omitted. (False; NS 9.9%, CG 13.4%)
Low Positive Emotions (RC2, T Score = 57)
52. Item number and content omitted. (False; NS 41.2%, CG 31.5%)
Item number and content omitted. (False; NS 7.3%, CG 3.4%)
Item number and content omitted. (False; NS 29.9%, CG 16.3%)
Item number and content omitted. (False; NS 30.2%, CG 5.0%)
MMPI®-3 Police Candidate Interpretive Report ID: Ms. F
10/14/2019, Page 12
SA
MP
LE
Item number and content omitted. (False; NS 33.5%, CG 13.1%)
Social Avoidance (SAV, T Score = 66)
Item number and content omitted. (False; NS 53.1%, CG 44.2%)
Item number and content omitted. (False; NS 14.8%, CG 1.9%)
Item number and content omitted. (False; NS 45.7%, CG 41.7%)
Item number and content omitted. (False; NS 37.4%, CG 25.9%)
Item number and content omitted. (False; NS 26.7%, CG 24.3%)
Item number and content omitted. (False; NS 30.2%, CG 5.0%)
Item number and content omitted. (True; NS 41.5%, CG 23.9%)
Introversion/Low Positive Emotionality (INTR, T Score = 60)
Item number and content omitted. (False; NS 53.1%, CG 44.2%)
Item number and content omitted. (False; NS 13.1%, CG 3.8%)
Item number and content omitted. (False; NS 45.7%, CG 41.7%)
53. Item number and content omitted. (False; NS 37.4%, CG 25.9%)
Item number and content omitted. (False; NS 29.9%, CG 16.3%)
Item number and content omitted. (False; NS 26.7%, CG 24.3%)
Item number and content omitted. (False; NS 30.2%, CG 5.0%)
Item number and content omitted. (True; NS 41.5%, CG 23.9%)
Critical Follow-up Items
This section contains a list of items to which the test taker
responded in a manner warranting follow-up. The
items were identified by police officer screening experts as
having critical content. Clinicians are encouraged to
follow up on these statements with the candidate by making
related inquiries, rather than reciting the item(s)
verbatim. Each item is followed by the candidate's response, the
percentage of Police Candidate Comparison
Group members who gave this response, and the scale(s) on
which the item appears.
Item number and content omitted. (False; 2.1%; TRIN, STR)
Item number and content omitted. (True; 1.5%; VRIN, F, THD,
RC6, PSYC)
MMPI®-3 Police Candidate Interpretive Report ID: Ms. F
10/14/2019, Page 13
SA
MP
LE
ENDNOTES
54. This section lists for each statement in the report the MMPI-3
score(s) that triggered it. In addition, each
statement is identified as a Test Response, if based on item
content, a Correlate, if based on empirical correlates,
or an Inference, if based on the report authors' judgment. (This
information can also be accessed on-screen by
placing the cursor on a given statement.) For correlate-based
statements, research references (Ref. No.) are
provided, keyed to the consecutively numbered reference list
following the endnotes.
1 Test Response: L=85
2 Correlate: L=85, Ref. 6
3 Correlate: L=85, Ref. 7, 9, 15, 16
4 Correlate: L=85, Ref. 4, 12, 16, 23
5 Test Response: K=71
6 Test Response: SAV=66
7 Correlate: SAV=66, Ref. 1, 2, 3, 4, 11, 14
8 Correlate: SAV=66, Ref. 1, 4, 5, 8, 13
9 Correlate: SAV=66, Ref. 4, 23
10 Correlate: SAV=66, Ref. 4, 17, 24
11 Test Response: RC2=57; INTR=60
12 Inference: RC9=32; BXD=33; DISC=34
13 Inference: SAV=66
14 Correlate: RC2=57, Ref. 22
15 Correlate: RC2=57, Ref. 4, 22; INTR=60, Ref. 4
16 Correlate: BXD=33, Ref. 4, 22; RC9=32, Ref. 4, 22;
SAV=66, Ref. 4; DISC=34, Ref. 4, 22
17 Correlate: RC2=57, Ref. 18, 21; INTR=60, Ref. 19
18 Correlate: BXD=33, Ref. 4; RC2=57, Ref. 18, 21; RC9=32,
Ref. 4; SAV=66, Ref. 18, 21; DISC=34, Ref. 4
19 Correlate: RC2=57, Ref. 18, 21; INTR=60, Ref. 18
20 Correlate: INTR=60, Ref. 22
21 Correlate: INTR=60, Ref. 19, 21
22 Correlate: SAV=66, Ref. 22
23 Correlate: RC2=57, Ref. 4, 22; SAV=66, Ref. 4, 10, 22;
56. 1. Anderson, J. L., Sellbom, M., Ayearst, L., Quilty, L. C.,
Chmielewski, M., & Bagby, R. M. (2015).
Associations between DSM-5 Section III personality traits and
the Minnesota Multiphasic Personality
Inventory 2-Restructured Form (MMPI-2-RF) scales in a
psychiatric patient sample. Psychological
Assessment, 27(3), 801–815.
https://doi.org/10.1037/pas0000096
2. Anderson, J. L., Sellbom, M., Pymont, C., Smid, W., De
Saeger, H., & Kamphuis, J. H. (2015).
Measurement of DSM-5 Section II personality disorder
constructs using the MMPI-2-RF in clinical and
forensic samples. Psychological Assessment, 27(3), 786–800.
https://doi.org/10.1037/pas0000103
3. Ayearst, L. E., Sellbom, M., Trobst, K. K., & Bagby, R. M.
(2013). Evaluating the interpersonal content of
the MMPI-2-RF Interpersonal Scales. Journal of Personality
Assessment, 95(2), 187–196.
https://doi.org/10.1080/00223891.2012.730085
4. Ben-Porath, Y. S., & Tellegen, A. (2020). The Minnesota
Multiphasic Personality Inventory-3 (MMPI-3):
Technical manual. University of Minnesota Press.
57. 5. Bianchini, K. J., Aguerrevere, L. E., Curtis, K. L., Roebuck-
Spencer, T. M., Frey, F. C., Greve, K. W., &
Calamia, M. (2018). Classification accuracy of the Minnesota
Multiphasic Personality Inventory-2
(MMPI-2)-Restructured Form Validity Scales in detecting
malingered pain-related disability. Psychological
Assessment, 30(7), 857–869.
https://doi.org/10.1037/pas0000532
6. Bridges, S. A., & Baum, L. J. (2013). An examination of the
MMPI-2-RF L-r scale in an outpatient
protestant sample. Journal of Psychology and Christianity,
32(2), 115–123. Questia.
http://www.questia.com/read/1P3-3083628231/an-examination-
of-the-mmpi-2-rf-l-r-scale-in-an-outpatient
7. Brown, T. A., & Sellbom, M. (2020). The utility of the
MMPI-2-RF validity scales in detecting
underreporting. Journal of Personality Assessment, 102(1), 66–
74.
https://doi.org/10.1080/00223891.2018.1539003
8. Cox, A., Courrégé, S. C., Feder, A. H., & Weed, N. C.
(2017). Effects of augmenting response options of
the MMPI-2-RF: An extension of previous findings. Cogent
Psychology, 4(1), 1323988.
https://doi.org/10.1080/23311908.2017.1323988
9. Crighton, A. H., Marek, R. J., Dragon, W. R., & Ben-Porath,
Y. S. (2017). Utility of the MMPI-2-RF Validity
Scales in detection of simulated underreporting: Implications of
incorporating a manipulation check.
Assessment, 24(7), 853–864.
https://doi.org/10.1177/1073191115627011
10. Detrick, P., Ben-Porath, Y.S., & Sellbom, M. (2016).
58. Associations between MMPI-2-RF (Restructured
Form) and Inwald Personality Inventory (IPI) scale scores in a
law enforcement preemployment screening
sample. Journal of Police and Criminal Psychology, 31, 81–95.
https://doi.org/10.1007/s11896-015-9172-7
11. Finn, J. A., Ben-Porath, Y. S., & Tellegen, A. (2015).
Dichotomous versus polytomous response options
in psychopathology assessment: Method or meaningful
variance? Psychological Assessment, 27(1),
184–193. https://doi.org/10.1037/pas0000044
12. Forbey, J. D., Lee, T. T. C., Ben-Porath, Y. S., Arbisi, P.
A., & Gartland, D. (2013). Associations between
MMPI-2-RF validity scale scores and extra-test measures of
personality and psychopathology. Assessment,
20(4), 448–461. https://doi.org/10.1177/1073191113478154
13. Forbey, J. D., Lee, T. T. C., & Handel, R. W. (2010).
Correlates of the MMPI-2-RF in a college setting.
Psychological Assessment, 22(4), 737–744.
https://doi.org/10.1037/a0020645
MMPI®-3 Police Candidate Interpretive Report ID: Ms. F
10/14/2019, Page 15
SA
MP
LE
https://doi.org/10.1037/pas0000096
https://doi.org/10.1037/pas0000103
https://doi.org/10.1080/00223891.2012.730085
https://doi.org/10.1037/pas0000532
http://www.questia.com/read/1P3-3083628231/an-examination-
60. Scales. Law and Human Behavior, 37(4), 219–230.
https://doi.org/10.1037/lhb0000008
16. Sellbom, M., & Bagby, R. M. (2008). Validity of the
MMPI-2-RF (Restructured Form) L-r and K-r scales in
detecting under-reporting in clinical and non-clinical samples.
Psychological Assessment, 20(4), 370–376.
https://doi.org/10.1037/a0012952
17. Sellbom, M., & Smith, A. (2017). Assessment of DSM-5
Section II personality disorders with the
MMPI-2-RF in a nonclinical sample. Journal of Personality
Assessment, 99(4), 384–397.
https://doi.org/10.1080/00223891.2016.1242074
18. Tarescavage, A. M., Brewster, J., Corey, D. M., & Ben-
Porath, Y. S. (2015). Use of pre-hire Minnesota
Multiphasic Personality Inventory-2-Restructured Form (MMPI-
2-RF) police candidate scores to predict
supervisor ratings of post-hire performance. Assessment, 22(4),
411–428.
https://doi.org/10.1177/1073191114548445
19. Tarescavage, A. M., Corey, D. M., & Ben-Porath, Y. S.
(2015). Minnesota Multiphasic Personality
Inventory-2-Restructured Form (MMPI-2-RF) predictors of
police officer problem behavior. Assessment,
22(1), 116–132. https://doi.org/10.1177/1073191114534885
20. Tarescavage, A. M., Corey, D. M., & Ben-Porath, Y. S.
(2016). A prorating method for estimating
MMPI-2-RF scores from MMPI responses: Examination of score
fidelity and illustration of empirical utility in
the PERSEREC police integrity study sample. Assessment,
23(2), 173–190.
https://doi.org/10.1177/1073191115575070
61. 21. Tarescavage, A. M., Corey, D. M., Gupton, H. M., & Ben-
Porath Y.S. (2015). Criterion validity and
practical utility of the Minnesota Multiphasic Personality
Inventory-2-Restructured Form (MMPI-2-RF) in
assessments of police officer candidates. Journal of Personality
Assessment, 97(4), 382–394.
https://doi.org/10.1080/00223891.2014.995800
22. Tarescavage, A. M., Fischler, G. L., Cappo, B. M., Hill, D.
O., Corey, D. M., & Ben-Porath, Y. S. (2015).
Minnesota Multiphasic Personality Inventory-2-Restructured
Form (MMPI-2-RF) predictors of police officer
problem behavior and collateral self-report test scores.
Psychological Assessment, 27(1), 125–137.
https://doi.org/10.1037/pas0000041
23. Tellegen, A., & Ben-Porath, Y. S. (2008/2011). Minnesota
Multiphasic Personality
Inventory-2-Restructured Form (MMPI-2-RF): Technical
manual. University of Minnesota Press.
24. Van der Heijden, P. T., Egger, J. I. M., Rossi, G. M. P.,
Grundel, G., & Derksen, J. J. L. (2013). The
MMPI-2-Restructured Form and the standard MMPI-2 Clinical
Scales in relation to DSM-IV. European
Journal of Psychological Assessment, 29(3), 182–188.
https://doi.org/10.1027/1015-5759/a000140
MMPI®-3 Police Candidate Interpretive Report ID: Ms. F
10/14/2019, Page 16
SA
MP
LE
70. MMPI®-3
Police Candidate Interpretive Report
David M. Corey, PhD, & Yossef S. Ben-Porath, PhD
ID Number: Mr. E
Age: 27
Gender: Male
Marital Status: Not reported
Years of Education: Not reported
76. Standard Dev
Mean Score
1 SD+( ):
( ):
_
71 998499.561 5810Percent scoring at or
below test taker:
L
K
Uncommon Virtues
Adjustment Validity
RBS
11
65
65
7
4723
The highest and lowest T scores possible on each scale are
indicated by a "---"; MMPI-3 T scores are non-gendered.
CRIN
77. 1
36
39
5
54
100100 100 100 100 100 100 100 100 100
MMPI®-3 Police Candidate Interpretive Report ID: Mr. E
10/14/2019, Page 2
SA
MP
LE
MMPI-3 Higher-Order (H-O) and Restructured Clinical (RC)
Scales
20
100
90
80
70
83. 21 80658599.5 39 71 98 9887 94
The highest and lowest T scores possible on each scale are
indicated by a "---"; MMPI-3 T scores are non-gendered.
MMPI®-3 Police Candidate Interpretive Report ID: Mr. E
10/14/2019, Page 3
SA
MP
LE
MMPI-3 Somatic/Cognitive Dysfunction and Internalizing
Scales
20
100
90
80
70
60
50
40
30
89. ---
---
---
---
---
MLS SUI
66 98799696 99.3 8689 52 9373 70 9073
Standard Dev
Mean Score
1 SD+( ):
( ):
_
Percent scoring at or
below test taker:
The highest and lowest T scores possible on each scale are
indicated by a "---"; MMPI-3 T scores are non-gendered.
MMPI®-3 Police Candidate Interpretive Report ID: Mr. E
10/14/2019, Page 4
SA
MP
90. LE
MMPI-3 Externalizing and Interpersonal Scales
20
100
90
80
70
60
50
40
30
SFI SHYSAVACTIMPSUBJCP AGG DSFCYN DOM
Raw Score:
T Score:
Response %:
ACT
AGG
CYN
95. Percent scoring at or
below test taker:
The highest and lowest T scores possible on each scale are
indicated by a "---"; MMPI-3 T scores are non-gendered.
FML
0
38
42
6
59
100 100 100 100 100 100 100 100 100 100 100 100
MMPI®-3 Police Candidate Interpretive Report ID: Mr. E
10/14/2019, Page 5
SA
MP
LE
MMPI-3 PSY-5 Scales
20
100
99. 99.3 67887699.3
The highest and lowest T scores possible on each scale are
indicated by a "---"; MMPI-3 T scores are non-gendered.
MMPI®-3 Police Candidate Interpretive Report ID: Mr. E
10/14/2019, Page 6
SA
MP
LE
MMPI-3 T SCORES (BY DOMAIN)
PROTOCOL VALIDITY
SUBSTANTIVE SCALES
Scale scores shown in bold font are interpreted in the report.
Note. This information is provided to facilitate interpretation
following the recommended structure for MMPI-3 interpretation
in Chapter 5 of the
MMPI-3 Manual for Administration, Scoring, and
100. Interpretation, which provides details in the text and an outline
in Table 5-1.
Content Non-Responsiveness 0 36 39 50
CNS CRIN VRIN TRIN
Over-Reporting 50 41 53 40 35
F Fp Fs FBS RBS
Under-Reporting 56 65
L K
Somatic/Cognitive Dysfunction 42 33 52 44 38
RC1 MLS NUC EAT COG
Emotional Dysfunction 32 36 44 51 40 44
EID RCd SUI HLP SFD NFC
36 47
RC2 INTR
44 37 37 56 37 37 43 45
RC7 STR WRY CMP ARX ANP BRF NEGE
Thought Dysfunction 60 57
THD RC6
55
RC8
59
PSYC
Behavioral Dysfunction 46 44 43 48 39
BXD RC4 FML JCP SUB
101. 51 52 53 49 55
RC9 IMP ACT AGG CYN
45
DISC
Interpersonal Functioning 54 69 63 40 50 38
SFI DOM AGGR DSF SAV SHY
MMPI®-3 Police Candidate Interpretive Report ID: Mr. E
10/14/2019, Page 7
SA
MP
LE
SYNOPSIS
This is a valid MMPI-3 protocol. Scores on the Substantive
Scales indicate clinically significant interpersonal
dysfunction. Interpersonal difficulties relate to overly
domineering behavior.
Comparison group findings point to additional possible
concerns about persecutory beliefs, odd perceptions and
thoughts, and over-assertiveness.
Possible job-relevant problems are identified in the following
domains: Emotional Control and Stress Tolerance,
Routine Task Performance, Decision-Making and Judgment,
Feedback Acceptance, Social Competence and
102. Teamwork, Integrity, and Conscientiousness and Dependability.
PROTOCOL VALIDITY
This is a valid MMPI-3 protocol. There are no problems with
unscorable items. The test taker responded to the
items relevantly on the basis of their content, and there are no
indications of over- or under-reporting.
This interpretive report is intended for use by a professional
qualified to interpret the MMPI-3 in the context
of preemployment psychological evaluations of police and other
law enforcement candidates. It focuses on
identifying problems; it does not convey potential strengths.
The information it contains should be
considered in the context of the test taker's background, the
demands of the position under consideration,
the clinical interview, findings from supplemental tests, and
other relevant information.
The interpretive statements in the Protocol Validity section of
the report are based on T scores derived from
the general MMPI-3 normative sample, as well as scores
obtained by the multisite sample of 1,924
individuals that make up the Police Candidate Comparison
Group.
The interpretive statements in the Clinical Findings and
Diagnostic Considerations sections of the report are
based on T scores derived from the general MMPI-3 normative
sample. Following recommended practice,
only T scores of 65 and higher (with a few exceptions) are
considered clinically significant. Scores at this
clinical level are generally rare among police candidates.
103. Statements in the Comparison Group Findings and Job-Relevant
Correlates sections are based on
comparisons with scores obtained by the Police Candidate
Comparison Group. Statements in these sections
may be based on T scores that, although less than 65, are
nevertheless uncommon in reference to the
comparison group.
The report includes extensive annotation, which appears as
superscripts following each statement in the
narrative, keyed to Endnotes with accompanying Research
References, which appear in the final two
sections of the report. Additional information about the
annotation features is provided in the headnotes to
these sections and in the MMPI-3 User's Guide for the Police
Candidate Interpretive Report.
MMPI®-3 Police Candidate Interpretive Report ID: Mr. E
10/14/2019, Page 8
SA
MP
LE
CLINICAL FINDINGS
Clinical-level symptoms, personality characteristics, and
behavioral tendencies of the test taker are described in
this section and organized according to an empirically guided
framework. (Please see Chapter 5 of the MMPI-3
Manual for Administration, Scoring, and Interpretation for
details.) Statements containing the word "reports" are
based on the item content of MMPI-3 scales, whereas statements
104. that include the word "likely" are based on
empirical correlates of scale scores. Specific sources for each
statement can be viewed with the annotation
features of this report.
The test taker describes himself as having strong opinions, as
standing up for himself, as assertive and direct,
and as able to lead others1. He likely believes he has leadership
capabilities, but is viewed by others as overly
domineering2.
There are no indications of clinically significant somatic,
cognitive, emotional, thought, or behavioral dysfunction
in this protocol.
DIAGNOSTIC CONSIDERATIONS
This section provides recommendations for psychodiagnostic
assessment based on the test taker's MMPI-3
results. It is recommended that he be evaluated for the
following:
Interpersonal Disorders
- Disorders characterized by excessively domineering behavior3
COMPARISON GROUP FINDINGS
This section describes the MMPI-3 Substantive Scale findings
105. in the context of the Police Candidate Comparison
Group. Specific sources for each statement can be accessed with
the annotation features of this report.
Job-related correlates of these results, if any, are provided in
the subsequent Job-Relevant Correlates
section.
Unusual Thoughts, Perceptions, and Beliefs
The test taker reports a comparatively high level of unusual
thinking for a police candidate4. Only 1.0% of
comparison group members convey such thoughts at this or a
higher level. More specifically, he reports a
relatively high level of persecutory beliefs for a police
candidate5. Only 3.9% of comparison group members
convey this or a greater level of persecutory thinking.
He reports a comparatively high level of odd perceptions and
thoughts for a police candidate6. Only 3.6% of
comparison group members convey this or a greater level of
unusual experiences.
Interpersonal Problems
The test taker's responses indicate a level of domineering
behavior that may be incompatible with public safety
requirements for good interpersonal functioning3. This level of
dominance is very uncommon among police
candidates. Only 5.9% of comparison group members give
evidence of this level of domineering behavior. He
reports a comparatively high level of over-assertiveness for a
police candidate7. Only 2.7% of comparison group
106. members convey this or a greater level of interpersonally
aggressive behavior.
MMPI®-3 Police Candidate Interpretive Report ID: Mr. E
10/14/2019, Page 9
SA
MP
LE
JOB-RELEVANT CORRELATES
Job-relevant personality characteristics and behavioral
tendencies of the test taker are described in this section
and organized according to ten problem domains commonly
identified in the professional literature as relevant to
police candidate suitability. (Please see MMPI-3 User's Guide
for the Police Candidate Interpretive Report for
details.) Statements that begin with "Compared with other
police candidates" are based on correlations with other
self-report measures obtained in police candidate samples that
included individuals who were subsequently hired
as well as those who were not. Statements that begin with "He i s
more likely than most police officers or trainees"
are based on correlations with outcome data obtained in samples
of hired candidates during academy or field
training, probation, and/or the post-probation period. Specific
sources for each statement can be accessed with
the annotation features of this report.
Emotional Control and Stress Tolerance Problems
107. Compared with other police candidates, the test taker is more
likely to become impatient with others over minor
infractions8.
He is more likely than most police officers or trainees to exhibit
difficulties performing under stressful conditions9.
Routine Task Performance Problems
The test taker is more likely than most police officers or
trainees to exhibit difficulties carrying out tasks under
non-stressful conditions10; cognitive adaptation problems11;
and report writing problems11.
Decision-Making and Judgment Problems
Compared with other police candidates, the test taker is more
likely to have thoughts, perceptions, and/or
experiences that are rarely reported12.
He is more likely than most police officers or trainees to exhibit
difficulties prioritizing multiple and essential
functions of the job and performing them in quick succession
while maintaining good environmental awareness of
vital information (in other words, multi-tasking)11. He is also
more likely to exhibit difficulties with effective decision
making9.
Feedback Acceptance Problems
Compared with other police candidates, the test taker is less
likely to reflect on his behavior13 and more likely to
brush off criticism and other negative feedback13.
108. Social Competence and Teamwork Problems
Compared with other police candidates, the test taker is more
likely to be opinionated and outspoken13; to fail to
consider others' needs and feelings13; and to be demanding14.
He is also more likely to hold overly suspicious
views about the motives and actions of others15 and to have
difficulty trusting others16.
He is more likely than most police officers or trainees to exhibit
difficulties cooperating with peers and/or
supervisors17.
Integrity Problems
The test taker is more likely than most police officers or
trainees to exhibit difficulties leading to sustained internal
affairs investigations18; complaints from the public19; and
investigations about conduct unbecoming a police officer19.
Conscientiousness and Dependability Problems
The test taker is more likely than most police officers or
trainees to exhibit difficulties with initiative and drive,
such as obtaining information and evidence needed to solve
crimes and explain incidents20. He is also more likely
to exhibit difficulties reliably attending court21; with
punctuality and attendance22; and with conscientiousness23.
MMPI®-3 Police Candidate Interpretive Report ID: Mr. E
10/14/2019, Page 10
109. SA
MP
LE
The candidate's test scores are not associated with problems in
the following domains:
- Assertiveness
- Substance Use
- Impulse Control
ITEM-LEVEL INFORMATION
Unscorable Responses
The test taker produced scorable responses to all the MMPI-3
items.
Critical Responses
Seven MMPI-3 scales—Suicidal/Death Ideation (SUI),
Helplessness/Hopelessness (HLP), Anxiety-Related
Experiences (ARX), Ideas of Persecution (RC6), Aberrant
Experiences (RC8), Substance Abuse (SUB), and
Aggression (AGG)—have been designated by the test authors as
having critical item content that may require
immediate attention and follow-up. Items answered by the
individual in the keyed direction (True or False) on a
critical scale are listed below if his T score on that scale is 65
or higher. However, any item answered in the keyed
110. direction on SUI is listed.
The test taker has not produced an elevated T score (> 65) on
any of these scales or answered any SUI items in
the keyed direction.
User-Designated Item-Level Information
The following item-level information is based on the report
user's selection of additional scales, and/or of lower
cutoffs for the critical scales from the previous section. Items
answered by the test taker in the keyed direction
(True or False) on a selected scale are listed below if his T
score on that scale is at the user-designated cutoff
score or higher. The percentage of the MMPI-3 normative
sample (NS) and of the Police Candidate (Men and
Women) Comparison Group (CG) that answered each item in the
keyed direction are provided in parentheses
following the item content.
Thought Dysfunction (THD, T Score = 60)
Item number and content omitted. (True; NS 35.7%, CG 14.2%)
Item number and content omitted. (False; NS 36.5%, CG 16.1%)
Item number and content omitted. (True; NS 8.3%, CG 1.0%)
Item number and content omitted. (True; NS 18.2%, CG 5.2%)
Item number and content omitted. (False; NS 16.4%, CG 6.2%)
Item number and content omitted. (True; NS 8.9%, CG 0.8%)
Ideas of Persecution (RC6, T Score = 57)
111. Item number and content omitted. (True; NS 8.3%, CG 1.0%)
Item number and content omitted. (True; NS 30.9%, CG 8.8%)
Item number and content omitted. (False; NS 16.4%, CG 6.2%)
Aberrant Experiences (RC8, T Score = 55)
Item number and content omitted. (True; NS 35.7%, CG 14.2%)
Item number and content omitted. (True; NS 38.0%, CG 15.8%)
Item number and content omitted. (False; NS 36.5%, CG 16.1%)
Item number and content omitted. (True; NS 18.2%, CG 5.2%)
MMPI®-3 Police Candidate Interpretive Report ID: Mr. E
10/14/2019, Page 11
SA
MP
LE
Dominance (DOM, T Score = 69)
Item number and content omitted. (False; NS 85.2%, CG 96.4%)
Item number and content omitted. (True; NS 78.7%, CG 78.2%)
Item number and content omitted. (True; NS 68.8%, CG 41.6%)
Item number and content omitted. (True; NS 74.7%, CG 73.4%)
Item number and content omitted. (True; NS 74.3%, CG 90.3%)
Item number and content omitted. (True; NS 60.7%, CG 73.5%)
Item number and content omitted. (False; NS 80.6%, CG 97.5%)
Item number and content omitted. (True; NS 66.5%, CG 86.9%)
112. Item number and content omitted. (True; NS 39.8%, CG 12.2%)
Aggressiveness (AGGR, T Score = 63)
Item number and content omitted. (False; NS 85.2%, CG 96.4%)
Item number and content omitted. (True; NS 78.7%, CG 78.2%)
Item number and content omitted. (True; NS 68.8%, CG 41.6%)
Item number and content omitted. (True; NS 74.7%, CG 73.4%)
Item number and content omitted. (True; NS 74.3%, CG 90.3%)
Item number and content omitted. (False; NS 74.7%, CG 98.7%)
Item number and content omitted. (True; NS 60.7%, CG 73.5%)
Item number and content omitted. (True; NS 66.5%, CG 86.9%)
Item number and content omitted. (True; NS 44.6%, CG 22.7%)
Item number and content omitted. (True; NS 42.2%, CG 30.9%)
Item number and content omitted. (True; NS 39.8%, CG 12.2%)
Psychoticism (PSYC, T Score = 59)
Item number and content omitted. (True; NS 35.7%, CG 14.2%)
Item number and content omitted. (False; NS 36.5%, CG 16.1%)
Item number and content omitted. (True; NS 18.2%, CG 5.2%)
Item number and content omitted. (True; NS 8.9%, CG 0.8%)
Critical Follow-up Items
This section contains a list of items to which the test taker
responded in a manner warranting follow-up. The
items were identified by police officer screening experts as
having critical content. Clinicians are encouraged to
follow up on these statements with the candidate by making
related inquiries, rather than reciting the item(s)
113. verbatim. Each item is followed by the candidate's response, the
percentage of Police Candidate Comparison
Group members who gave this response, and the scale(s) on
which the item appears.
Item number and content omitted. (True; 5.1%; BXD, RC9,
IMP, DISC)
Item number and content omitted. (True; 1.0%; F)
Item number and content omitted. (True; 5.0%; VRIN, BXD,
RC9, IMP, DISC)
MMPI®-3 Police Candidate Interpretive Report ID: Mr. E
10/14/2019, Page 12
SA
MP
LE
ENDNOTES
This section lists for each statement in the report the MMPI-3
score(s) that triggered it. In addition, each
statement is identified as a Test Response, if based on item
content, a Correlate, if based on empirical correlates,
or an Inference, if based on the report authors' judgment. (This
information can also be accessed on-screen by
placing the cursor on a given statement.) For correlate-based
statements, research references (Ref. No.) are
provided, keyed to the consecutively numbered reference list
following the endnotes.
1 Test Response: DOM=69
2 Correlate: DOM=69, Ref. 1, 2, 3, 5, 6, 13
115. RESEARCH REFERENCE LIST
The following studies are sources for empirical correlates
identified in the Endnotes section of this report.
1. Ayearst, L. E., Sellbom, M., Trobst, K. K., & Bagby, R. M.
(2013). Evaluating the interpersonal content of
the MMPI-2-RF Interpersonal Scales. Journal of Personality
Assessment, 95(2), 187–196.
https://doi.org/10.1080/00223891.2012.730085
2. Ben-Porath, Y. S., & Tellegen, A. (2020). The Minnesota
Multiphasic Personality Inventory-3 (MMPI-3):
Technical manual. University of Minnesota Press.
3. Cox, A., Courrégé, S. C., Feder, A. H., & Weed, N. C.
(2017). Effects of augmenting response options of
the MMPI-2-RF: An extension of previous findings. Cogent
Psychology, 4(1), 1323988.
https://doi.org/10.1080/23311908.2017.1323988
116. 4. Detrick, P., Ben-Porath, Y.S., & Sellbom, M. (2016).
Associations between MMPI-2-RF (Restructured
Form) and Inwald Personality Inventory (IPI) scale scores in a
law enforcement preemployment screening
sample. Journal of Police and Criminal Psychology, 31, 81–95.
https://doi.org/10.1007/s11896-015-9172-7
5. Kastner, R. M., Sellbom, M., & Lilienfeld, S. O. (2012). A
comparison of the psychometric properties of the
Psychopathic Personality Inventory full-length and short-form
versions. Psychological Assessment, 24(1),
261–267. https://doi.org/10.1037/a0025832
6. Menton, W. H., Crighton, A. H., Tarescavage, A. M., Marek,
R. J., Hicks, A. D., & Ben-Porath, Y. S.
(2019). Equivalence of laptop and tablet administrations of the
Minnesota Multiphasic Personality Inventory-2
Restructured Form. Assessment, 26(4), 661–669.
https://doi.org/10.1177/1073191117714558
7. Roberts, R. M., Tarescavage, A. M., Ben-Porath, Y. S., &
Roberts, M. D. (2018). predicting
post-probationary job performance of police officers using CPI
and MMPI-2-RF test data obtained during
preemployment psychological screening. Journal of Personality
Assessment, 101(5), 544–555.
https://doi.org/10.1080/00223891.2018.1423990
8. Tarescavage, A. M., Brewster, J., Corey, D. M., & Ben-
Porath, Y. S. (2015). Use of pre-hire Minnesota
Multiphasic Personality Inventory-2-Restructured Form (MMPI-
2-RF) police candidate scores to predict
supervisor ratings of post-hire performance. Assessment, 22(4),
411–428.
https://doi.org/10.1177/1073191114548445
117. 9. Tarescavage, A. M., Corey, D. M., & Ben-Porath, Y. S.
(2015). Minnesota Multiphasic Personality
Inventory-2-Restructured Form (MMPI-2-RF) predictors of
police officer problem behavior. Assessment,
22(1), 116–132. https://doi.org/10.1177/1073191114534885
10. Tarescavage, A. M., Corey, D. M., & Ben-Porath, Y. S.
(2016). A prorating method for estimating
MMPI-2-RF scores from MMPI responses: Examination of score
fidelity and illustration of empirical utility in
the PERSEREC police integrity study sample. Assessment,
23(2), 173–190.
https://doi.org/10.1177/1073191115575070
11. Tarescavage, A. M., Corey, D. M., Gupton, H. M., & Ben-
Porath Y.S. (2015). Criterion validity and
practical utility of the Minnesota Multiphasic Personality
Inventory-2-Restructured Form (MMPI-2-RF) in
assessments of police officer candidates. Journal of Personality
Assessment, 97(4), 382–394.
https://doi.org/10.1080/00223891.2014.995800
12. Tarescavage, A. M., Fischler, G. L., Cappo, B. M., Hill, D.
O., Corey, D. M., & Ben-Porath, Y. S. (2015).
Minnesota Multiphasic Personality Inventory-2-Restructured
Form (MMPI-2-RF) predictors of police officer
problem behavior and collateral self-report test scores.
Psychological Assessment, 27(1), 125–137.
https://doi.org/10.1037/pas0000041
MMPI®-3 Police Candidate Interpretive Report ID: Mr. E
10/14/2019, Page 14
SA
MP
120. related to CWBs and has a negative impact on the criterion-
related validity of Conscientiousness as
a predictor of CWBs.
For more than 15 years, meta-analytic efforts aimed at
examining personality–performance
relationships (e.g., Barrick & Mount, 1991; Tett, Jackson, &
Rothstein, 1991) have been cited
as evidence of the utility of personality inventories. Although
recent work has questioned the
validity of personality measures (e.g., Morgeson et al., 2007),
particularly by noting significant
concern over the use of self-report assessments, this criticism
has spurred strong rebuttals out-
lining the value of personality variables in organizations (e.g.,
Ones, Dilchert, Viswesvaran, &
Judge, 2007; Tett & Christiansen, 2007). One of the
controversial issues related to personality
testing has been the pervasive concern over the potential for job
applicants to provide exagger-
ated or distorted responses to self-report personality
assessments (Griffith & McDaniel, 2006;
Schmitt & Oswald, 2006). This phenomenon has typically been
referred to as applicant faking.
Although the body of faking literature has grown considerably
in recent years, methodological
challenges may have contributed to the slow progress of
research examining the issue.
Correspondence should be sent to Richard L. Griffith, Florida
Institute of Technology, College of Psychology and
Liberal Arts, 150 West University Boulevard, Melbourne, FL
32901. E-mail: [email protected]
121. FAKING AND COUNTERPRODUCTIVE WORK BEHAVIORS
271
From the earliest studies on faking to the most current
approaches, researchers have strived
to develop a methodology that is capable of capturing and
explaining this complex behavior.
This struggle is apparent given the large number of strategies
employed to study faking that can
be found in the extant literature. These methodologies have
included examinations of directed
or motivated faking in the laboratory (e.g., McFarland & Ryan,
2000), between-subjects inves-
tigations of applicant-incumbent differences (e.g., Hough,
Eaton, Dunnette, Kamp, & McCloy,
1990), social desirability scales (e.g., Ones, Viswesvaran, &
Reiss, 1996), self-reported faking
(e.g., Donovan, Dwight, & Hurtz, 2003), the use of deception to
simulate an applicant setting
(e.g., Griffith, Malm, English, Yoshita, & Gujar, 2006), Monte
Carlo simulations (e.g., Converse,
Peterson, & Griffith, 2009; Komar, Brown, Komar, & Robie,
2008; Schmitt & Oswald, 2006), and
finally, within-subjects designs with applicant samples (e.g.,
Arthur, Glaze, Villado, & Taylor,
2010; Ellingson, Sackett, & Connelly, 2007; Griffith,
Chmielowski, & Yoshita, 2007; Hogan,
Barrett, & Hogan, 2007). The study of faking behavior has also
been extended to biodata ques-
tionnaires, with researchers comparing the responses of job
applicants to samples of participants
instructed to fake-good or respond candidly (e.g., Becker &
Colquitt, 1992). The widely vary-
ing methods employed in the study of faking behavior have
nonetheless left the body of literature
without a conclusive answer to questions regarding the
122. prevalence and personnel selection-related
impact of faking behavior.
Recent work has examined faking behavior of actual job
applicants via examinations of
within-subjects score change across conditions that should vary
in their motivational influences
on respondent behavior (Arthur et al., 2010, Ellingson et al.,
2007; Griffith et al., 2007; Hogan
et al., 2007). Despite these studies’ strengths, they have by no
means offered an unequivocal
answer to the questions surrounding the faking phenomenon.
Our goal in the present study, there-
fore, was to attempt to extend the findings of these studies by
using a within-subjects investigation
of faking in real job applicants. In addition, we attempt to
highlight the key differences in con-
clusions regarding the occurrence and impact of faking behavior
when different methodologies
are employed to study the phenomenon.
WITHIN-SUBJECTS DESIGNS USING APPLICANT DATA
The use of within-subjects methodologies in the study of faking
behavior offers several benefits.
Most important, within-subjects designs allow the researcher to
directly observe individual-level
score changes on personality scales across assessment contexts
(e.g., applicant vs. research)
rather than measuring additional variables (e.g., social
desirability, bogus item endorsement) and
using those measurements to make inferences regarding the
occurrence of faking. In addition,
within-subjects designs allow for the identification of
individuals engaging in faking behavior
using confidence interval methodologies that account for the
123. measurement error inherent in per-
sonality assessments (e.g., Griffith et al., 2007). A real-world
within-subjects applicant faking
design allows researchers to collect data in a setting where
respondents may be naturally inclined
to respond in a socially desirable manner (Ellingson, Sackett, &
Hough, 1999). In addition,
from a measurement perspective, this design provides a
mechanism to analyze the consistency
of responses as well as maximizing the power of each
observation (D. T. Campbell & Stanley,
1963). Ryan and Boyce (2006) noted that this type of a design
represents the “gold-standard”
(p. 363) of faking research designs.
272 PETERSON ET AL.
Several within-subjects studies have recently appeared in the
faking literature; however, they
have not resulted in an unequivocal answer to the question of
whether faking is a common
occurrence in real selection settings (Arthur et al., 2010,
Ellingson et al., 2007; Griffith et al.,
2007; Hogan et al., 2007). First, Ellingson et al. (2007) used a
within-subjects design to exam-
ine score change across selection and personal development
contexts. Using a large archival
data set, the authors identified individuals who had completed a
personality assessment on two
occasions across four specific types of test–retest conditions
(i.e., development–development,
development–selection, selection–development, selection–
selection). Ellingson et al. (2007)
argued that score change across the two contexts was subject to
124. a variety of influences (beyond
faking), including personality change due to developmental
feedback and personality change
over time. In an attempt to isolate the effects of faking on score
change (which, as the authors
noted, should only occur in the development–selection or
selection–development conditions),
the authors controlled for potential true personality change over
time and potential change due
to developmental feedback. In the end, this procedure resulted
in a negligible effect size for
faking across contexts (d = .075) when effect sizes were
averaged across the 18 California
Psychological Inventory (CPI) subscales. However, effect sizes
for single personality scales
within the full assessment were as high as .64 for the
development–selection context, with several
scales demonstrating effect sizes greater than .40.
In another within-subjects investigation, Hogan et al. (2007)
used archival data to examine
personality change in a sample of individuals who retook an
assessment after being denied
employment. Hogan et al. suggested that this represented a
condition in which individuals should
have been motivated to engage in distortion in order to improve
their scores on the assessment.
Like Ellingson et al. (2007), Hogan et al. also found little
evidence of faking. The authors noted
that only a small portion of the sample (anywhere from 1.7% to
5.2% of applicants across scales)
significantly raised their scores on the second assessment, with
only .06% doing so on all five
personality scales. In addition, due to evidence suggesting that
score change was normally dis-
tributed, with a mean of zero, the authors argued that most score
125. changes were the result of
random measurement error.
In contrast to the findings of Ellingson et al. (2007) and Hogan
et al. (2007), recent work by
Griffith et al. (2007) and Arthur et al. (2010) found
considerable evidence of faking in appli-
cant samples. Griffith et al. (2007) used a within-subjects
design to examine faking (via score
change from applicant to honest assessments) in a sample of
applicants to a temporary employ-
ment agency. The authors reported significant mean-level score
differences between applicant
and honest responses, in addition to finding that between 22%
and 49% of applicants faked their
responses (depending upon how the faking variable was
operationalized). In addition, the authors
noted changes in simulated individual hiring decisions across
the applicant and research con-
texts. Although the comparison of responses across applicant
and research contexts represented
an effective measurement of faking, the small and unique
(temporary employees) sample may
limit the generalizability of the Griffith et al. (2007) study.
Arthur et al. (2010) examined the prevalence of applicant faking
in an unproctored internet
testing selection setting across two studies. The authors
gathered personality test responses from
a sample of job applicants who were subsequently contacted
(typically after more than 1 year) and
asked to take part in a research study using the same measure of
personality. Across both studies,
Arthur et al. reported significant mean-level differences
between applicant and research context
scores (with applicant condition scores being higher) and
126. percentages of individuals identified as
FAKING AND COUNTERPRODUCTIVE WORK BEHAVIORS
273
having significantly elevated applicant scores (i.e., applicant
scores exceeding the upper bound of
a confidence interval formed around the research context score)
ranging from 15 to 36% across
the Big Five dimensions.
Although the prevalence of within-subjects investigations of
faking behavior in samples of
real job applicants has recently increased, the discord in
findings across these studies suggests
that more thorough investigations using similar methodologies
are warranted. Furthermore, given
the methodological challenges inherent in carrying out a within-
subjects investigation of faking
behavior with job applicants, additional research employing
such designs has the potential to add
not only to our understanding of the nature of faking behavior
but also to spur new methodolog-
ical innovations on the part of researchers. In the present
investigation, we sought to extend the
findings of the aforementioned studies by examining the
prevalence and correlates of applicant
faking using a within-subjects design with real job applicants.
Most directly, this study extends
the methodologies employed by Arthur et al. (2010) and Griffith
et al. (2007) by gathering data
from participants across job applicant and research contexts.
We believe that the present study offers a useful extension and
127. contribution to the literature
in that we also examined correlates of faking behavior from
three perspectives. First, we set out
to investigate the degree to which a measure of social
desirability (SD) was sensitive to actual
score elevation in the applicant context. Next, we attempted to
determine whether the extent to
which individuals engage in faking behavior was associated
with other negative workplace behav-
iors, namely, self-reported counterproductive work behaviors
(CWBs). Finally, we examined the
degree to which faking resulted in decrements to the validity of
Conscientiousness as a predictor
of self-reported CWB.
THE CURRENT STUDY
The present study represents an extension of the works by
Arthur et al. (2010) and Griffith et al.
(2007) in that job applicants completed an assessment of
Conscientiousness during an employ-
ment screening process and completed a second administration
of the assessment in a research
context. Based on fact that the present study used similar
methodology to Arthur et al. and
Griffith et al. (2007), we expected to replicate the findi ngs of
these earlier works. Therefore,
we hypothesized the following:
H1: Conscientiousness scores obtained in the applicant context
will be significantly higher
than Conscientiousness scores from a research administration of
the same assessment.
H2: A significant number of individuals will be identified as
having faked the
128. Conscientiousness measure in the applicant condition, such that
their applicant scores
exceed the upper bound of a 95% confidence interval
surrounding their score from the
research context.
SD Scores as Indicators of Applicant Faking
Many faking studies have used SD scales as indicators of faking
behavior (e.g., Hough et al.,
1990; Ones et al., 1996). These studies have frequently been
cited as evidence that faking does
not represent a legitimate concern for organizations using
personality assessments (e.g., Ones
274 PETERSON ET AL.
et al., 1996). However, the use of SD scales to identify or
correct for response distortion has been
questioned in terms of both its methodological soundness (e.g.,
Burns & Christiansen, 2006;
Griffith & Peterson, 2008; Smith & Ellingson, 2002) and its
usefulness in improving selection
outcomes (e.g., Schmitt & Oswald, 2006). Specifically,
researchers have expressed concern over
whether SD scales are assessing individual variation in response
styles, or substantive personality
variance. Smith and Ellingson (2002) found that SD
demonstrated consistent relationships with
the Big Five traits of Conscientiousness and neuroticism. In
addition, several authors have noted
that individuals may attempt to tailor their responses to
multidimensional personality inventories
to fit the requirements of specific positions (e.g., Birkeland,
129. Manson, Kisamore, Brannick, &
Smith, 2006; Mahar et al., 2006). For example, Becker and
Colquitt (1992) found that the most
job relevant items on a biodata questionnaire tended to be most
prone to faking by applicants. If
this is in fact the case, then the use of SD scales in practice is
questionable due to the fact that this
method assumes that individuals are faking to a similar degree
across all scales of the personality
inventory.
Although evidence gathered from directed faking manipulations
(e.g., Hough et al., 1990)
suggests that SD scales are associated with response distortion,
this finding has yet to be
consistently replicated in within-subjects investigations of
faking using actual applicant sam-
ples. An additional within-subjects investigation of faking
carried out by Griffith et al. (2006)
provided little support for the validity of SD scales as indicators
of faking. Griffith et al.
reported correlations between applicant faking on the
Conscientiousness scale of the NEO-Five
Factor Inventory (Costa & McCrae, 1992) and scores on the
Impression Management and Self-
Deceptive Enhancement subscales of the Balanced Inventory of
Desirable Responding (Paulhus,
1998) of .11 and .12 (both nonsignificant), respectively. Griffith
et al. (2006), however, used a
simulated applicant setting in which students were led to
believe they were applying for a job,
rather than data gathered from real job applicants.
There appears to be little evidence of a relationship between
applicant faking and SD scores.
Therefore, we hypothesized the following with regard to SD
130. measures as indicators of faking
behavior:
H3: Scores on a measure of SD will not be significantly related
to applicant faking on the
Conscientiousness measure when operationalized as score
change from the applicant to
research contexts.
H4: Classifications of individual respondents suspected of
faking using a measure of SD
will be statistically independent of classifications using
significant within-subjects score
change.
Applicant Faking and the Prediction of CWBs
Previous investigations examining faking as a potential threat to
the validity of personality vari-
ables as predictors of job performance have offered widely
varied conclusions. Studies using
measures of social desirability (e.g., Barrick & Mount, 1996;
Hough et al., 1990; Ones et al.,
1996) as indicators of faking behavior, or simulating the impact
of corrections for social desir-
ability (e.g., Schmitt & Oswald, 2006) have typically found that
faking has little influence on the
criterion-related validity of personality assessments. In contrast,
additional studies using directed
faking manipulations (e.g., Mueller-Hanson, Heggestad, &
Thornton, 2003) and Monte Carlo
FAKING AND COUNTERPRODUCTIVE WORK BEHAVIORS
275
131. simulation (e.g., Converse et al., 2009; Komar et al., 2008) have
reported findings suggesting
that faking has the potential to negatively impact selection
outcomes. The studies just mentioned,
however, devoted little attention to the variety of performance
criteria that personality variables
may predict.
As a meta-analysis by Hogan and Holland (2003) demonstra ted,
the greatest predictive poten-
tial for personality variables may likely be in the prediction of
specific or narrow performance
criteria. With several multidimensional conceptualizations of
the job performance domain gain-
ing widespread acceptance from researchers (e.g., J. P.
Campbell, McCloy, Oppler, & Sager,
1993; Motowidlo, Borman, & Schmit, 1997), personality
researchers have an array of potential
criterion variables to work with. Furthermore, this call for a
broader conceptualization of the
performance domain has also been extended to examinations of
applicant faking (Peterson &
Griffith, 2006).
CWBs represent one specific aspect of organizational behavior
that has demonstrated con-
sistent relationships with personality variables. These behaviors
typically encompass actions
that go against organizational norms and have the potential to
negatively impact both the
organization and the individuals comprising it (Berry, Ones, &
Sackett, 2007). Two recent meta-
analyses (Berry et al., 2007; Salgado, 2002) have identified the
personality variable of interest
in the present study, Conscientiousness, as a consistent
132. predictor of CWBs (i.e., conscientious
individuals are less likely to engage in CWBs).
Faking has the potential to both play a role in the ability of
personality variables, like con-
scientiousness, to predict CWBs and functioning as a predictor
of counterproductive behavior
in its own right. First, as the meta-analyses by Berry et al.
(2007) and Salgado (2002) described,
Conscientiousness is a valid predictor of CWB. Therefore,
faking behavior should have the poten-
tial to impact the correlation between CWBs and
Conscientiousness in this specific case. Based
on the literature just discussed, as well as our expectations for
the lack of congruence between
within-subjects score change and SD scores, we tested the
following hypotheses:
H5a: Applicant faking will have a negative impact on the
criterion-related validity of appli-
cant Conscientiousness scores as predictors of self-reported
CWB, such that when
individuals exhibiting significant within-subjects score change
are removed from the
sample, validity will improve significantly.
H5b: Applicant faking will have a negative impact on the
criterion-related validity of appli-
cant Conscientiousness scores as predictors of self-reported
CWB, such that when the
applicant condition scores of individuals exhibiting significant
within-subjects score
change are replaced with their scores from the research
administration, validity will
improve significantly.
133. H6a: Partialing variance associated with SD scores from the
relationship between appli-
cant Conscientiousness and self-reported CWB will not have a
significant effect on
criterion-related validity.
H6b: Corrections for SD will be ineffective, such that when the
applicant condition scores
of individuals exhibiting elevated SD scale scores are replaced
with their scores from
the research administration, validity will not improve
significantly.
As Peterson and Griffith (2006) noted, using definitions of
faking that treat the behavior as a
form of deception aimed at obtaining a desired outcome (e.g.,
Griffith & McDaniel, 2006), we
may also see a link between faking and other deceptive or
deviant organizational behaviors. In
276 PETERSON ET AL.
a recent theoretical model of applicant faking, Goffin and Boyd
(2009) noted that personality
variables like integrity, in addition to a variable the authors
referred to as “moral code,” may
influence faking motivation. This theory is consistent with
previous models of faking behavior
suggesting integrity as a predictor of faking (e.g., McFarland &
Ryan, 2000). If factors like low
integrity and a moral code that does not deter one from
engaging in deceptive behaviors are key
contributors to faking motivation, then it is likely that faking
should relate to other negative orga-
134. nizational behaviors. Although this link has not been thoroughly
examined empirically, one study
by Rosse, Levin, and Nowicki (1999) found that faking was
related to negative work behaviors
in a customer service position. An additional point worth noting
that faking motivation does not
necessarily translate into observed faking behavior (as it is
traditionally measured). Therefore,
there is a possibility that individuals who are attempting to fake
may be more likely to engage in
other negative behaviors, regardless of the success of their
faking attempts.
H7: The amount of applicant faking will be significantly
positively related to self-reported
CWBs.
In the present study, we chose to examine the relationship
between faking and CWBs using a
difference score operationalization, as well as polynomial
regression analysis (both of which
are discussed in greater detail in the Method section).
Polynomial regression analysis was used
as a means of examining faking as a predictor of CWBs due to
the concerns that have been
expressed regarding the use of difference scores as predictor
variables in regression analysis
(e.g., Edwards, 1994) and the ability of polynomial regression
to explicitly test of the constraints
implicitly imposed by difference scores. In addition, an
examination of the parameters of the
polynomial regression model can be used to test directional
hypotheses about the influence of
the difference score variables on the outcome (Edwards, 1994;
Edwards & Parry, 1993). Finally,
the polynomial model offers a direct means of examining
135. whether the act of faking (i.e., score
change in either a positive or negative direction) predicts
CWBs.
METHOD
Participants
Data for the present study were drawn from a sample of
applicants to manufacturing positions
in a large automotive and industrial component manufacturer.
Applicants completed an online
battery of assessments designed and administered by a third-
party consulting firm. Descriptions
of parts of this Web-based assessment system, the Select
Assessment® for Manufacturing, have
appeared elsewhere in the literature (c.f. Bott, O’Connell,
Ramakrishnan, & Doverspike, 2007;
O’Connell, Hartman, McDaniel, Grubb, & Lawrence, 2007). At
the end of the battery, applicants
were presented with a prompt informing them of the opportunity
to take part in an independent
research study. The applicants were informed that their
participation in the study would result in
their entry into a drawing for one of several cash prizes (up to
$1,000).
In total, 3,276 applicants indicated that they were willing to be
contacted about the research
opportunity at a later date. This sample of individuals was then
contacted by the researchers
6 weeks after completing the applicant assessments, at which
time they were reinformed of the
cash prize drawing and provided with a link to complete a
second set of assessments. Of the 3,276
136. FAKING AND COUNTERPRODUCTIVE WORK BEHAVIORS
277
individuals who agreed to be contacted, 206 (6%) followed-
through on completion of the second
set of assessments. Applicant data for 10 participants were not
usable, leaving a final sample of
196 for the present study. The final sample retained for analysis
was 71% male and 29% female.
Given the low response rate, we chose to compare the applicant
Summated Conscientiousness
Scale (SCS) scores of the sample that completed the full study
(N = 196) to those drawn from
the sample that initially agreed to participate but did not
complete the second portion of the
study (N = 2,893). The two groups had similar means (88.31 and
88.64, respectively) and stan-
dard deviations (7.88 and 8.34, respectively), and an
independent-samples t test confirmed that
mean SCS scores from the two groups were not significantl y
different, t(2, 3087) = 1.10, ns.
Furthermore, the d-effect size of this difference was also small
(d = .04).
Measures
Conscientiousness
The SCS, a shortened version of the scale used by Griffith et al.
(2007), was used as an
assessment of Conscientiousness in the current study. The
original scale used in the Griffith
et al. (2007) study comprised 30 items, using a 7-point response
137. scale ranging 1 (strongly dis-
agree) to 7 (strongly agree). Griffith et al. (2007) reported an
internal consistency reliability of
.84, and 1-month test–retest reliability of .86. In addition, the
authors reported a correlation of
r = .76 (p < .05) between the SCS and the 12-item NEO-Five
Factor Inventory Conscientiousness
scale (Costa & McCrae, 1992). Further refinement of the scale
via exploratory factor analysis
resulted in the removal of the 10 items that demonstrated the
lowest factor loadings on the single
Conscientiousness factor. The current version of the scale
comprised 20 items using a 5-point
response scale ranging 1 (strongly disagree) to 5 (strongly
agree).
Applicant Faking
Following the methodology used by Griffith et al. (2007),
applicant faking was assessed
via individual change scores across the applicant and research
administrations of the SCS
(faking = applicant condition score – research condition score).
This operationalization creates
a continuous faking score for each participant and has been
widely used in examinations of fak-
ing behavior (Ellingson et al., 2007; McFarland & Ryan, 2000,
2006; Mueller-Hanson et al.,
2003). Although the reporting and use of raw change scores as
operationalizations of faking
behavior is acceptable in some cases, the general use of
difference scores as predictors or cri-
teria in regression analysis has been criticized for a number of
reasons (Edwards, 1993, 2001).
Specifically, the use of difference scores as predictors may be
problematic because they con-
138. found the effects of the original variables on which the
difference is based, creating difficulties
in the conceptual interpretation of significant results. In
response to this and related concerns,
researchers have suggested using polynomial regression as an
alternative to difference scores
(Edwards, 2002).
Therefore, we used a combination of polynomial regression and
response surface modeling
to investigate the joint influence of the Applicant and Honest
SCS scores on CWBs. H7 pre-
dicts a positive relationship between the amount of applicant
faking and CWBs. Because faking
was operationalized as the algebraic difference between
Applicant and Honest SCS scores, the
278 PETERSON ET AL.
implied relationship between the difference score components
(i.e., Applicant and Honest SCS
scores) and CWBs is
Z = b0 + b1 (X − Y) + e,
where X represents the Applicant score and Y the Honest score.
This introduces a constraint that
is usually not satisfied in organizational research using
difference scores, namely, that the X and
Y regression coefficients are equal in magnitude and opposite in
sign. An unconstrained version
of this equation is simply
Z = b0 + b1X + b2Y + e,