Downloaded 5,401 times

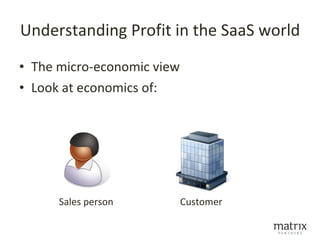
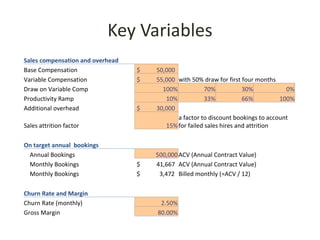
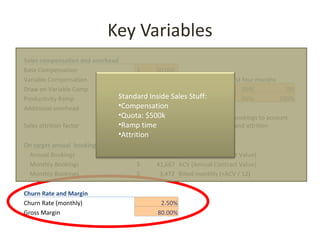
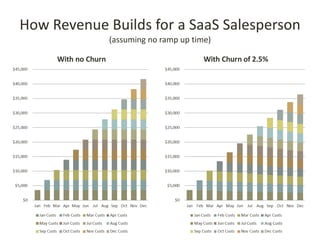
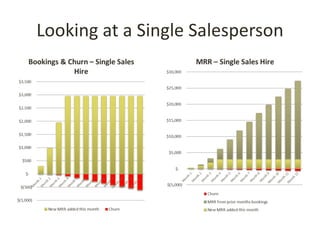
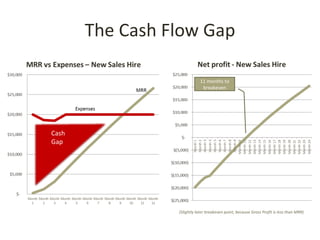
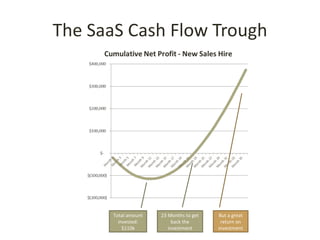

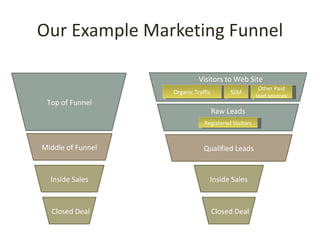
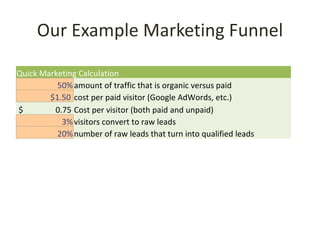
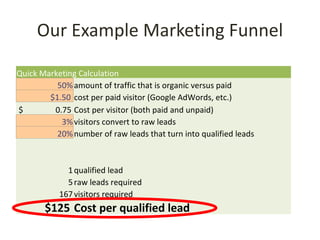
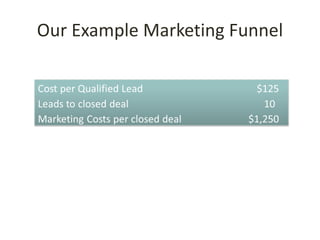
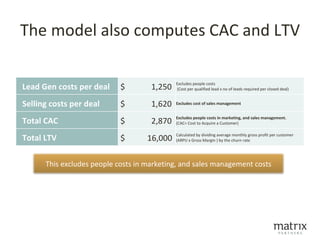
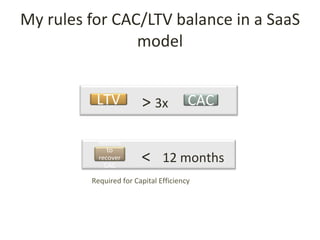
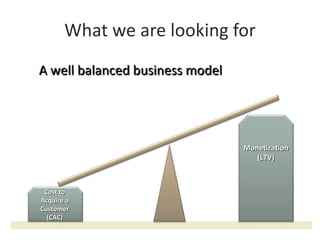
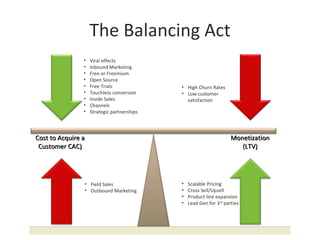

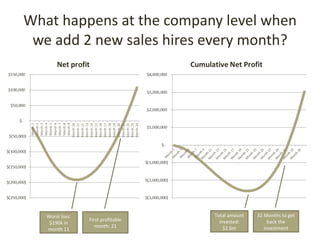
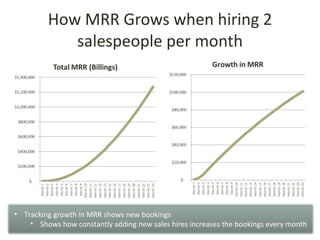
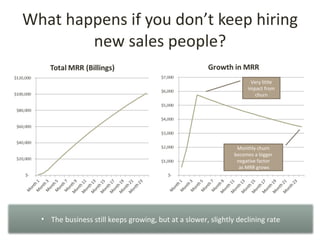
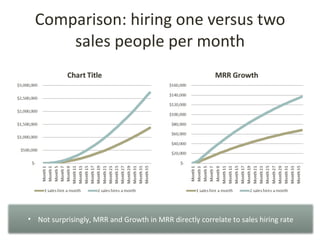
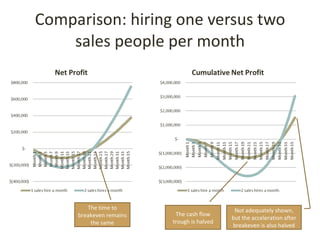

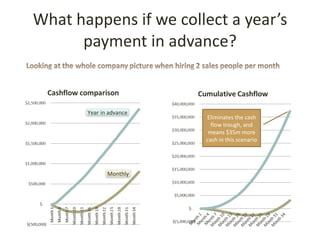

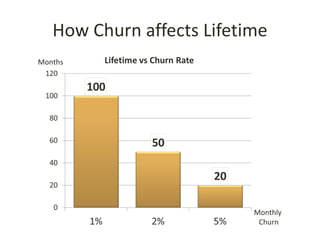
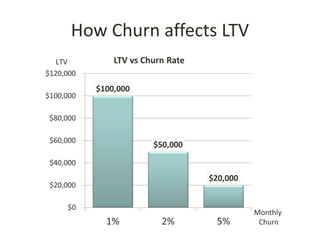
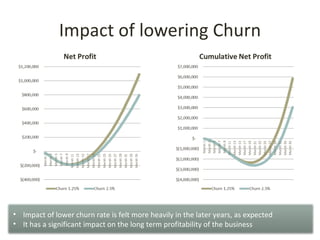
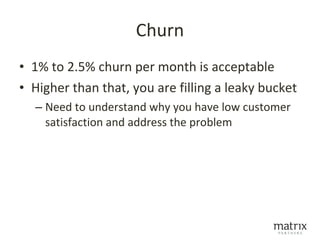
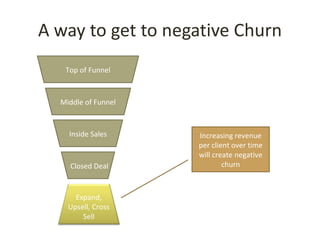
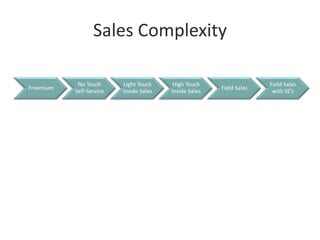
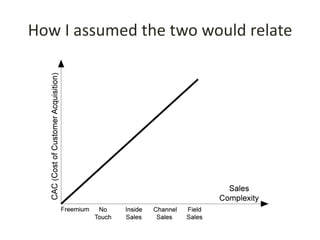
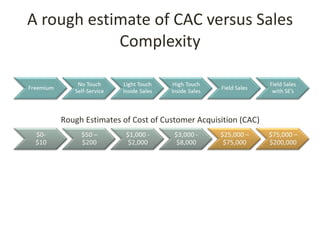
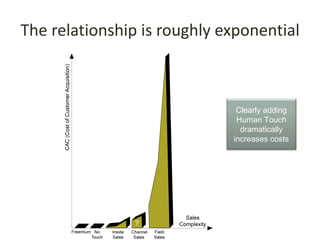
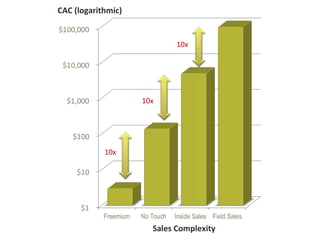
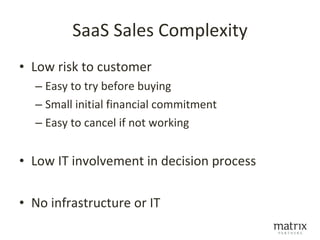
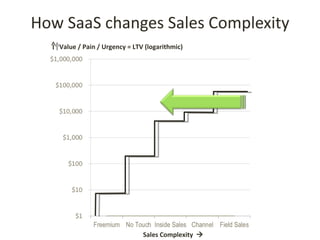

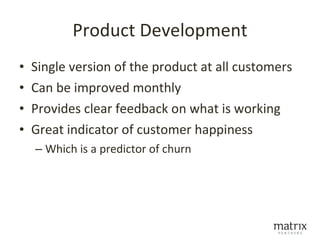


This document discusses key metrics and economics for a SaaS business model. It provides details on sales compensation, bookings targets, churn rates, margins. It examines how revenue is generated from a single salesperson over time. Graphics show how monthly recurring revenue grows as new salespeople are hired each month. Lowering churn rates can significantly impact long-term profits. Collecting payment upfront eliminates cash flow troughs. Sales complexity impacts customer acquisition costs, requiring higher prices and more approval steps. Regular product improvements provide feedback on customer happiness.