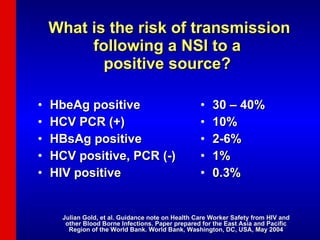
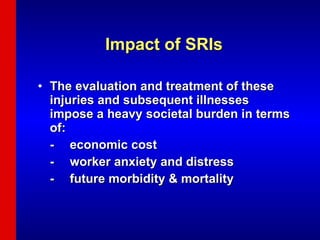
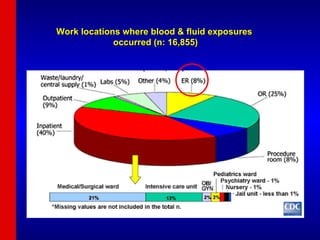
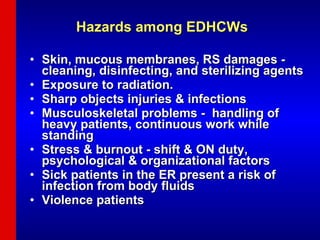
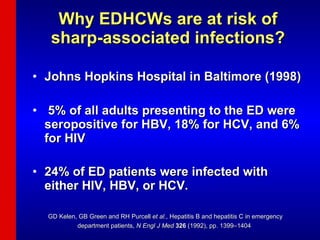
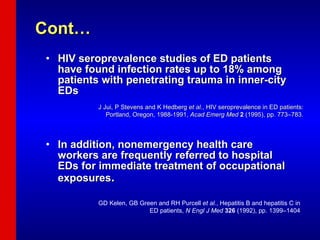
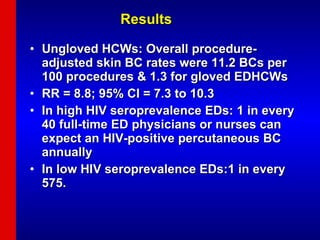
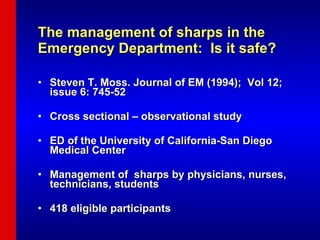
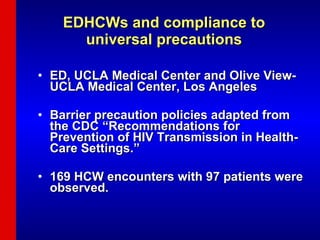
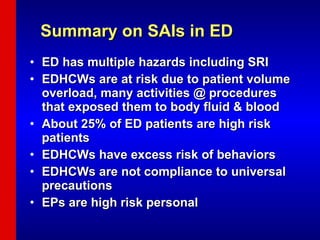
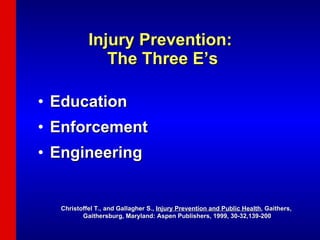
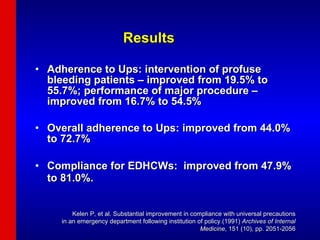
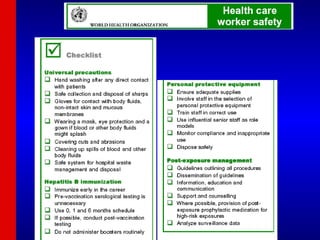
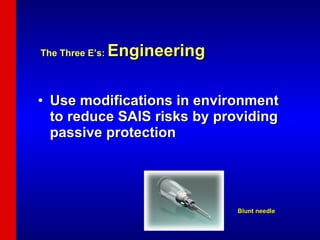
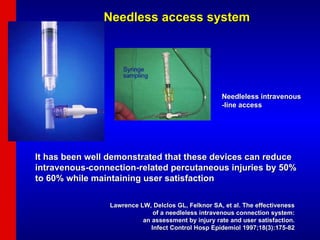
The document discusses sharps associated infections (SAIs) among emergency department healthcare workers (EDHCWs). It finds that EDHCWs face high risk of SAIs due to the large volumes of high-risk patients and invasive procedures in the ED. Compliance with universal precautions among EDHCWs is poor. The document recommends a three-pronged approach of education, enforcement of safety policies, and engineering controls like safety devices to help prevent SAIs among EDHCWs.
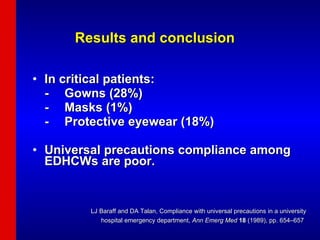
![Curbing Sharps associated Infections in ED Dr. Rashidi Ahmad Medical lecturer/Emergentist School of Medical Sciences USM Health Campus [email_address] Occupational Hazard Workshop 4 th September 2007](https://image.slidesharecdn.com/saiined-091023231356-phpapp02/85/Sai-In-Ed-1-320.jpg)
![Curbing Sharps associated Infections in ED Dr. Rashidi Ahmad Medical lecturer/Emergentist School of Medical Sciences USM Health Campus [email_address] Occupational Hazard Workshop 4 th September 2007](https://image.slidesharecdn.com/saiined-091023231356-phpapp02/75/Sai-In-Ed-1-2048.jpg)
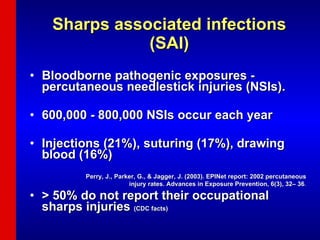
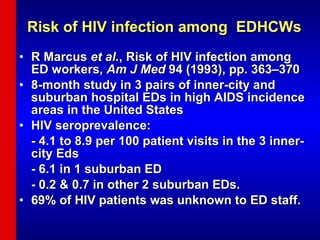
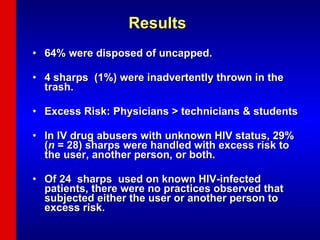
![Excess risk to the user, another person, or both [28% of 418] Excess risk to the user [27%] Excess risk to another person [12%] * Of the 418 observed sharp utilizations, none resulted in a puncture wound](https://image.slidesharecdn.com/saiined-091023231356-phpapp02/85/Sai-In-Ed-23-320.jpg)


![Sharp injuries and needle stick post exposure prophylaxis [compatibility mode]](https://cdn.slidesharecdn.com/ss_thumbnails/sharpinjuriesandneedlestickpostexposureprophylaxiscompatibilitymode-131231013025-phpapp01-thumbnail.jpg?width=640&height=640&fit=bounds)


![ONFH[AVN HIP] -TRIPLE REGIME -A NOVAL SURGICAL CONCEPT .pptx](https://cdn.slidesharecdn.com/ss_thumbnails/onfhavnhip2026koaconcalicutdrgokuldevdrmashraf-260210064517-213ec005-thumbnail.jpg?width=640&height=640&fit=bounds)


