Downloaded 11 times


![Basis
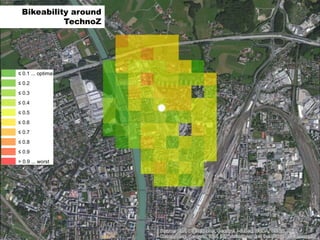
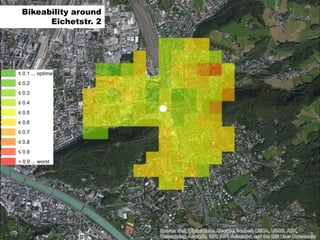
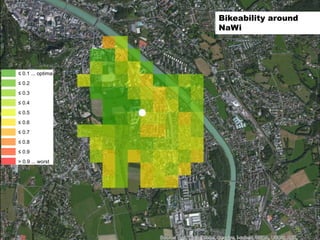
Indicator-based assessment tool [1]
12
[1] LOIDL, M. & ZAGEL, B. Assessing bicycle safety in multiple networks with different data models. In: VOGLER, R., CAR, A., STROBL, J. & GRIESEBNER,
G., eds. GI-Forum, 2014 Salzburg. Wichmann, 144-154.](https://image.slidesharecdn.com/20150204phdintensiveweekqol-150206070246-conversion-gate01/85/Safety-and-accessibility-as-major-keys-for-bicycle-friendly-cities-12-320.jpg)


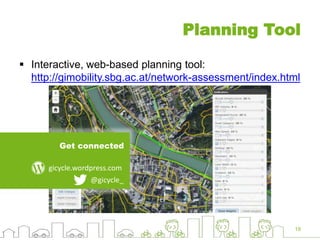

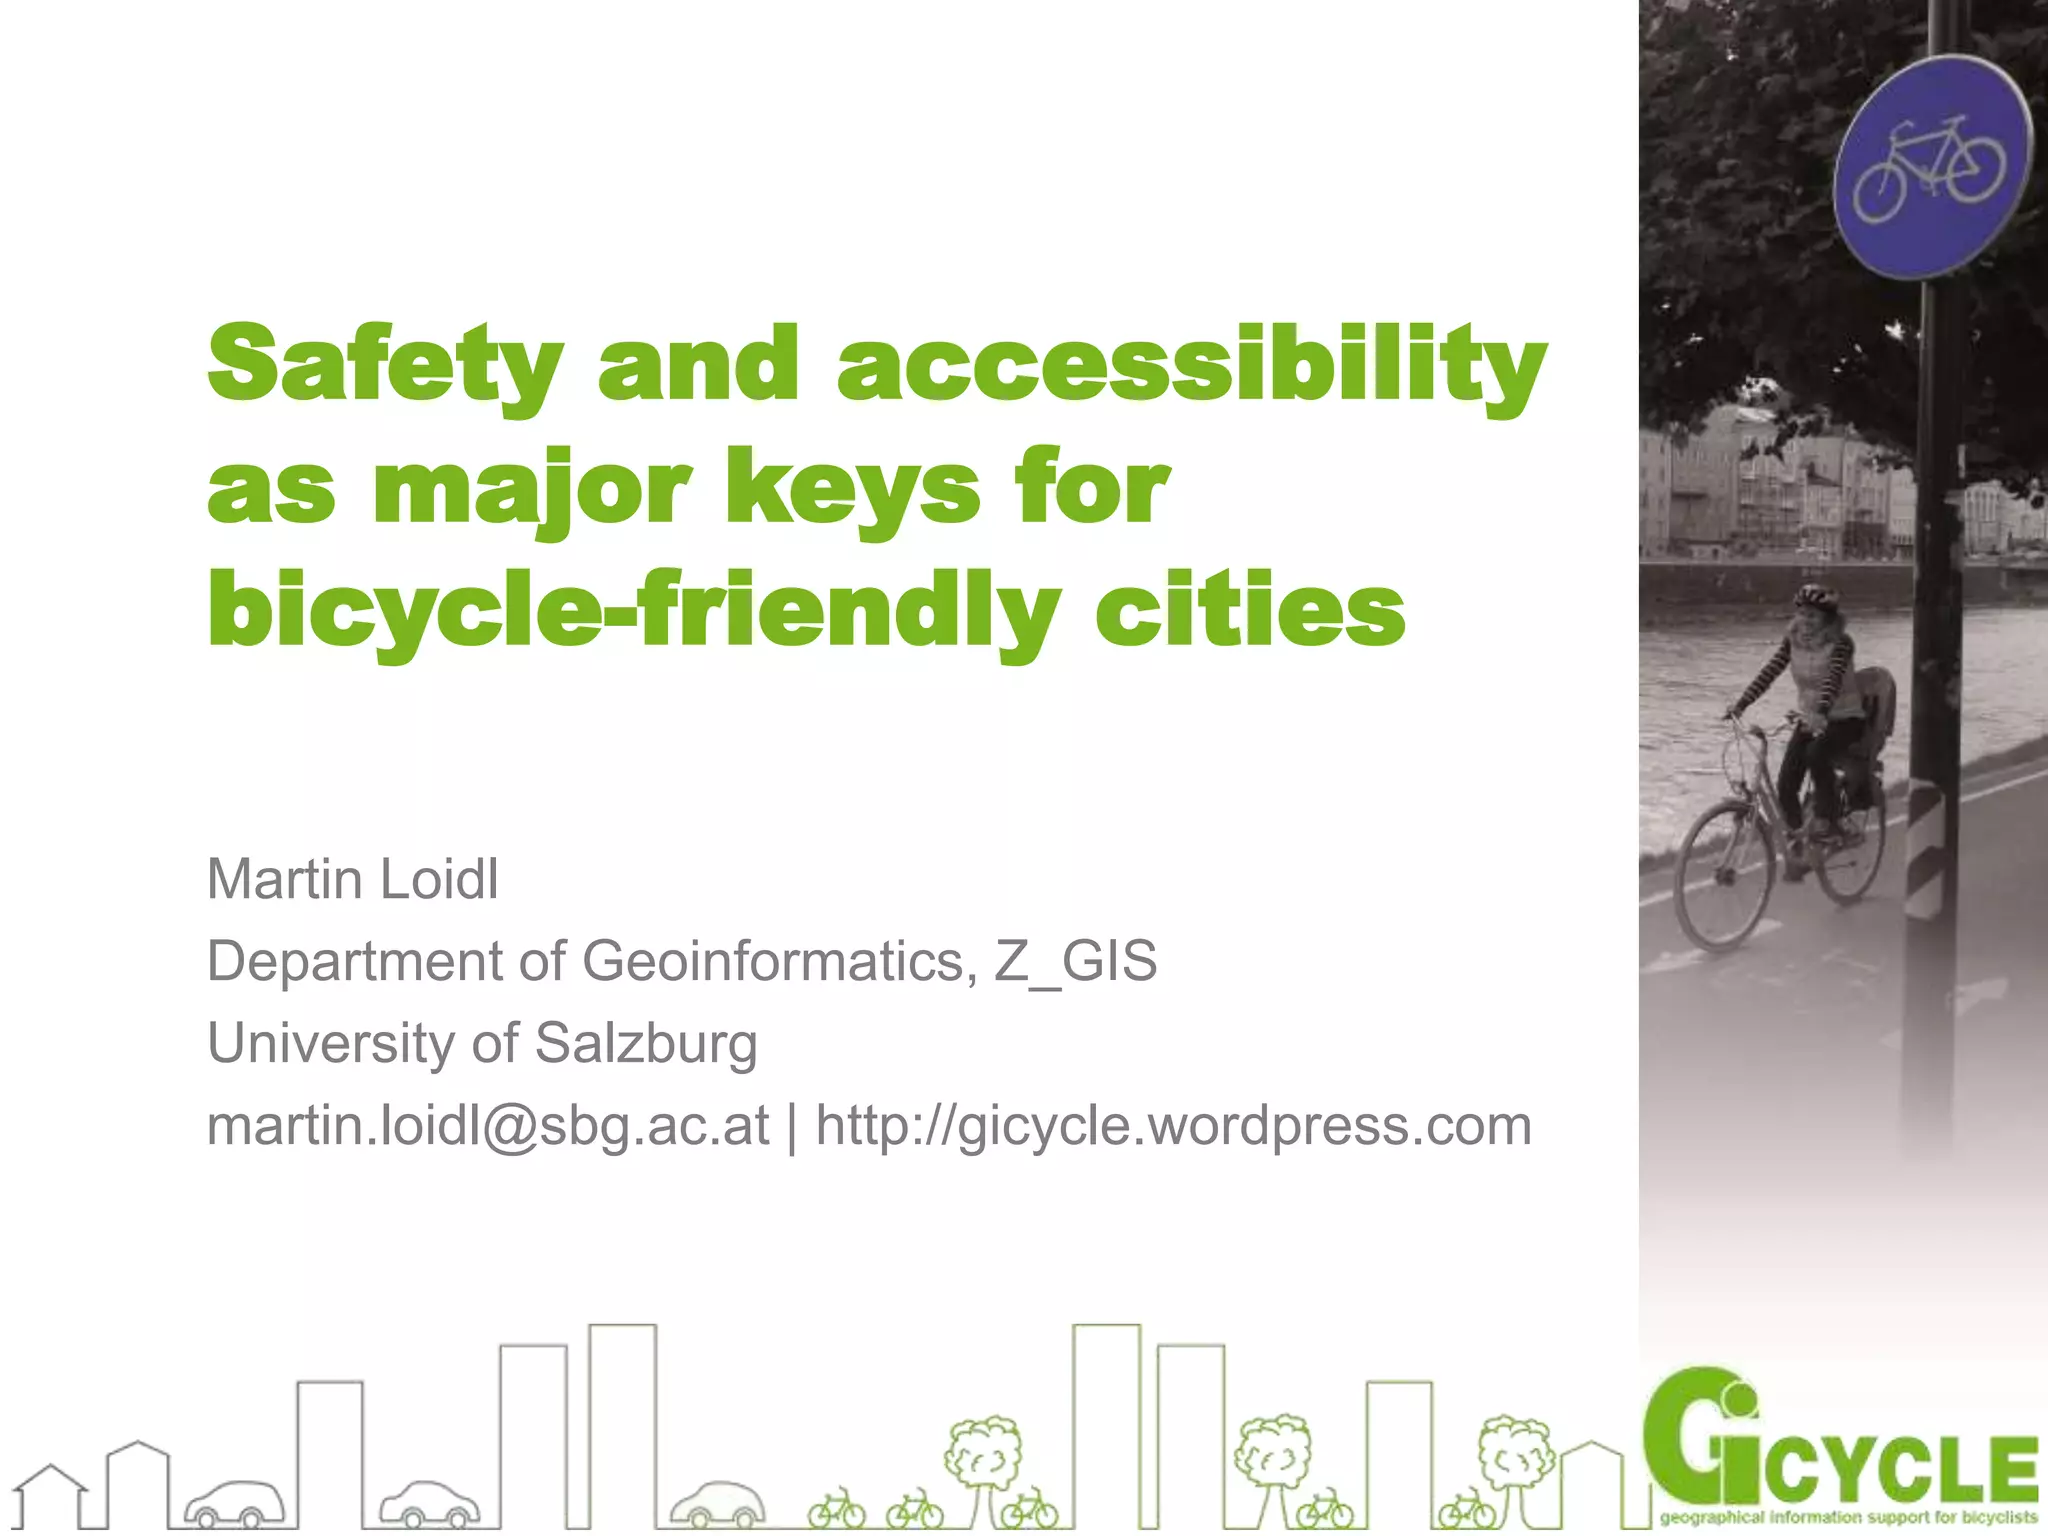
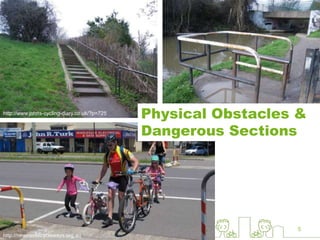
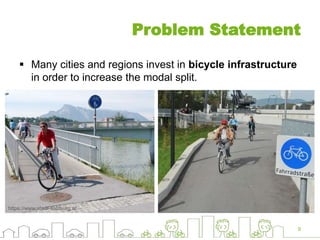
The document discusses the importance of safety and accessibility in creating bicycle-friendly cities, highlighting issues like poor connectivity and physical obstacles that hinder cycling potential. It emphasizes the need for planning that integrates these aspects to enhance bicycle traffic effectiveness. A web-based planning tool and research analysis are proposed to evaluate and improve bike infrastructure.


