Download to read offline
![the effect of correlation coefficients on communities of recommenders neal lathia, stephen hailes, licia capra department of computer science university college london [email_address] ACM SAC TRECK, Fortaleza, Brazil: March 2008 Trust, Recommendations, Evidence and other Collaboration Know-how](https://image.slidesharecdn.com/sac-treck-2008-1206562520431604-5/85/SAC-TRECK-2008-1-320.jpg)
![the effect of correlation coefficients on communities of recommenders neal lathia, stephen hailes, licia capra department of computer science university college london [email_address] ACM SAC TRECK, Fortaleza, Brazil: March 2008 Trust, Recommendations, Evidence and other Collaboration Know-how](https://image.slidesharecdn.com/sac-treck-2008-1206562520431604-5/75/SAC-TRECK-2008-1-2048.jpg)
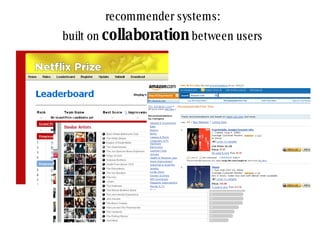
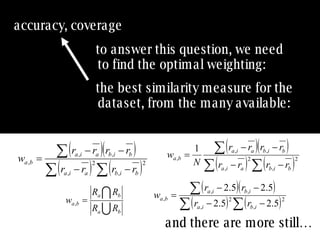
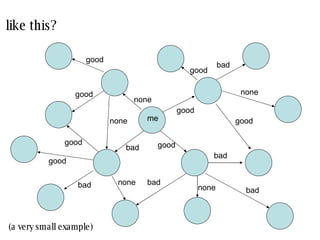
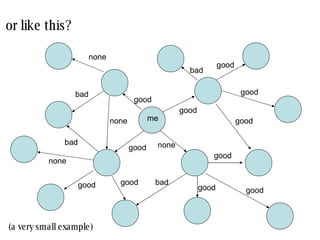
![similarity values depend on the method used: there is no agreement between measures [2] [3] [1] [5] [3] [4] [1] [3] [2] [3] my profile neighbour profile pearson -0.50 weighted- pearson -0.05 cosine angle 0.76 co-rated proportion 1.00 concordance -0.06 bad near zero good very good near zero](https://image.slidesharecdn.com/sac-treck-2008-1206562520431604-5/85/SAC-TRECK-2008-14-320.jpg)
![questions? read more: http://mobblog.cs.ucl.ac.uk trust, recommendations, … neal lathia, stephen hailes, licia capra department of computer science university college london [email_address] ACM SAC TRECK, Fortaleza, Brazil: March 2008 Trust, Recommendations, Evidence and other Collaboration Know-how](https://image.slidesharecdn.com/sac-treck-2008-1206562520431604-5/85/SAC-TRECK-2008-29-320.jpg)

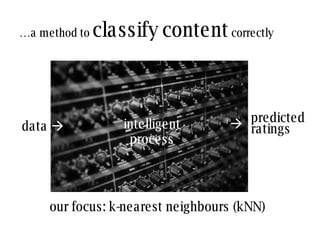
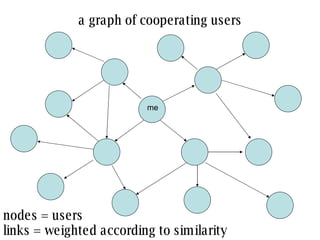
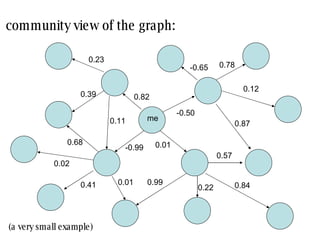
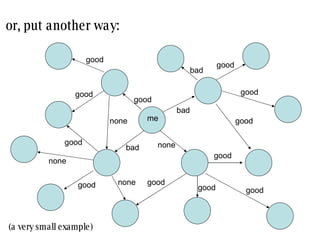
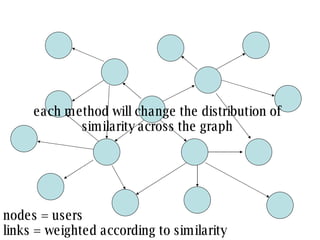
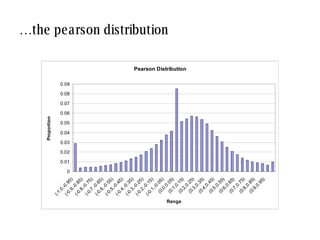
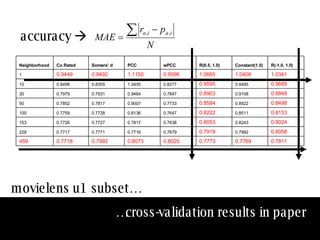
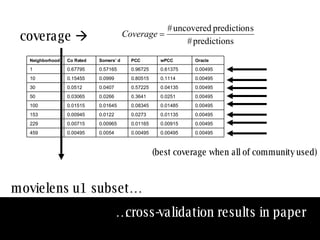
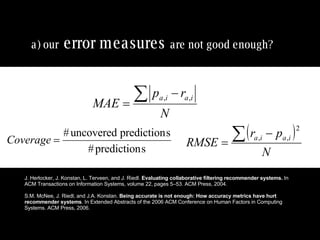
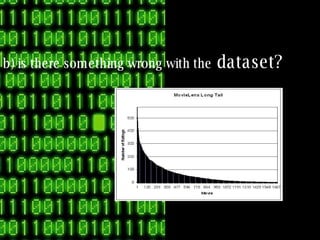
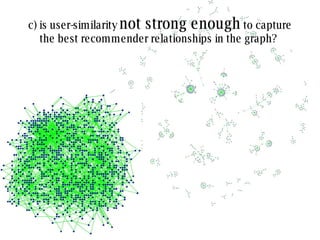
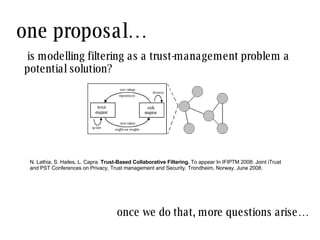
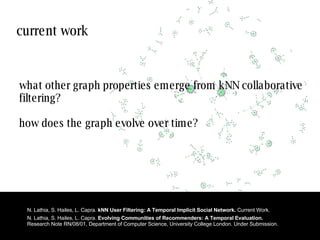
The document discusses collaborative filtering recommender systems which are built on collaboration between users. It focuses on k-nearest neighbors collaborative filtering, which can be modeled as a graph of cooperating users. The document examines different similarity measures that can be used to weight the links between users in the graph, and evaluates their impact on recommendation accuracy and coverage using a movie rating dataset. It also considers how the graph properties and communities of recommenders may evolve over time.