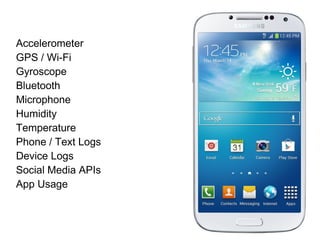
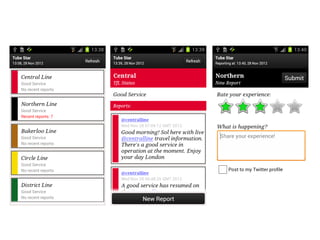
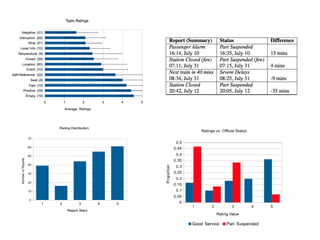
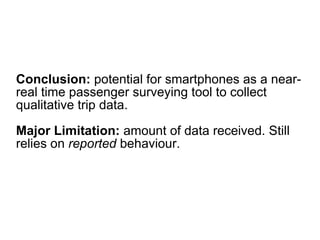
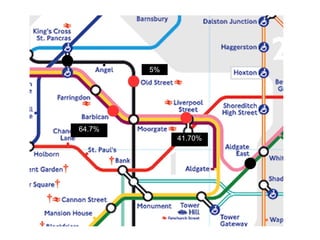
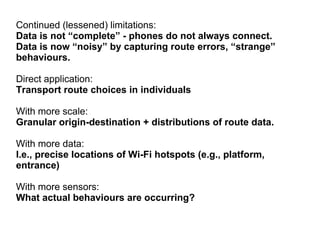
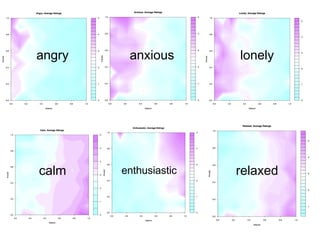
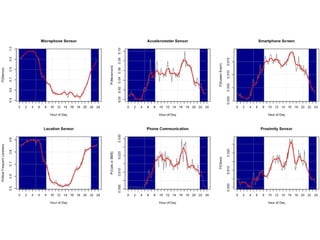
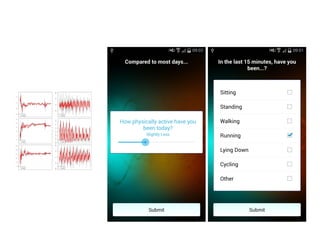
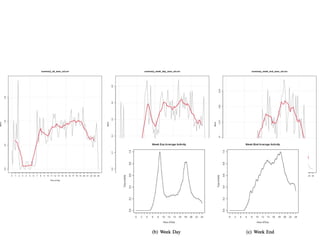
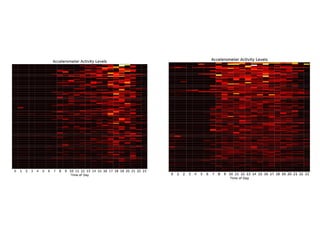
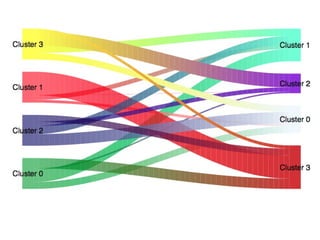
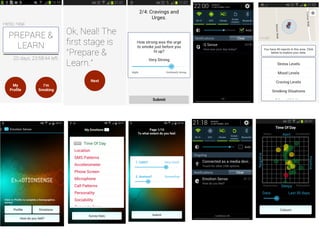
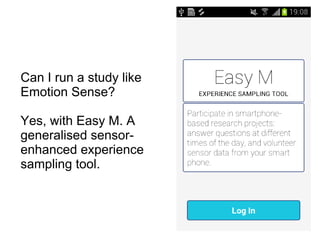
Analysing Daily Behaviours with Large-Scale
Smartphone Data
@neal_lathia
Computer Laboratory
University of Cambridge
Background
Smartphones as Research Tools
Case 1: Public Transport
Case 2: Subjective Wellbeing & Behaviour
Case 3: Behavioural Intervention
Challenges, Opportunities, Questions
Background
Smartphones as Research Tools
“by 2025, when most of today’s psychology
undergraduates will be in their mid-30s, more
than 5 billion people on our planet will be using
ultra-broadband, sensor-rich smartphones far
beyond the abilities of today’s iPhones, Androids,
and Blackberries.”
Miller
Accelerometer
GPS / Wi-Fi
Gyroscope
Bluetooth
Microphone
Humidity
Temperature
Phone / Text Logs
Device Logs
Social Media APIs
App Usage
Accelerometer | Physical Activity
GPS / Wi-Fi | Mobility
Gyroscope | Orientation
Bluetooth | Co-Location
Microphone | Ambient Audio
Humidity | Environment
Temperature | Environment
Phone / Text Logs | Socialising
Device Logs | Network
Social Media APIs | Socialising
App Usage | /Information Needs
Case 1: Public Transport
N. Lathia, L. Capra. Tube Star: Crowd-Sourced Experiences on Public
Transport. In 11th
International Conference on Mobile and Ubiquitous
Systems. London, December 2014.
Conclusion: potential for smartphones as a near-
real time passenger surveying tool to collect
qualitative trip data.
Major Limitation: amount of data received. Still
relies on reported behaviour.
Accelerometer (activity)
GPS / Wi-Fi (location)
Gyroscope (orientation)
Bluetooth (co-location)
Microphone (audio context)
Environment (temperature)
Phone / Text Logs (sociability)
Device Logs (e.g., network)
Social Media APIs (crowdsourcing)
App Usage (information seeking)
Method
1. Collect Wi-Fi scans that match
“Virgin Media Wi-Fi”
2. Manually label “unknown”
stations (“Where are you?”)
3. Apply heuristic-based clustering
algorithm to determine station
visits, paths, travel times.
Preliminary Data
34 users; 234,769 Wi-Fi scans,
106,793
Sequences of Wi-Fi Connections
Oyster Card transaction
Journey Planner:
Victoria Line to Oxford Circus
Central Line to Mile End
27 Minutes
Measured:
Victoria Line to Victoria
Circle/District to Mile End
29 minutes
21:54:02
21:56:06
21:58:13
22:12:00
22:15:41
22:23:05
Oyster card transaction
Journey Planner:
Piccadilly Line to Holborn
Central Line to West Ruislip
56 Minutes
Measured:
Piccadilly Line to King's Cross
Victoria Line to Oxford Circus
Central Line to West Ruislip
74 minutes
10:56:06
11:15:39
11:32:55
12:10:09
Capturing Routes: Given an O-D pair, count the % of times that
another station appears as an intermediary
Observing Mistakes? E.g., 2.18% of trips from Pimlico to Victoria
Station go via Green Park (wrong direction).
Non-Adjacent Pairs of Wi-Fi Connections
40%
10%
10%
5%
5%
41.70%
64.7%
Continued (lessened) limitations:
Data is not “complete” - phones do not always connect.
Data is now “noisy” by capturing route errors, “strange”
behaviours.
Direct application:
Transport route choices in individuals
With more scale:
Granular origin-destination + distributions of route data.
With more data:
I.e., precise locations of Wi-Fi hotspots (e.g., platform,
entrance)
With more sensors:
What actual behaviours are occurring?
Case 2: Subjective Wellbeing & Behaviour
N. Lathia, K. Rachuri, C. Mascolo, P. Rentfrow. Contextual Dissonance:
Design Bias in Sensor-Based Experience Sampling Methods. In ACM
International Joint Conference on Pervasive and Ubiquitous Computing.
Zurich, Switzerland. September 2013.
N. Lathia, G. Sandstrom, P. Rentfrow, C. Mascolo. Happy People Live
Active Lives. In prep.
“A sample of 222 undergraduates was screened
for high happiness using multiple confirming
assessment filters. We compared the upper 10%
of consistently very happy people with average
and very unhappy people. The very happy people
were highly social, and had stronger romantic and
other social relationships than less happy
groups...”
Diener, Seligman. Very Happy People. In Psychological Science 13 (1). Jan 2002.
angry anxious lonely
relaxedenthusiasticcalm
Hemminki, Nurmi, Tarkoma. Accelerometer-Based Transportation Mode Detection on
Smartphones. In ACM Sensys 2013.
Statistical: mean, standard deviation, median, etc.
Time: auto-correlation, mean-crossing rate, etc.
Frequency: FFT, spectral energy, etc.
Peak: volume, intensity, skewness, etc.
Segment: e.g., velocity change rate
Example: 85 Users
Case 3: Behavioural Intervention
Challenges & Questions
1. Software Engineering / Expectations
2. Marketing
3. Control over target population
4. Understanding sensor data
5. Writing code
6. Finding research value
1. Blurred lines between research and practice
2. High potential for multi-disciplinary impact
3. Cheap to roll-out to huge audiences
4. Accessible to 'everyone'
5. Wearables are coming!
Can I run a study like
Emotion Sense?
Yes, with Easy M. A
generalised sensor-
enhanced experience
sampling tool.
@neal_lathia
neal.lathia@cl.cam.ac.uk
http://www.cl.cam.ac.uk/~nkl25/

Analysing Daily Behaviours with Large-Scale Smartphone Data

  • 1.
    Analysing Daily Behaviourswith Large-Scale Smartphone Data @neal_lathia Computer Laboratory University of Cambridge
  • 2.
    Background Smartphones as ResearchTools Case 1: Public Transport Case 2: Subjective Wellbeing & Behaviour Case 3: Behavioural Intervention Challenges, Opportunities, Questions
  • 3.
  • 5.
  • 6.
    “by 2025, whenmost of today’s psychology undergraduates will be in their mid-30s, more than 5 billion people on our planet will be using ultra-broadband, sensor-rich smartphones far beyond the abilities of today’s iPhones, Androids, and Blackberries.” Miller
  • 9.
  • 10.
    Accelerometer | PhysicalActivity GPS / Wi-Fi | Mobility Gyroscope | Orientation Bluetooth | Co-Location Microphone | Ambient Audio Humidity | Environment Temperature | Environment Phone / Text Logs | Socialising Device Logs | Network Social Media APIs | Socialising App Usage | /Information Needs
  • 11.
    Case 1: PublicTransport N. Lathia, L. Capra. Tube Star: Crowd-Sourced Experiences on Public Transport. In 11th International Conference on Mobile and Ubiquitous Systems. London, December 2014.
  • 14.
    Conclusion: potential forsmartphones as a near- real time passenger surveying tool to collect qualitative trip data. Major Limitation: amount of data received. Still relies on reported behaviour.
  • 16.
    Accelerometer (activity) GPS /Wi-Fi (location) Gyroscope (orientation) Bluetooth (co-location) Microphone (audio context) Environment (temperature) Phone / Text Logs (sociability) Device Logs (e.g., network) Social Media APIs (crowdsourcing) App Usage (information seeking)
  • 17.
    Method 1. Collect Wi-Fiscans that match “Virgin Media Wi-Fi” 2. Manually label “unknown” stations (“Where are you?”) 3. Apply heuristic-based clustering algorithm to determine station visits, paths, travel times. Preliminary Data 34 users; 234,769 Wi-Fi scans, 106,793
  • 18.
    Sequences of Wi-FiConnections
  • 19.
  • 20.
    Journey Planner: Victoria Lineto Oxford Circus Central Line to Mile End 27 Minutes
  • 21.
    Measured: Victoria Line toVictoria Circle/District to Mile End 29 minutes 21:54:02 21:56:06 21:58:13 22:12:00 22:15:41 22:23:05
  • 22.
  • 23.
    Journey Planner: Piccadilly Lineto Holborn Central Line to West Ruislip 56 Minutes
  • 24.
    Measured: Piccadilly Line toKing's Cross Victoria Line to Oxford Circus Central Line to West Ruislip 74 minutes 10:56:06 11:15:39 11:32:55 12:10:09
  • 25.
    Capturing Routes: Givenan O-D pair, count the % of times that another station appears as an intermediary Observing Mistakes? E.g., 2.18% of trips from Pimlico to Victoria Station go via Green Park (wrong direction). Non-Adjacent Pairs of Wi-Fi Connections
  • 27.
  • 29.
  • 30.
    Continued (lessened) limitations: Datais not “complete” - phones do not always connect. Data is now “noisy” by capturing route errors, “strange” behaviours. Direct application: Transport route choices in individuals With more scale: Granular origin-destination + distributions of route data. With more data: I.e., precise locations of Wi-Fi hotspots (e.g., platform, entrance) With more sensors: What actual behaviours are occurring?
  • 31.
    Case 2: SubjectiveWellbeing & Behaviour N. Lathia, K. Rachuri, C. Mascolo, P. Rentfrow. Contextual Dissonance: Design Bias in Sensor-Based Experience Sampling Methods. In ACM International Joint Conference on Pervasive and Ubiquitous Computing. Zurich, Switzerland. September 2013. N. Lathia, G. Sandstrom, P. Rentfrow, C. Mascolo. Happy People Live Active Lives. In prep.
  • 32.
    “A sample of222 undergraduates was screened for high happiness using multiple confirming assessment filters. We compared the upper 10% of consistently very happy people with average and very unhappy people. The very happy people were highly social, and had stronger romantic and other social relationships than less happy groups...” Diener, Seligman. Very Happy People. In Psychological Science 13 (1). Jan 2002.
  • 37.
  • 40.
    Hemminki, Nurmi, Tarkoma.Accelerometer-Based Transportation Mode Detection on Smartphones. In ACM Sensys 2013. Statistical: mean, standard deviation, median, etc. Time: auto-correlation, mean-crossing rate, etc. Frequency: FFT, spectral energy, etc. Peak: volume, intensity, skewness, etc. Segment: e.g., velocity change rate
  • 41.
  • 47.
    Case 3: BehaviouralIntervention
  • 51.
  • 52.
    1. Software Engineering/ Expectations 2. Marketing 3. Control over target population 4. Understanding sensor data 5. Writing code 6. Finding research value
  • 53.
    1. Blurred linesbetween research and practice 2. High potential for multi-disciplinary impact 3. Cheap to roll-out to huge audiences 4. Accessible to 'everyone' 5. Wearables are coming!
  • 54.
    Can I runa study like Emotion Sense? Yes, with Easy M. A generalised sensor- enhanced experience sampling tool.
  • 55.