Download to read offline
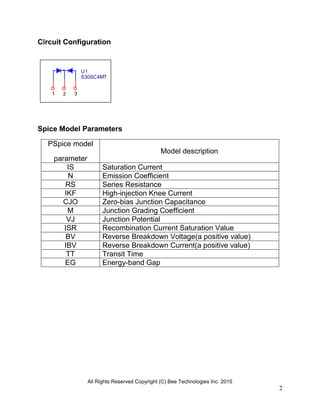
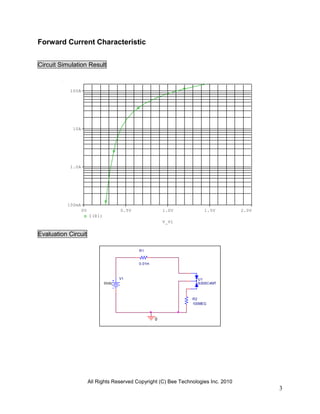
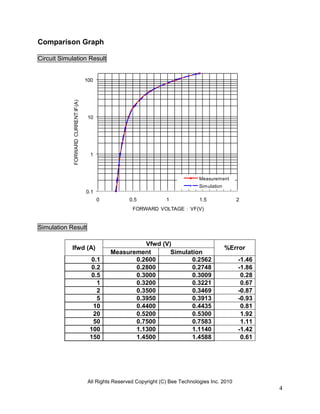
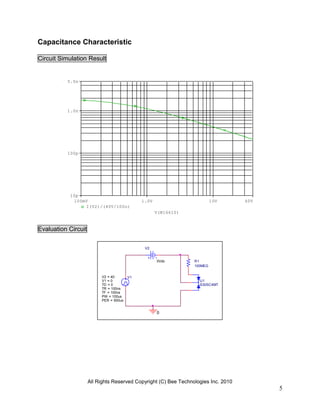
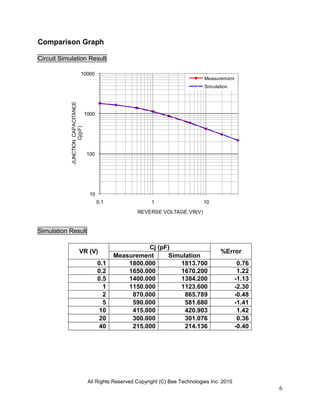
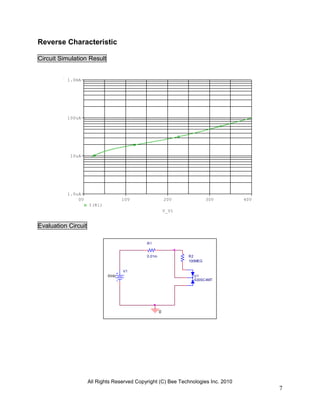
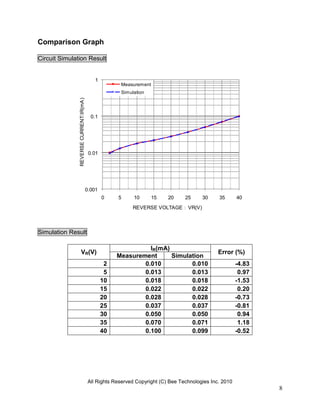

The document is a device modeling report for the S30SC4MT Schottky rectifier from Shindengen Bee Technologies Inc. It includes circuit configuration, SPICE model parameters, performance evaluations of forward current characteristics, capacitance characteristics, and reverse characteristics, along with comparison graphs of measurement vs simulation results. It provides detailed data and simulations for various electrical parameters, showcasing the device's performance metrics.


![5G Explained! A High Level Overview [Introduction]](https://cdn.slidesharecdn.com/ss_thumbnails/5gexplainedahighleveloverview-260119165306-cc137a3e-thumbnail.jpg?width=640&height=640&fit=bounds)


