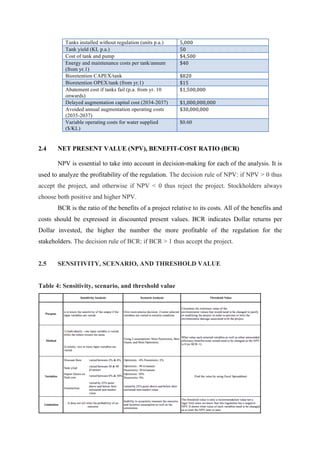
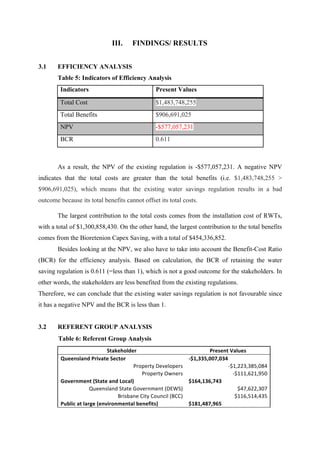
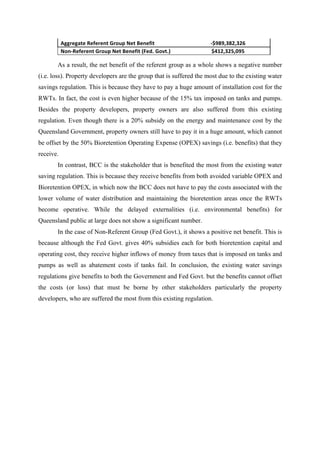
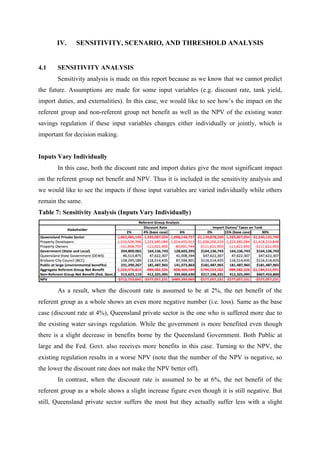
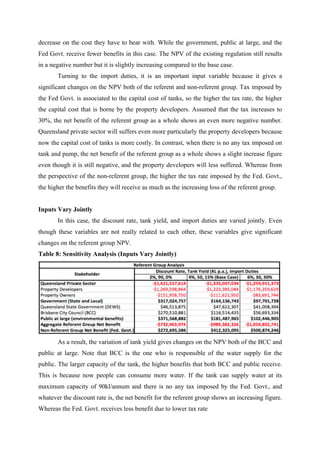
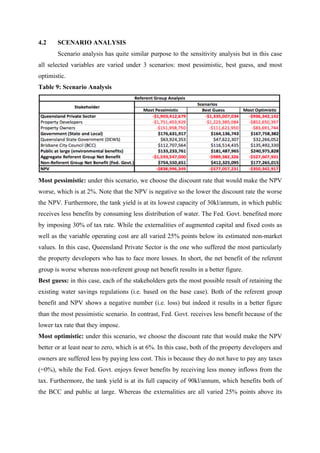
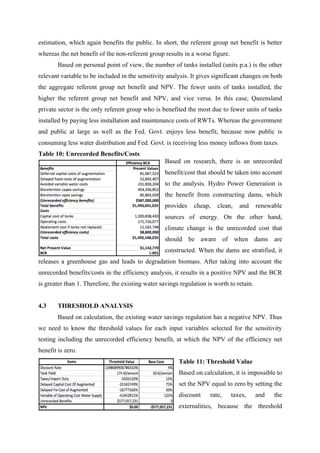
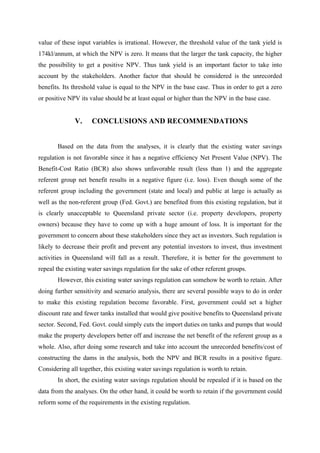
Cost-Benefit Analysis of Proposed Repeal of Water Saving Regulations
EXECUTIVE SUMMARY
The Queensland State Government proposed an existing Water Savings Regulations,
in which new buildings in most areas have to achieve certain water savings level. In order to
achieve these targets, Rainwater Tanks (RWTs) are used. However, stakeholders found that
these existing regulations somehow are costly. Thus more comprehensive benefit-cost
analysis of retaining the existing regulation is undertaken in order to know whether or not it is
worth to retain.
This report presents two more comprehensive analyses. First, the efficiency analysis
that is useful in calculating the value of the project to the economy. Second, the referent
group analysis that is showing the costs and benefits for each of the stakeholders of
maintaining the existing regulations. Based on the data from the analyses, it is clearly that the
existing water savings regulation is not favorable since it has a negative efficiency Net
Present Value (NPV). The Benefit-Cost Ratio (BCR) shows unfavorable result (less than 1)
and the aggregate referent group net benefit results in a negative figure (i.e. loss). Therefore,
it is better for the government to repeal the existing water savings regulation for the sake of
other referent groups.
In detail, this report also provides sensitivity analysis to know the sensitivity of the
output if the input variables (e.g. discount rate, import duties, tank yield, number of tanks
installed) are varied, and it results in a better NPV and referent group net benefit when these
variables are varied jointly. Scenario analysis is also undertaken, which uses three scenarios:
most pessimistic, best guess (i.e. base case) and most optimistic. Most pessimistic results in a
worse NPV and the NPV becomes better in the most optimistic. There are several possible
ways to do in order to make this existing regulation become favorable. First, government
could set a higher discount rate and fewer tanks installed that would give positive benefits to
Queensland private sector. Second, Fed. Govt. could simply cuts the import duties on tanks
and pumps that would make the property developers better off and increase the net benefit of
the referent group as a whole. Also, after taking into account the unrecorded benefits/costs of
constructing the dams in the analysis, both the NPV and BCR results in a positive figure.
Considering all together, this existing water savings regulation is worth to retain.
In short, the existing water savings regulation should be repealed if it is based on the
data from the analyses. On the other hand, it could be worth to retain if the government could
reform some of the requirements in the existing regulation.
I. INTRODUCTION
This report examines a proposal by the Queensland State Government whether or not
to retain Water Saving Regulations, in which new buildings in most areas have to achieve
certain water savings level. In order to achieve these targets, Rainwater Tanks (RWTs) are
generally used and stakeholders in the community found out that the associated costs are
considered to be excessive. Thus both government and a local consulting company undertook
a Cost-Benefit Analysis (CBA) of whether or not to retain the existing Water Saving
Regulations through the installation of RWTs in new property developments.
The Queensland government also conducts Stormwater Quality Regulations, which
requires reduction of pollutants from untreated storm water before it enters the waterways.
Bioretention system is one of the actions to meet these requirements and the objective is to
minimize the impacts of urbanization on receiving waters. However, it adds to the costs of
urban developments (e.g. capital, operating, and land costs). Bioretention can be placed on
public and private land but once completed, it is considered to have little aesthetic difference
to other areas of public open space. There are several benefits of the RWTs, which are the
reduction of stormwater run-off in urbanized area and pollutants loads before it reaches the
stormwater system as well as the reduction in required investment in bioretention
infrastructure, operating, and maintenance costs. In addition, RWTs reduce the extent of other
actions that would be required to meet the water quality standards.
This report presents two more comprehensive analyses. First, the efficiency analysis
that is useful in calculating the value of the project to the economy. Second, the referent
group analysis that is showing the costs and benefits for each of the stakeholders of
maintaining the existing regulations.
In detail, this report also provides sensitivity analysis to know the sensitivity of the
output if the input variables (e.g. discount rate, import duties, tank yield, externalities, number
of tanks installed) are varied. Scenario analysis is also undertaken, which uses three scenarios:
most pessimistic, best guess (i.e. base case) and most optimistic. Taking into account the
threshold values and unrecorded efficiency benefits/costs for sensitivity testing in order to
give the best recommendation for each of the referent and non-referent group. Finally, this
report provides conclusion and recommendation for the government whether or not of
retaining the existing water saving regulations based on the economic appraisals and public
interest point of view.
II. METHODOLOGY
2.1 COMPREHENSIVE BENEFIT-COST ANALYSIS
The Comprehensive Cost-Benefit Analysis (CBA) is designed to provide information
about the level and distribution of the regulation’s cost and benefit of each stakeholder. Two
different points of view are taken into account:
1. Efficiency Analysis: The efficiency analysis is made to know whether or not the
project is valuable for the economy. Efficiency analysis is the aggregate net benefit for
the project as a whole using opportunity cost as the efficiency price. Efficiency price
is the price that measures the additional value of the project outputs and the additional
cost of the project inputs from the economy perspective as a whole. Sum of referent
group and non-referent group net benefit must be equal to the efficiency net benefit.
2. Referent Groups Analysis: shows the costs and benefits for each of the stakeholders
in maintaining the existing regulations. The efficiency price or shadow price (e.g.
unemployed labour, pollution, foreign exchange and others in non-marketed goods
and services) is used. The reason why stockholders want to use shadow price because
they want to measure the public interest as a whole of the regulation. Referent group
analysis also considers the implications for Federal Government because they make
the budget allocation. The stakeholders are divided into two big groups: 1) Referent
Group: the stakeholders are all those located in Queensland. Including Government
(e.g. the Queensland State Government (DEWS) and Brisbane City Council (BCC)),
Queensland Private Sector (e.g. Property Developers and Property Owners) and Public
at Large. 2) Non-Referent Group: Federal Treasury, who allocates the budget for
every regulations made by the government.
2.2 ELEMENTS OF COSTS AND BENEFITS
Table 1: Costs and benefits included in the MJA CBA model
Cost and Benefit Items Description
Costs
Capital cost of tanks The cost to property developers of the RWT
including installation.
Operating Costs Energy and maintenance costs to property owners
associated with RWTs.
Abatement cost if tanks not replaced This is to cover the additional abatement costs to
BCC for the biological nutrient removal through
wastewater treatment that may be incurred to
mitigate any degradation in waterway health due


  Source: Adapted from MJA, 2012.
Table 2: Unrecorded cost and benefit
Unrecorded Cost and
Benefit Items
Description Approximate Present
Values
Hydro Power Generation The benefit from constructing dams,
which provides cheap, clean, and
renewable source of energy.
$587,000,000
Climate change The dams may contribute to the
changes of climate. It releases a
greenhouse gas when it is stratified and
leads to degradation biomass.
$8,800,000
2.3 GENERAL ASSUMPTIONS
Table 3: Main Assumptions
to stormwater that is no longer mitigated by
RWTs that are not replaced after the end of their
lives.
Benefits/ Avoided Costs
Deferred augmentation capital costs The benefit to the State Government (DEWS)
from deferring the need to augment bulk water
infrastructure due to the use of water from RWTs.
This is the benefit estimated by the Queensland
Water Commission (QWC). Similar to the QWC,
we only consider the deferral of one augmentation
within the analysis.
Avoided augmentation fixed OPEX The fixed component of operating water supply
infrastructure, borne by DEWS, that is deferred
and potentially avoided by the use of RWTs.
Avoided variable OPEX This is the avoided variable OPEX associated
with the lower required volume of water for
distribution to users by BCC once the RWTs
become operative.
Bioretention CAPEX savings The savings to property developers from reducing
the area of construction of bioretention areas for
residential developments due to the installation of
RWTs.
Bioretention OPEX savings This is the avoided cost of maintaining
bioretention areas in residential developments
over and above the cost of maintaining public
open space; assumed to be borne 50% by BCC,
and 50% by property owners.
Item Assumed Value
Period of analysis 25	
  years	
  (2012=0)	
  
Discount rate (real) 4%	
  
Tanks installed with regulation (units p.a.) 25,000	


2.4 NET PRESENT VALUE (NPV), BENEFIT-COST RATIO (BCR)
NPV is essential to take into account in decision-making for each of the analysis. It is
used to analyze the profitability of the regulation. The decision rule of NPV: if NPV > 0 thus
accept the project, and otherwise if NPV < 0 thus reject the project. Stockholders always
choose both positive and higher NPV.
BCR is the ratio of the benefits of a project relative to its costs. All of the benefits and
costs should be expressed in discounted present values. BCR indicates Dollar returns per
Dollar invested, the higher the number the more profitable of the regulation for the
stakeholders. The decision rule of BCR: if BCR > 1 thus accept the project.
2.5 SENSITIVITY, SCENARIO, AND THRESHOLD VALUE
Table 4: Sensitivity, scenario, and threshold value
Tanks installed without regulation (units p.a.) 5,000	
  
Tank yield (KL p.a.) 50	
  
Cost of tank and pump $4,500	
  
Energy and maintenance costs per tank/annum
(from yr.1)
$40	
  
Bioretention CAPEX/tank $820	
  
Bioretention OPEX/tank (from yr.1) $15	
  
Abatement cost if tanks fail (p.a. from yr. 10
onwards)
$1,500,000	
  
Delayed augmentation capital cost (2034-2037) $1,000,000,000	
  
Avoided annual augmentation operating costs
(2035-2037)
$30,000,000	
  
Variable operating costs for water supplied
($/KL)
$0.60
III. FINDINGS/ RESULTS
3.1 EFFICIENCY ANALYSIS
Table 5: Indicators of Efficiency Analysis
Indicators Present Values
Total Cost $1,483,748,255
Total Benefits $906,691,025
NPV -$577,057,231
BCR 0.611
As a result, the NPV of the existing regulation is -$577,057,231. A negative NPV
indicates that the total costs are greater than the total benefits (i.e. $1,483,748,255 >
$906,691,025), which means that the existing water savings regulation results in a bad
outcome because its total benefits cannot offset its total costs.
The largest contribution to the total costs comes from the installation cost of RWTs,
with a total of $1,300,858,430. On the other hand, the largest contribution to the total benefits
comes from the Bioretenion Capex Saving, with a total of $454,336,852.
Besides looking at the NPV, we also have to take into account the Benefit-Cost Ratio
(BCR) for the efficiency analysis. Based on calculation, the BCR of retaining the water
saving regulation is 0.611 (=less than 1), which is not a good outcome for the stakeholders. In
other words, the stakeholders are less benefited from the existing regulations.
Therefore, we can conclude that the existing water savings regulation is not favourable since
it has a negative NPV and the BCR is less than 1.
3.2 REFERENT GROUP ANALYSIS


  Table 6: Referent Group Analysis
Stakeholder	
   Present	
  Values	
  
Queensland	
  Private	
  Sector	
   -­‐$1,335,007,034	
  
Property	
  Developers	
   -­‐$1,223,385,084	
  
Property	
  Owners	
   -­‐$111,621,950	
  
Government	
  (State	
  and	
  Local)	
   $164,136,743	
  
Queensland	
  State	
  Government	
  (DEWS)	
   $47,622,307	
  
Brisbane	
  City	
  Council	
  (BCC)	
   $116,514,435	
  
Public	
  at	
  large	
  (environmental	
  benefits)	
   $181,487,965	
  
As a result, the net benefit of the referent group as a whole shows a negative number
(i.e. loss). Property developers are the group that is suffered the most due to the existing water
savings regulation. This is because they have to pay a huge amount of installation cost for the
RWTs. In fact, the cost is even higher because of the 15% tax imposed on tanks and pumps.
Besides the property developers, property owners are also suffered from this existing
regulation. Even though there is a 20% subsidy on the energy and maintenance cost by the
Queensland Government, property owners still have to pay it in a huge amount, which cannot
be offset by the 50% Bioretention Operating Expense (OPEX) savings (i.e. benefits) that they
receive.
In contrast, BCC is the stakeholder that is benefited the most from the existing water
saving regulation. This is because they receive benefits from both avoided variable OPEX and
Bioretention OPEX, in which now the BCC does not have to pay the costs associated with the
lower volume of water distribution and maintaining the bioretention areas once the RWTs
become operative. While the delayed externalities (i.e. environmental benefits) for
Queensland public at large does not show a significant number.
In the case of Non-Referent Group (Fed Govt.), it shows a positive net benefit. This is
because although the Fed Govt. gives 40% subsidies each for both bioretention capital and
operating cost, they receive higher inflows of money from taxes that is imposed on tanks and
pumps as well as abatement costs if tanks fail. In conclusion, the existing water savings
regulations give benefits to both the Government and Fed Govt. but the benefits cannot offset
the costs (or loss) that must be borne by other stakeholders particularly the property
developers, who are suffered the most from this existing regulation.
Aggregate	
  Referent	
  Group	
  Net	
  Benefit	
   -­‐$989,382,326	
  
Non-­‐Referent	
  Group	
  Net	
  Benefit	
  (Fed.	
  Govt.)	
   $412,325,095	
  
IV. SENSITIVITY, SCENARIO, AND THRESHOLD ANALYSIS
4.1 SENSITIVITY ANALYSIS
Sensitivity analysis is made on this report because as we know that we cannot predict
the future. Assumptions are made for some input variables (e.g. discount rate, tank yield,
import duties, and externalities). In this case, we would like to see how’s the impact on the
referent group and non-referent group net benefit as well as the NPV of the existing water
savings regulation if these input variables changes either individually or jointly, which is
important for decision making.
Inputs Vary Individually
In this case, both the discount rate and import duties give the most significant impact
on the referent group net benefit and NPV. Thus it is included in the sensitivity analysis and
we would like to see the impacts if those input variables are varied individually while others
remain the same.
Table 7: Sensitivity Analysis (Inputs Vary Individually)
As a result, when the discount rate is assumed to be at 2%, the net benefit of the
referent group as a whole shows an even more negative number (i.e. loss). Same as the base
case (discount rate at 4%), Queensland private sector is the one who is suffered more due to
the existing water savings regulation. While the government is more benefited even though
there is a slight decrease in benefits borne by the Queensland Government. Both Public at
large and the Fed. Govt. also receives more benefits in this case. Turning to the NPV, the
existing regulation results in a worse NPV (note that the number of the NPV is negative, so
the lower the discount rate does not make the NPV better off).
In contrast, when the discount rate is assumed to be at 6%, the net benefit of the
referent group as a whole shows a slight increase figure even though it is still negative. But
still, Queensland private sector suffers the most but they actually suffer less with a slight
decrease on the cost they have to bear with. While the government, public at large, and the
Fed Govt. receive fewer benefits in this case. The NPV of the existing regulation still results
in a negative number but it is slightly increasing compared to the base case.
Turning to the import duties, it is an important input variable because it gives a
significant changes on the NPV both of the referent and non-referent group. Tax imposed by
the Fed Govt. is associated to the capital cost of tanks, so the higher the tax rate, the higher
the capital cost that is borne by the property developers. Assumed that the tax increases to
30%, the net benefit of the referent group as a whole shows an even more negative number.
Queensland private sector will suffers even more particularly the property developers because
now the capital cost of tanks is more costly. In contrast, when there is no any tax imposed on
tank and pump, the net benefit of the referent group as a whole shows a slight increase figure
even though it is still negative, and the property developers will less suffered. Whereas from
the perspective of the non-referent group, the higher the tax rate imposed by the Fed. Govt.,
the higher the benefits they will receive as much as the increasing loss of the referent group.
Inputs Vary Jointly
In this case, the discount rate, tank yield, and import duties are varied jointly. Even
though these variables are not really related to each other, these variables give significant
changes on the referent group NPV.
Table 8: Sensitivity Analysis (Inputs Vary Jointly)
As a result, the variation of tank yield gives changes on the NPV both of the BCC and
public at large. Note that BCC is the one who is responsible of the water supply for the
public. The larger capacity of the tank, the higher benefits that both BCC and public receive.
This is because now people can consume more water. If the tank can supply water at its
maximum capacity of 90kl/annum and there is no any tax imposed by the Fed. Govt., and
whatever the discount rate is, the net benefit for the referent group shows an increasing figure.
Whereas the Fed. Govt. receives less benefit due to lower tax rate
4.2 SCENARIO ANALYSIS
Scenario analysis has quite similar purpose to the sensitivity analysis but in this case
all selected variables are varied under 3 scenarios: most pessimistic, best guess, and most
optimistic.
Table 9: Scenario Analysis
Most pessimistic: under this scenario, we choose the discount rate that would make the NPV
worse, which is at 2%. Note that the NPV is negative so the lower the discount rate the worse
the NPV. Furthermore, the tank yield is at its lowest capacity of 30kl/annum, in which public
receives less benefits by consuming less distribution of water. The Fed. Govt. benefited more
by imposing 30% of tax rate. While the externalities of augmented capital and fixed costs as
well as the variable operating cost are all varied 25% points below its estimated non-market
values. In this case, Queensland Private Sector is the one who suffered the most particularly
the property developers who has to face more losses. In short, the net benefit of the referent
group is worse whereas non-referent group net benefit results in a better figure.
Best guess: in this case, each of the stakeholders gets the most possible result of retaining the
existing water savings regulations (i.e. based on the base case). Both of the referent group
benefit and NPV shows a negative number (i.e. loss) but indeed it results in a better figure
than the most pessimistic scenario. In contrast, Fed. Govt. receives less benefit because of the
lower tax rate that they impose.
Most optimistic: under this scenario, we choose the discount rate that would make the NPV
better or at least near to zero, which is at 6%. In this case, both of the property developers and
owners are suffered less by paying less cost. This is because they do not have to pay any taxes
(=0%), while the Fed. Govt. enjoys fewer benefits by receiving less money inflows from the
tax. Furthermore, the tank yield is at its full capacity of 90kl/annum, which benefits both of
the BCC and public at large. Whereas the externalities are all varied 25% points above its
estimation, which again benefits the public. In short, the referent group net benefit is better
whereas the net benefit of the non-referent group results in a worse figure.
Based on personal point of view, the number of tanks installed (units p.a.) is the other
relevant variable to be included in the sensitivity analysis. It gives significant changes on both
the aggregate referent group net benefit and NPV. The fewer units of tanks installed, the
higher the referent group net benefit and NPV, and vice versa. In this case, Queensland
private sector is the only referent group who is benefited the most due to fewer units of tanks
installed by paying less installation and maintenance costs of RWTs. Whereas the government
and public at large as well as the Fed. Govt. enjoys less benefit, because now public is
consuming less water distribution and Fed. Govt. is receiving less money inflows from taxes.
Table 10: Unrecorded Benefits/Costs
Based on research, there is an unrecorded
benefit/cost that should be taken into account
to the analysis. Hydro Power Generation is
the benefit from constructing dams, which
provides cheap, clean, and renewable
sources of energy. On the other hand,
climate change is the unrecorded cost that
should be aware of when dams are
constructed. When the dams are stratified, it
releases a greenhouse gas and leads to degradation biomass. After taking into account the
unrecorded benefits/costs in the efficiency analysis, it results in a positive NPV and the BCR
is greater than 1. Therefore, the existing water savings regulation is worth to retain.
4.3 THRESHOLD ANALYSIS
Based on calculation, the existing water savings regulation has a negative NPV. Thus
we need to know the threshold values for each input variables selected for the sensitivity
testing including the unrecorded efficiency benefit, at which the NPV of the efficiency net
benefit is zero.
Table 11: Threshold Value
Based on calculation, it is impossible to
set the NPV equal to zero by setting the
discount rate, taxes, and the
externalities, because the threshold
value of these input variables is irrational. However, the threshold value of the tank yield is
174kl/annum, at which the NPV is zero. It means that the larger the tank capacity, the higher
the possibility to get a positive NPV. Thus tank yield is an important factor to take into
account by the stakeholders. Another factor that should be considered is the unrecorded
benefits. Its threshold value is equal to the NPV in the base case. Thus in order to get a zero
or positive NPV its value should be at least equal or higher than the NPV in the base case.
V. CONCLUSIONS AND RECOMMENDATIONS
Based on the data from the analyses, it is clearly that the existing water savings
regulation is not favorable since it has a negative efficiency Net Present Value (NPV). The
Benefit-Cost Ratio (BCR) also shows unfavorable result (less than 1) and the aggregate
referent group net benefit results in a negative figure (i.e. loss). Even though some of the
referent group including the government (state and local) and public at large is actually as
well as the non-referent group (Fed. Govt.) are benefited from this existing regulation, but it
is clearly unacceptable to Queensland private sector (i.e. property developers, property
owners) because they have to come up with a huge amount of loss. It is important for the
government to concern about these stakeholders since they act as investors. Such regulation is
likely to decrease their profit and prevent any potential investors to invest, thus investment
activities in Queensland will fall as a result. Therefore, it is better for the government to
repeal the existing water savings regulation for the sake of other referent groups.
However, this existing water savings regulation can somehow be worth to retain. After
doing further sensitivity and scenario analysis, there are several possible ways to do in order
to make this existing regulation become favorable. First, government could set a higher
discount rate and fewer tanks installed that would give positive benefits to Queensland private
sector. Second, Fed. Govt. could simply cuts the import duties on tanks and pumps that would
make the property developers better off and increase the net benefit of the referent group as a
whole. Also, after doing some research and take into account the unrecorded benefits/cost of
constructing the dams in the analysis, both the NPV and BCR results in a positive figure.
Considering all together, this existing water savings regulation is worth to retain.
In short, the existing water savings regulation should be repealed if it is based on the
data from the analyses. On the other hand, it could be worth to retain if the government could
reform some of the requirements in the existing regulation.
APPENDIX
REFERENCES
Australian Renewable Energy Agency 2014. Hydropower Projects, Canberra,
<http://arena.gov.au/projects/hydropower/>. viewed 21 October 2014

RWT_SYARIEF_43298608

  • 1.
    Cost-Benefit Analysis ofProposed Repeal of Water Saving Regulations EXECUTIVE SUMMARY The Queensland State Government proposed an existing Water Savings Regulations, in which new buildings in most areas have to achieve certain water savings level. In order to achieve these targets, Rainwater Tanks (RWTs) are used. However, stakeholders found that these existing regulations somehow are costly. Thus more comprehensive benefit-cost analysis of retaining the existing regulation is undertaken in order to know whether or not it is worth to retain. This report presents two more comprehensive analyses. First, the efficiency analysis that is useful in calculating the value of the project to the economy. Second, the referent group analysis that is showing the costs and benefits for each of the stakeholders of maintaining the existing regulations. Based on the data from the analyses, it is clearly that the existing water savings regulation is not favorable since it has a negative efficiency Net Present Value (NPV). The Benefit-Cost Ratio (BCR) shows unfavorable result (less than 1) and the aggregate referent group net benefit results in a negative figure (i.e. loss). Therefore, it is better for the government to repeal the existing water savings regulation for the sake of other referent groups. In detail, this report also provides sensitivity analysis to know the sensitivity of the output if the input variables (e.g. discount rate, import duties, tank yield, number of tanks installed) are varied, and it results in a better NPV and referent group net benefit when these variables are varied jointly. Scenario analysis is also undertaken, which uses three scenarios: most pessimistic, best guess (i.e. base case) and most optimistic. Most pessimistic results in a worse NPV and the NPV becomes better in the most optimistic. There are several possible ways to do in order to make this existing regulation become favorable. First, government could set a higher discount rate and fewer tanks installed that would give positive benefits to Queensland private sector. Second, Fed. Govt. could simply cuts the import duties on tanks and pumps that would make the property developers better off and increase the net benefit of the referent group as a whole. Also, after taking into account the unrecorded benefits/costs of constructing the dams in the analysis, both the NPV and BCR results in a positive figure. Considering all together, this existing water savings regulation is worth to retain. In short, the existing water savings regulation should be repealed if it is based on the data from the analyses. On the other hand, it could be worth to retain if the government could reform some of the requirements in the existing regulation.
  • 2.
    I. INTRODUCTION This reportexamines a proposal by the Queensland State Government whether or not to retain Water Saving Regulations, in which new buildings in most areas have to achieve certain water savings level. In order to achieve these targets, Rainwater Tanks (RWTs) are generally used and stakeholders in the community found out that the associated costs are considered to be excessive. Thus both government and a local consulting company undertook a Cost-Benefit Analysis (CBA) of whether or not to retain the existing Water Saving Regulations through the installation of RWTs in new property developments. The Queensland government also conducts Stormwater Quality Regulations, which requires reduction of pollutants from untreated storm water before it enters the waterways. Bioretention system is one of the actions to meet these requirements and the objective is to minimize the impacts of urbanization on receiving waters. However, it adds to the costs of urban developments (e.g. capital, operating, and land costs). Bioretention can be placed on public and private land but once completed, it is considered to have little aesthetic difference to other areas of public open space. There are several benefits of the RWTs, which are the reduction of stormwater run-off in urbanized area and pollutants loads before it reaches the stormwater system as well as the reduction in required investment in bioretention infrastructure, operating, and maintenance costs. In addition, RWTs reduce the extent of other actions that would be required to meet the water quality standards. This report presents two more comprehensive analyses. First, the efficiency analysis that is useful in calculating the value of the project to the economy. Second, the referent group analysis that is showing the costs and benefits for each of the stakeholders of maintaining the existing regulations. In detail, this report also provides sensitivity analysis to know the sensitivity of the output if the input variables (e.g. discount rate, import duties, tank yield, externalities, number of tanks installed) are varied. Scenario analysis is also undertaken, which uses three scenarios: most pessimistic, best guess (i.e. base case) and most optimistic. Taking into account the threshold values and unrecorded efficiency benefits/costs for sensitivity testing in order to give the best recommendation for each of the referent and non-referent group. Finally, this report provides conclusion and recommendation for the government whether or not of retaining the existing water saving regulations based on the economic appraisals and public interest point of view.
  • 3.
    II. METHODOLOGY 2.1 COMPREHENSIVEBENEFIT-COST ANALYSIS The Comprehensive Cost-Benefit Analysis (CBA) is designed to provide information about the level and distribution of the regulation’s cost and benefit of each stakeholder. Two different points of view are taken into account: 1. Efficiency Analysis: The efficiency analysis is made to know whether or not the project is valuable for the economy. Efficiency analysis is the aggregate net benefit for the project as a whole using opportunity cost as the efficiency price. Efficiency price is the price that measures the additional value of the project outputs and the additional cost of the project inputs from the economy perspective as a whole. Sum of referent group and non-referent group net benefit must be equal to the efficiency net benefit. 2. Referent Groups Analysis: shows the costs and benefits for each of the stakeholders in maintaining the existing regulations. The efficiency price or shadow price (e.g. unemployed labour, pollution, foreign exchange and others in non-marketed goods and services) is used. The reason why stockholders want to use shadow price because they want to measure the public interest as a whole of the regulation. Referent group analysis also considers the implications for Federal Government because they make the budget allocation. The stakeholders are divided into two big groups: 1) Referent Group: the stakeholders are all those located in Queensland. Including Government (e.g. the Queensland State Government (DEWS) and Brisbane City Council (BCC)), Queensland Private Sector (e.g. Property Developers and Property Owners) and Public at Large. 2) Non-Referent Group: Federal Treasury, who allocates the budget for every regulations made by the government. 2.2 ELEMENTS OF COSTS AND BENEFITS Table 1: Costs and benefits included in the MJA CBA model Cost and Benefit Items Description Costs Capital cost of tanks The cost to property developers of the RWT including installation. Operating Costs Energy and maintenance costs to property owners associated with RWTs. Abatement cost if tanks not replaced This is to cover the additional abatement costs to BCC for the biological nutrient removal through wastewater treatment that may be incurred to mitigate any degradation in waterway health due
  • 4.
                                                                                                       Source: Adapted from MJA, 2012. Table 2: Unrecorded cost and benefit Unrecorded Cost and Benefit Items Description Approximate Present Values Hydro Power Generation The benefit from constructing dams, which provides cheap, clean, and renewable source of energy. $587,000,000 Climate change The dams may contribute to the changes of climate. It releases a greenhouse gas when it is stratified and leads to degradation biomass. $8,800,000 2.3 GENERAL ASSUMPTIONS Table 3: Main Assumptions to stormwater that is no longer mitigated by RWTs that are not replaced after the end of their lives. Benefits/ Avoided Costs Deferred augmentation capital costs The benefit to the State Government (DEWS) from deferring the need to augment bulk water infrastructure due to the use of water from RWTs. This is the benefit estimated by the Queensland Water Commission (QWC). Similar to the QWC, we only consider the deferral of one augmentation within the analysis. Avoided augmentation fixed OPEX The fixed component of operating water supply infrastructure, borne by DEWS, that is deferred and potentially avoided by the use of RWTs. Avoided variable OPEX This is the avoided variable OPEX associated with the lower required volume of water for distribution to users by BCC once the RWTs become operative. Bioretention CAPEX savings The savings to property developers from reducing the area of construction of bioretention areas for residential developments due to the installation of RWTs. Bioretention OPEX savings This is the avoided cost of maintaining bioretention areas in residential developments over and above the cost of maintaining public open space; assumed to be borne 50% by BCC, and 50% by property owners. Item Assumed Value Period of analysis 25  years  (2012=0)   Discount rate (real) 4%   Tanks installed with regulation (units p.a.) 25,000  
  • 5.
          2.4NET PRESENT VALUE (NPV), BENEFIT-COST RATIO (BCR) NPV is essential to take into account in decision-making for each of the analysis. It is used to analyze the profitability of the regulation. The decision rule of NPV: if NPV > 0 thus accept the project, and otherwise if NPV < 0 thus reject the project. Stockholders always choose both positive and higher NPV. BCR is the ratio of the benefits of a project relative to its costs. All of the benefits and costs should be expressed in discounted present values. BCR indicates Dollar returns per Dollar invested, the higher the number the more profitable of the regulation for the stakeholders. The decision rule of BCR: if BCR > 1 thus accept the project. 2.5 SENSITIVITY, SCENARIO, AND THRESHOLD VALUE Table 4: Sensitivity, scenario, and threshold value Tanks installed without regulation (units p.a.) 5,000   Tank yield (KL p.a.) 50   Cost of tank and pump $4,500   Energy and maintenance costs per tank/annum (from yr.1) $40   Bioretention CAPEX/tank $820   Bioretention OPEX/tank (from yr.1) $15   Abatement cost if tanks fail (p.a. from yr. 10 onwards) $1,500,000   Delayed augmentation capital cost (2034-2037) $1,000,000,000   Avoided annual augmentation operating costs (2035-2037) $30,000,000   Variable operating costs for water supplied ($/KL) $0.60
  • 6.
    III. FINDINGS/ RESULTS 3.1EFFICIENCY ANALYSIS Table 5: Indicators of Efficiency Analysis Indicators Present Values Total Cost $1,483,748,255 Total Benefits $906,691,025 NPV -$577,057,231 BCR 0.611 As a result, the NPV of the existing regulation is -$577,057,231. A negative NPV indicates that the total costs are greater than the total benefits (i.e. $1,483,748,255 > $906,691,025), which means that the existing water savings regulation results in a bad outcome because its total benefits cannot offset its total costs. The largest contribution to the total costs comes from the installation cost of RWTs, with a total of $1,300,858,430. On the other hand, the largest contribution to the total benefits comes from the Bioretenion Capex Saving, with a total of $454,336,852. Besides looking at the NPV, we also have to take into account the Benefit-Cost Ratio (BCR) for the efficiency analysis. Based on calculation, the BCR of retaining the water saving regulation is 0.611 (=less than 1), which is not a good outcome for the stakeholders. In other words, the stakeholders are less benefited from the existing regulations. Therefore, we can conclude that the existing water savings regulation is not favourable since it has a negative NPV and the BCR is less than 1. 3.2 REFERENT GROUP ANALYSIS                            Table 6: Referent Group Analysis Stakeholder   Present  Values   Queensland  Private  Sector   -­‐$1,335,007,034   Property  Developers   -­‐$1,223,385,084   Property  Owners   -­‐$111,621,950   Government  (State  and  Local)   $164,136,743   Queensland  State  Government  (DEWS)   $47,622,307   Brisbane  City  Council  (BCC)   $116,514,435   Public  at  large  (environmental  benefits)   $181,487,965  
  • 7.
    As a result,the net benefit of the referent group as a whole shows a negative number (i.e. loss). Property developers are the group that is suffered the most due to the existing water savings regulation. This is because they have to pay a huge amount of installation cost for the RWTs. In fact, the cost is even higher because of the 15% tax imposed on tanks and pumps. Besides the property developers, property owners are also suffered from this existing regulation. Even though there is a 20% subsidy on the energy and maintenance cost by the Queensland Government, property owners still have to pay it in a huge amount, which cannot be offset by the 50% Bioretention Operating Expense (OPEX) savings (i.e. benefits) that they receive. In contrast, BCC is the stakeholder that is benefited the most from the existing water saving regulation. This is because they receive benefits from both avoided variable OPEX and Bioretention OPEX, in which now the BCC does not have to pay the costs associated with the lower volume of water distribution and maintaining the bioretention areas once the RWTs become operative. While the delayed externalities (i.e. environmental benefits) for Queensland public at large does not show a significant number. In the case of Non-Referent Group (Fed Govt.), it shows a positive net benefit. This is because although the Fed Govt. gives 40% subsidies each for both bioretention capital and operating cost, they receive higher inflows of money from taxes that is imposed on tanks and pumps as well as abatement costs if tanks fail. In conclusion, the existing water savings regulations give benefits to both the Government and Fed Govt. but the benefits cannot offset the costs (or loss) that must be borne by other stakeholders particularly the property developers, who are suffered the most from this existing regulation. Aggregate  Referent  Group  Net  Benefit   -­‐$989,382,326   Non-­‐Referent  Group  Net  Benefit  (Fed.  Govt.)   $412,325,095  
  • 8.
    IV. SENSITIVITY, SCENARIO,AND THRESHOLD ANALYSIS 4.1 SENSITIVITY ANALYSIS Sensitivity analysis is made on this report because as we know that we cannot predict the future. Assumptions are made for some input variables (e.g. discount rate, tank yield, import duties, and externalities). In this case, we would like to see how’s the impact on the referent group and non-referent group net benefit as well as the NPV of the existing water savings regulation if these input variables changes either individually or jointly, which is important for decision making. Inputs Vary Individually In this case, both the discount rate and import duties give the most significant impact on the referent group net benefit and NPV. Thus it is included in the sensitivity analysis and we would like to see the impacts if those input variables are varied individually while others remain the same. Table 7: Sensitivity Analysis (Inputs Vary Individually) As a result, when the discount rate is assumed to be at 2%, the net benefit of the referent group as a whole shows an even more negative number (i.e. loss). Same as the base case (discount rate at 4%), Queensland private sector is the one who is suffered more due to the existing water savings regulation. While the government is more benefited even though there is a slight decrease in benefits borne by the Queensland Government. Both Public at large and the Fed. Govt. also receives more benefits in this case. Turning to the NPV, the existing regulation results in a worse NPV (note that the number of the NPV is negative, so the lower the discount rate does not make the NPV better off). In contrast, when the discount rate is assumed to be at 6%, the net benefit of the referent group as a whole shows a slight increase figure even though it is still negative. But still, Queensland private sector suffers the most but they actually suffer less with a slight
  • 9.
    decrease on thecost they have to bear with. While the government, public at large, and the Fed Govt. receive fewer benefits in this case. The NPV of the existing regulation still results in a negative number but it is slightly increasing compared to the base case. Turning to the import duties, it is an important input variable because it gives a significant changes on the NPV both of the referent and non-referent group. Tax imposed by the Fed Govt. is associated to the capital cost of tanks, so the higher the tax rate, the higher the capital cost that is borne by the property developers. Assumed that the tax increases to 30%, the net benefit of the referent group as a whole shows an even more negative number. Queensland private sector will suffers even more particularly the property developers because now the capital cost of tanks is more costly. In contrast, when there is no any tax imposed on tank and pump, the net benefit of the referent group as a whole shows a slight increase figure even though it is still negative, and the property developers will less suffered. Whereas from the perspective of the non-referent group, the higher the tax rate imposed by the Fed. Govt., the higher the benefits they will receive as much as the increasing loss of the referent group. Inputs Vary Jointly In this case, the discount rate, tank yield, and import duties are varied jointly. Even though these variables are not really related to each other, these variables give significant changes on the referent group NPV. Table 8: Sensitivity Analysis (Inputs Vary Jointly) As a result, the variation of tank yield gives changes on the NPV both of the BCC and public at large. Note that BCC is the one who is responsible of the water supply for the public. The larger capacity of the tank, the higher benefits that both BCC and public receive. This is because now people can consume more water. If the tank can supply water at its maximum capacity of 90kl/annum and there is no any tax imposed by the Fed. Govt., and whatever the discount rate is, the net benefit for the referent group shows an increasing figure. Whereas the Fed. Govt. receives less benefit due to lower tax rate
  • 10.
    4.2 SCENARIO ANALYSIS Scenarioanalysis has quite similar purpose to the sensitivity analysis but in this case all selected variables are varied under 3 scenarios: most pessimistic, best guess, and most optimistic. Table 9: Scenario Analysis Most pessimistic: under this scenario, we choose the discount rate that would make the NPV worse, which is at 2%. Note that the NPV is negative so the lower the discount rate the worse the NPV. Furthermore, the tank yield is at its lowest capacity of 30kl/annum, in which public receives less benefits by consuming less distribution of water. The Fed. Govt. benefited more by imposing 30% of tax rate. While the externalities of augmented capital and fixed costs as well as the variable operating cost are all varied 25% points below its estimated non-market values. In this case, Queensland Private Sector is the one who suffered the most particularly the property developers who has to face more losses. In short, the net benefit of the referent group is worse whereas non-referent group net benefit results in a better figure. Best guess: in this case, each of the stakeholders gets the most possible result of retaining the existing water savings regulations (i.e. based on the base case). Both of the referent group benefit and NPV shows a negative number (i.e. loss) but indeed it results in a better figure than the most pessimistic scenario. In contrast, Fed. Govt. receives less benefit because of the lower tax rate that they impose. Most optimistic: under this scenario, we choose the discount rate that would make the NPV better or at least near to zero, which is at 6%. In this case, both of the property developers and owners are suffered less by paying less cost. This is because they do not have to pay any taxes (=0%), while the Fed. Govt. enjoys fewer benefits by receiving less money inflows from the tax. Furthermore, the tank yield is at its full capacity of 90kl/annum, which benefits both of the BCC and public at large. Whereas the externalities are all varied 25% points above its
  • 11.
    estimation, which againbenefits the public. In short, the referent group net benefit is better whereas the net benefit of the non-referent group results in a worse figure. Based on personal point of view, the number of tanks installed (units p.a.) is the other relevant variable to be included in the sensitivity analysis. It gives significant changes on both the aggregate referent group net benefit and NPV. The fewer units of tanks installed, the higher the referent group net benefit and NPV, and vice versa. In this case, Queensland private sector is the only referent group who is benefited the most due to fewer units of tanks installed by paying less installation and maintenance costs of RWTs. Whereas the government and public at large as well as the Fed. Govt. enjoys less benefit, because now public is consuming less water distribution and Fed. Govt. is receiving less money inflows from taxes. Table 10: Unrecorded Benefits/Costs Based on research, there is an unrecorded benefit/cost that should be taken into account to the analysis. Hydro Power Generation is the benefit from constructing dams, which provides cheap, clean, and renewable sources of energy. On the other hand, climate change is the unrecorded cost that should be aware of when dams are constructed. When the dams are stratified, it releases a greenhouse gas and leads to degradation biomass. After taking into account the unrecorded benefits/costs in the efficiency analysis, it results in a positive NPV and the BCR is greater than 1. Therefore, the existing water savings regulation is worth to retain. 4.3 THRESHOLD ANALYSIS Based on calculation, the existing water savings regulation has a negative NPV. Thus we need to know the threshold values for each input variables selected for the sensitivity testing including the unrecorded efficiency benefit, at which the NPV of the efficiency net benefit is zero. Table 11: Threshold Value Based on calculation, it is impossible to set the NPV equal to zero by setting the discount rate, taxes, and the externalities, because the threshold
  • 12.
    value of theseinput variables is irrational. However, the threshold value of the tank yield is 174kl/annum, at which the NPV is zero. It means that the larger the tank capacity, the higher the possibility to get a positive NPV. Thus tank yield is an important factor to take into account by the stakeholders. Another factor that should be considered is the unrecorded benefits. Its threshold value is equal to the NPV in the base case. Thus in order to get a zero or positive NPV its value should be at least equal or higher than the NPV in the base case. V. CONCLUSIONS AND RECOMMENDATIONS Based on the data from the analyses, it is clearly that the existing water savings regulation is not favorable since it has a negative efficiency Net Present Value (NPV). The Benefit-Cost Ratio (BCR) also shows unfavorable result (less than 1) and the aggregate referent group net benefit results in a negative figure (i.e. loss). Even though some of the referent group including the government (state and local) and public at large is actually as well as the non-referent group (Fed. Govt.) are benefited from this existing regulation, but it is clearly unacceptable to Queensland private sector (i.e. property developers, property owners) because they have to come up with a huge amount of loss. It is important for the government to concern about these stakeholders since they act as investors. Such regulation is likely to decrease their profit and prevent any potential investors to invest, thus investment activities in Queensland will fall as a result. Therefore, it is better for the government to repeal the existing water savings regulation for the sake of other referent groups. However, this existing water savings regulation can somehow be worth to retain. After doing further sensitivity and scenario analysis, there are several possible ways to do in order to make this existing regulation become favorable. First, government could set a higher discount rate and fewer tanks installed that would give positive benefits to Queensland private sector. Second, Fed. Govt. could simply cuts the import duties on tanks and pumps that would make the property developers better off and increase the net benefit of the referent group as a whole. Also, after doing some research and take into account the unrecorded benefits/cost of constructing the dams in the analysis, both the NPV and BCR results in a positive figure. Considering all together, this existing water savings regulation is worth to retain. In short, the existing water savings regulation should be repealed if it is based on the data from the analyses. On the other hand, it could be worth to retain if the government could reform some of the requirements in the existing regulation.
  • 13.
    APPENDIX REFERENCES Australian Renewable EnergyAgency 2014. Hydropower Projects, Canberra, <http://arena.gov.au/projects/hydropower/>. viewed 21 October 2014