Download to read offline

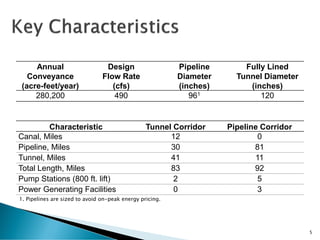
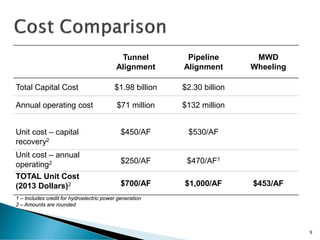


This document summarizes a study evaluating two alternatives to transport water supplies from the Colorado River to the San Diego region: a tunnel alignment and a pipeline corridor alignment. The tunnel alignment is estimated to cost $1.98 billion with annual operating costs of $71 million, while the pipeline corridor alignment is estimated at $2.30 billion with $132 million in annual operating costs. Both alternatives would transport the full 280,200 acre-feet per year of supplies secured in the 2003 Quantification Settlement Agreement. The study recommends including one of the alternatives in the regional water authority's master plan to diversify water sources and conveyance options.

![Wp [final]master plan may 16 workshop summary](https://cdn.slidesharecdn.com/ss_thumbnails/wp-finalmasterplanmay16workshopsummary-130715163001-phpapp02-thumbnail.jpg?width=640&height=640&fit=bounds)
![Wp special master-plan[071113]](https://cdn.slidesharecdn.com/ss_thumbnails/wpspecial-masterplan071113-130712181949-phpapp02-thumbnail.jpg?width=640&height=640&fit=bounds)


