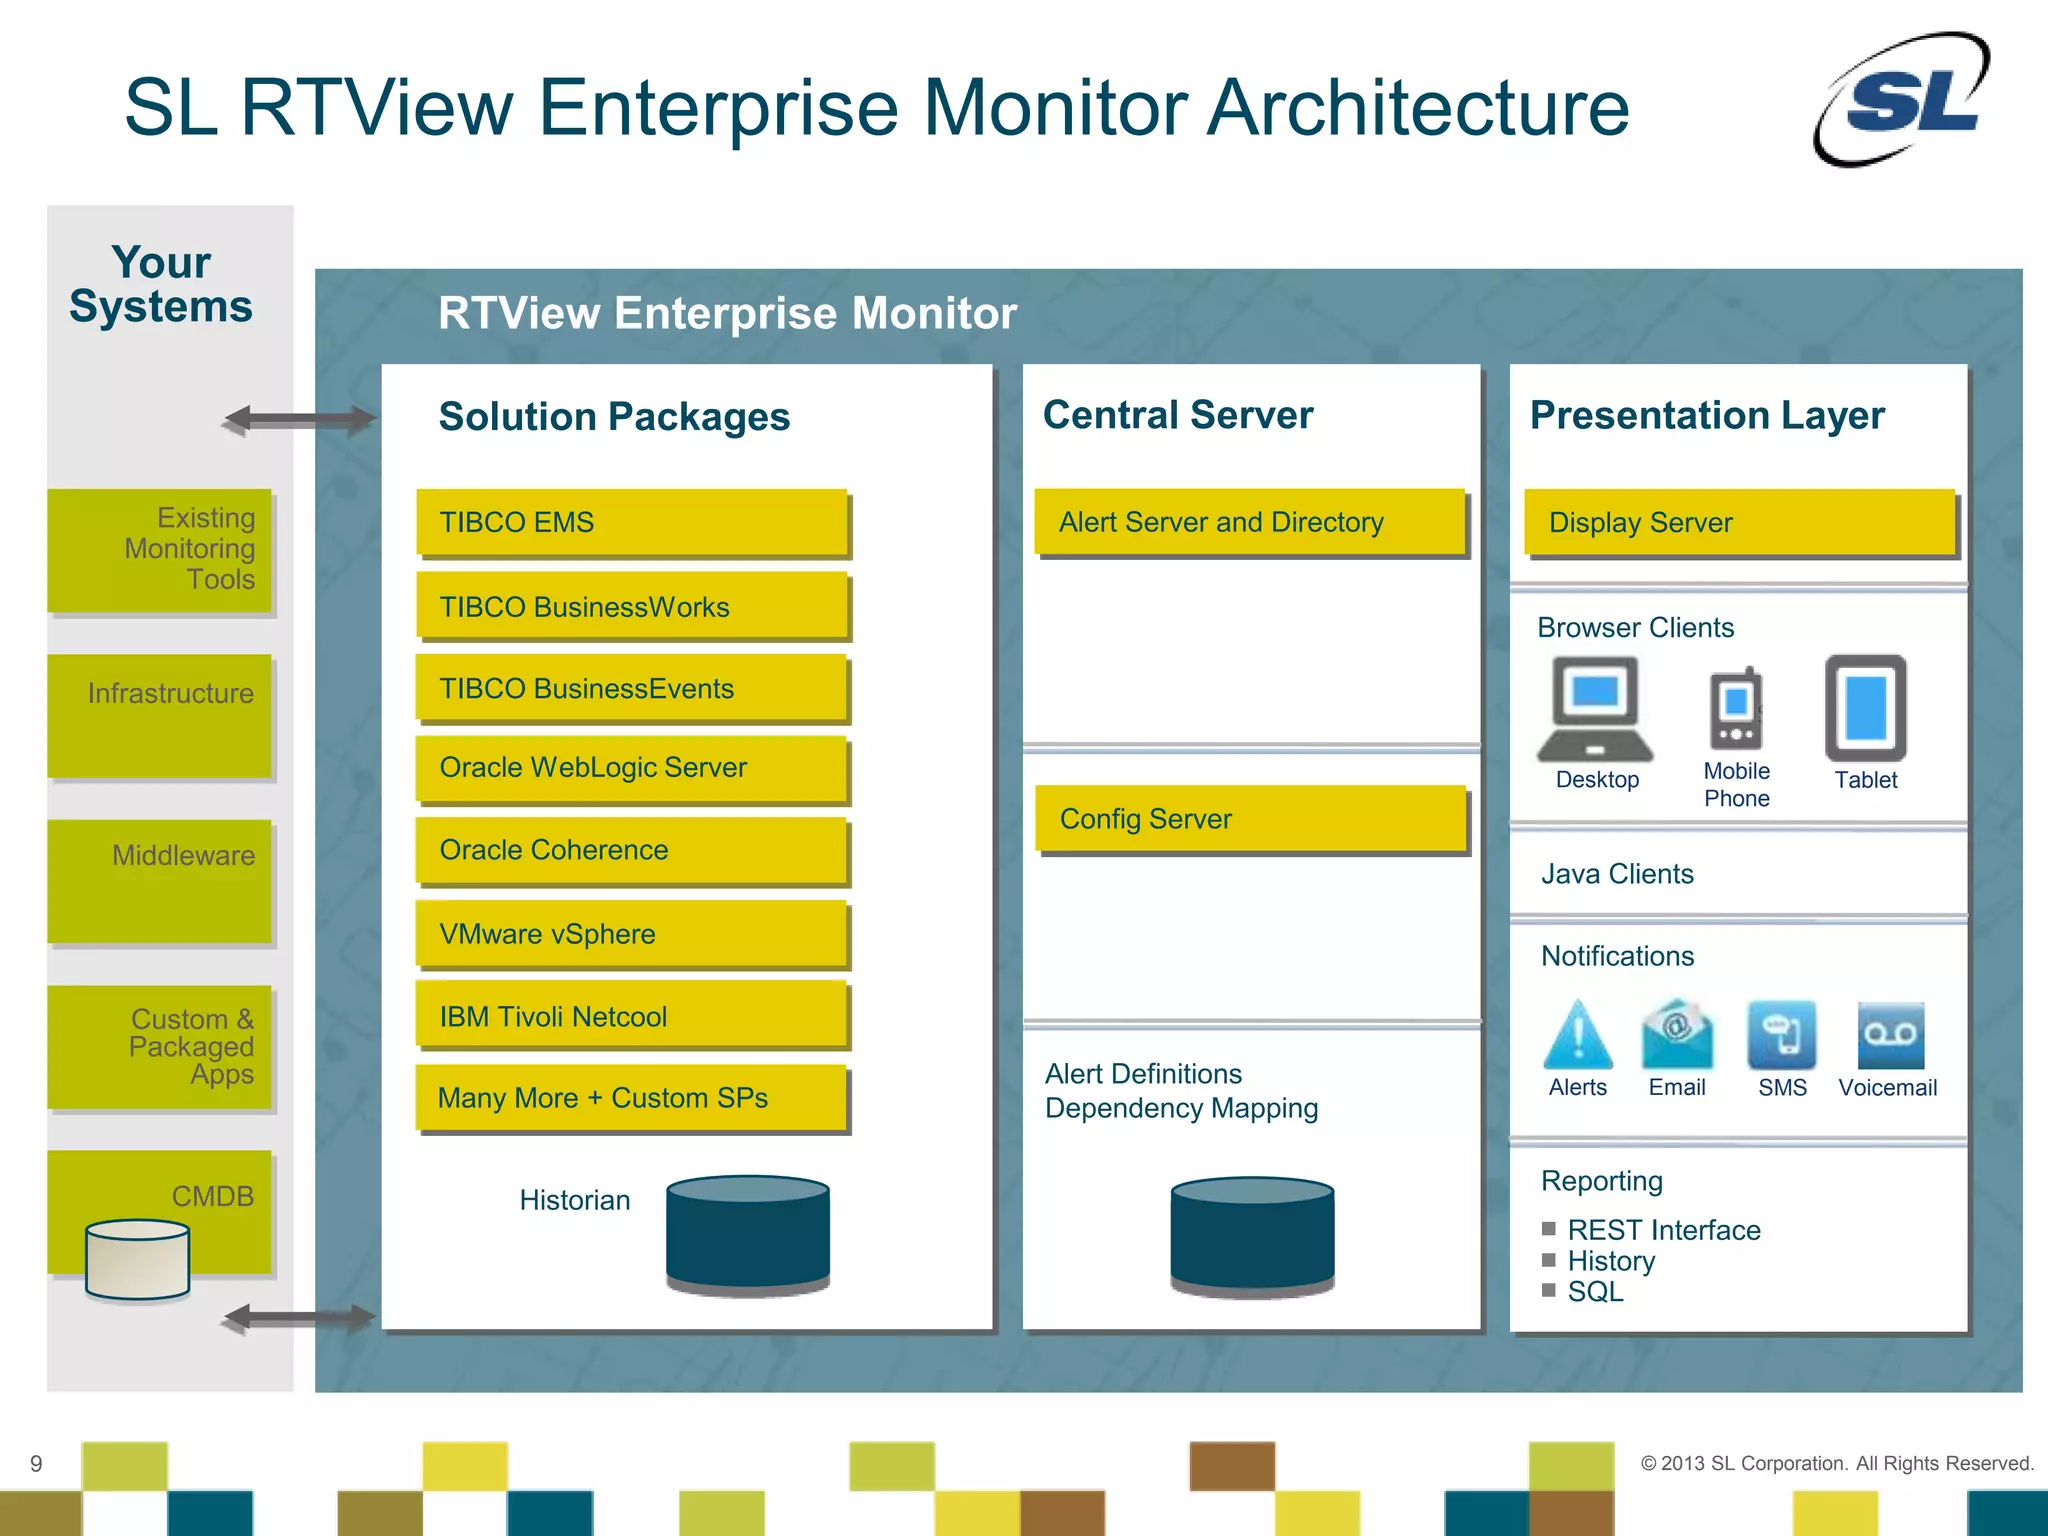
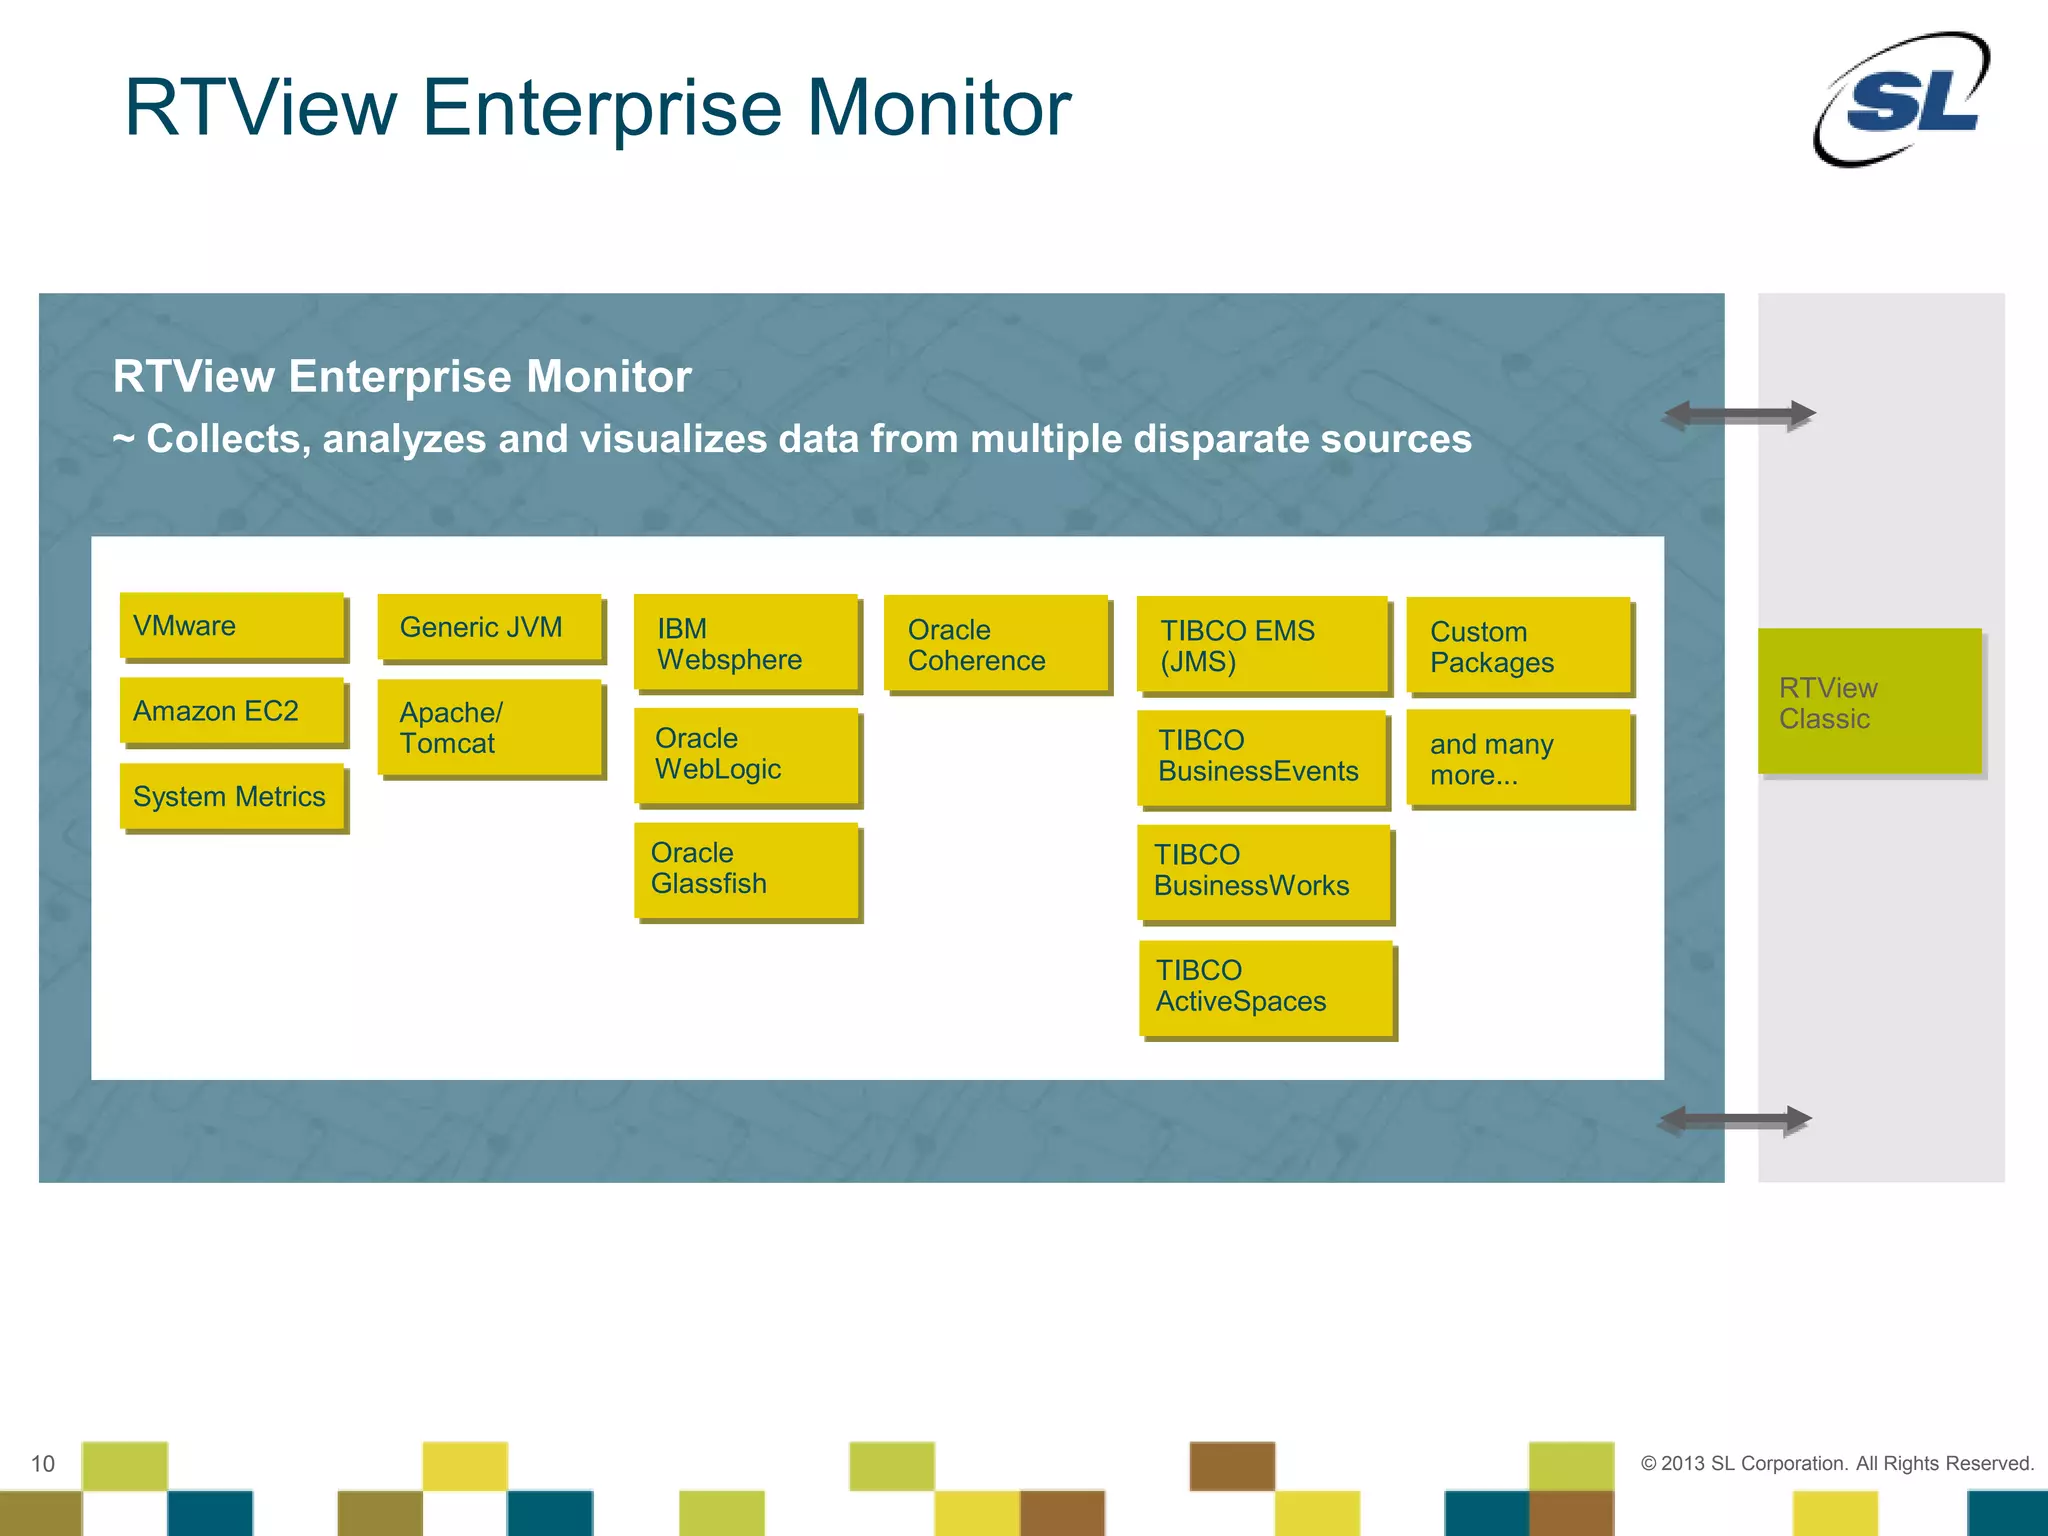
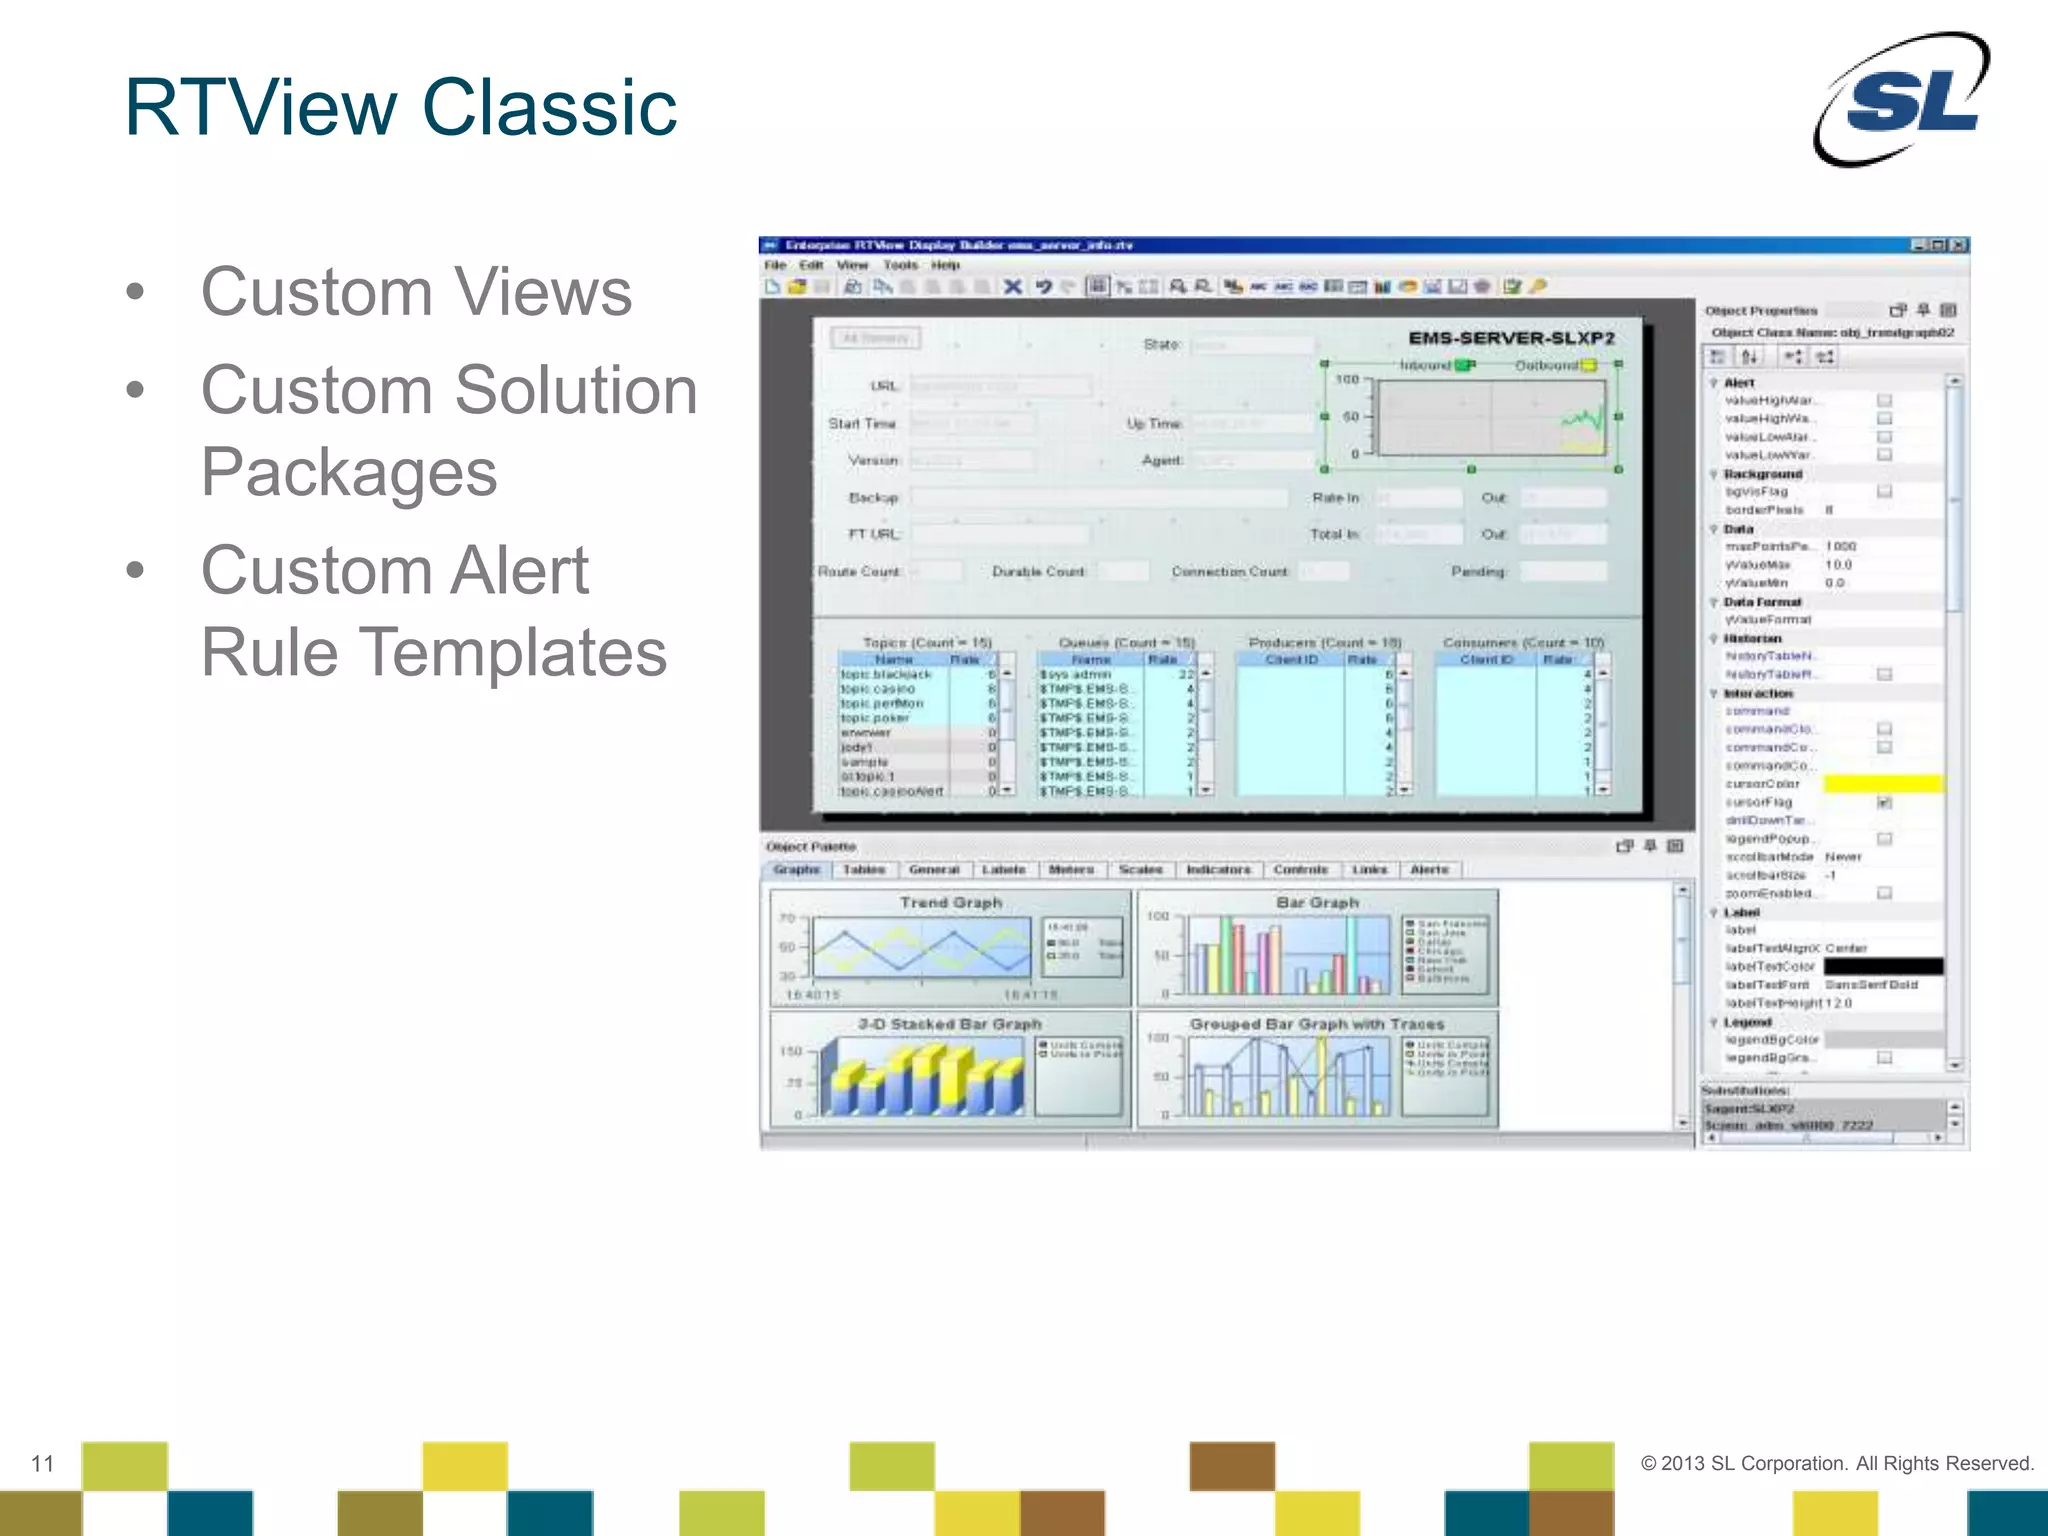
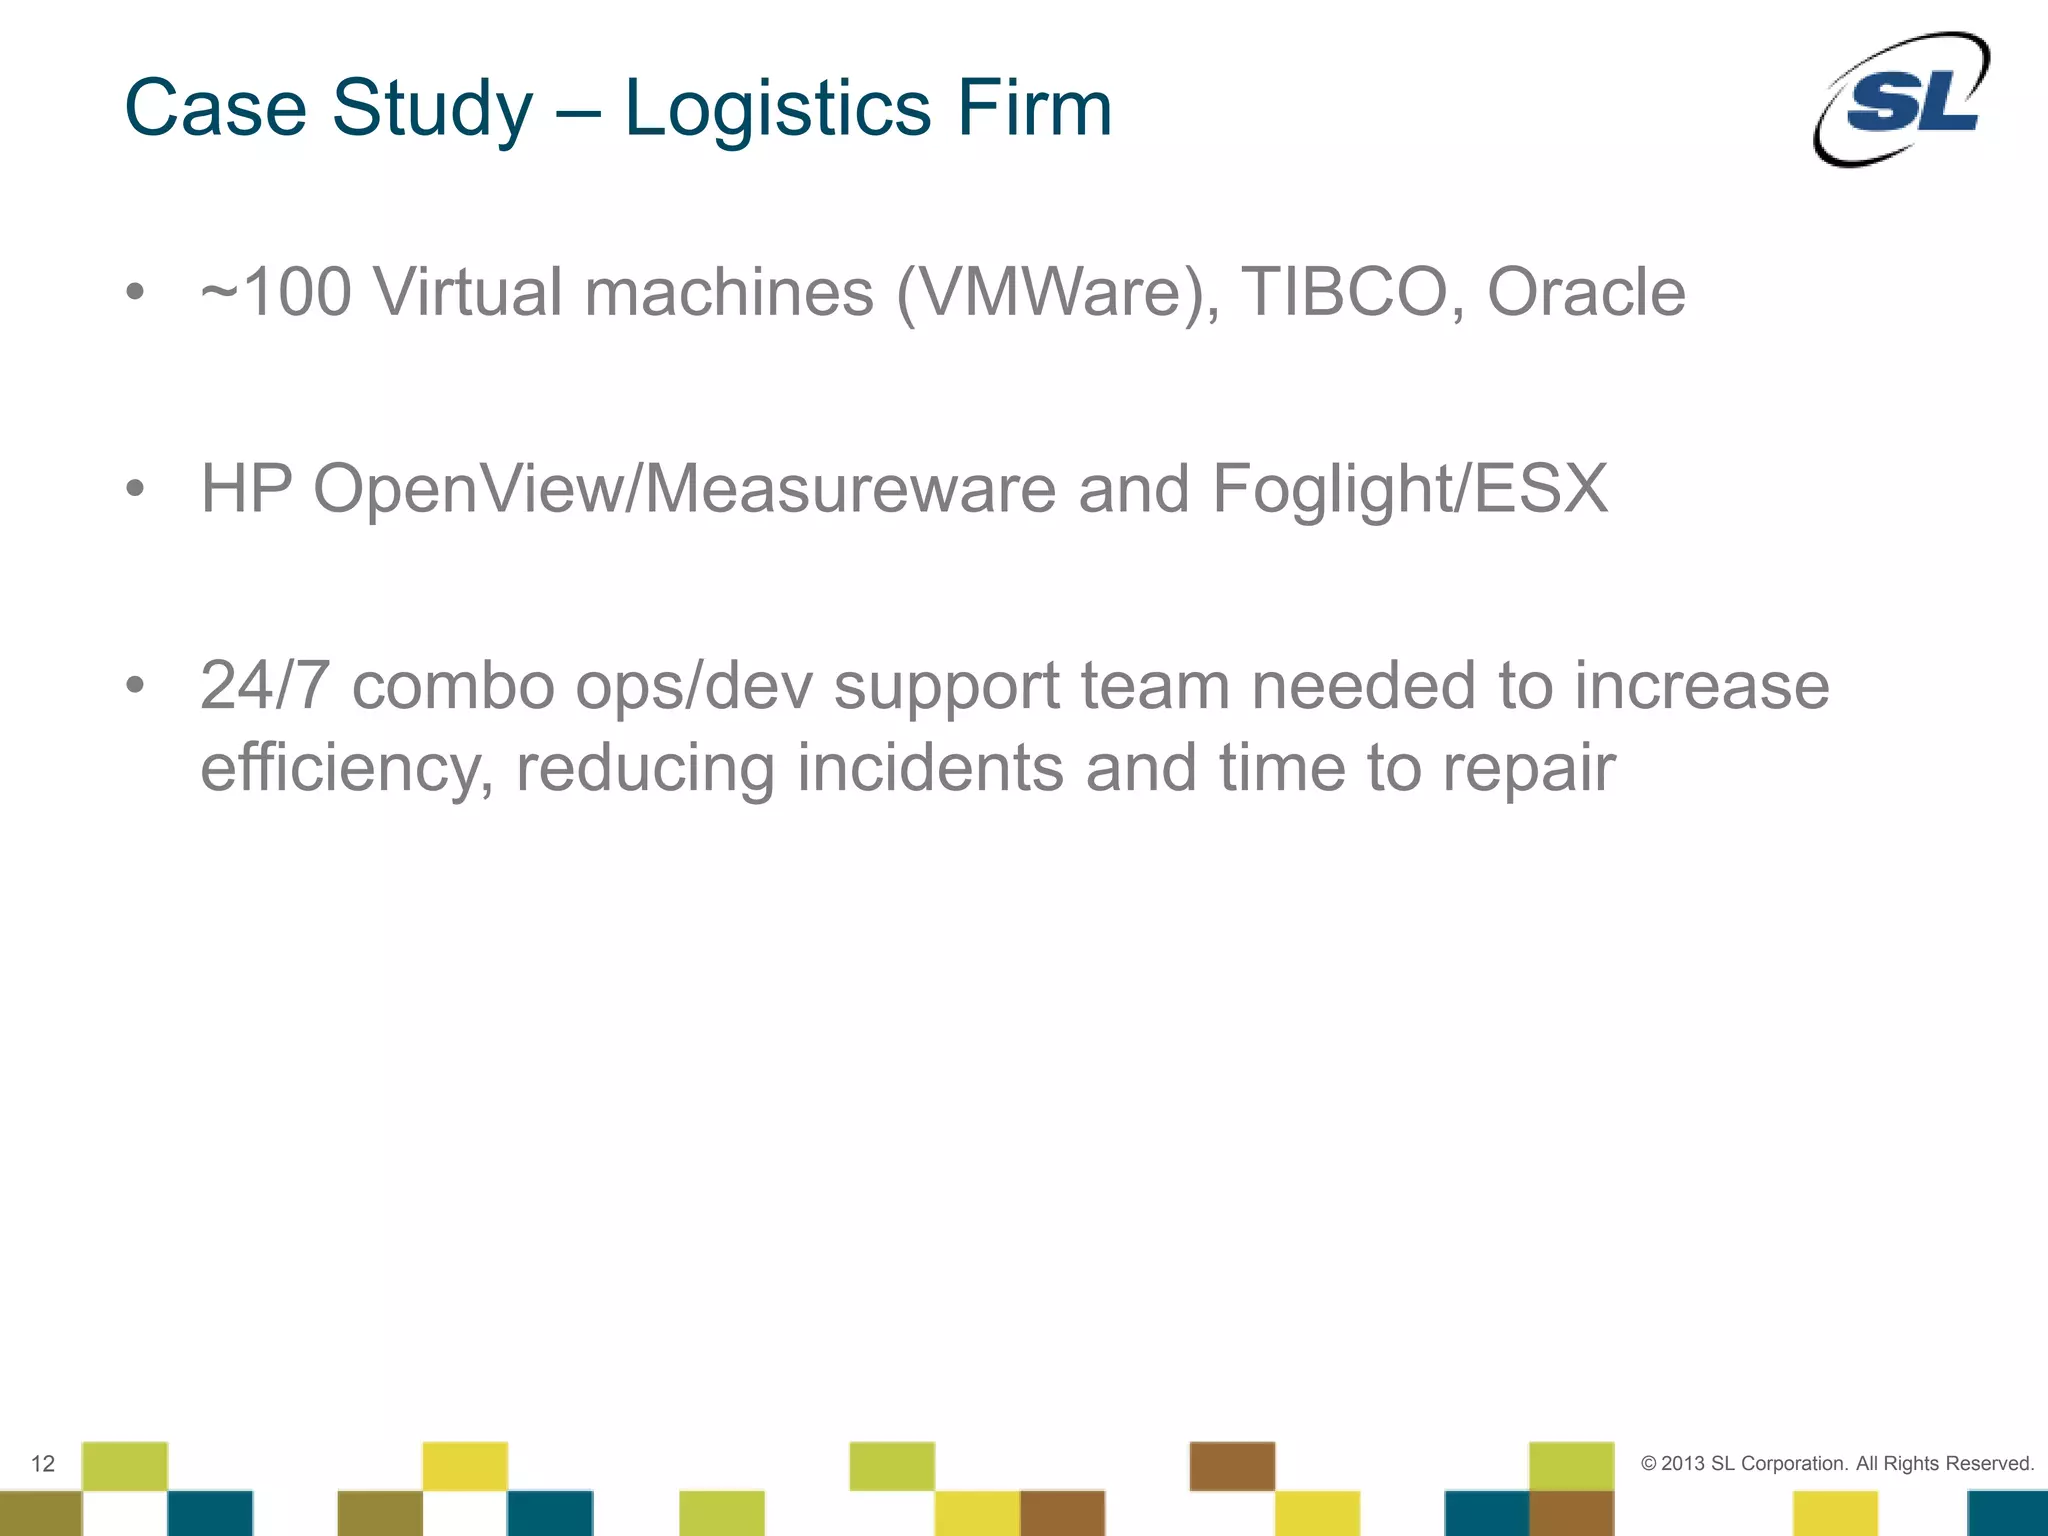
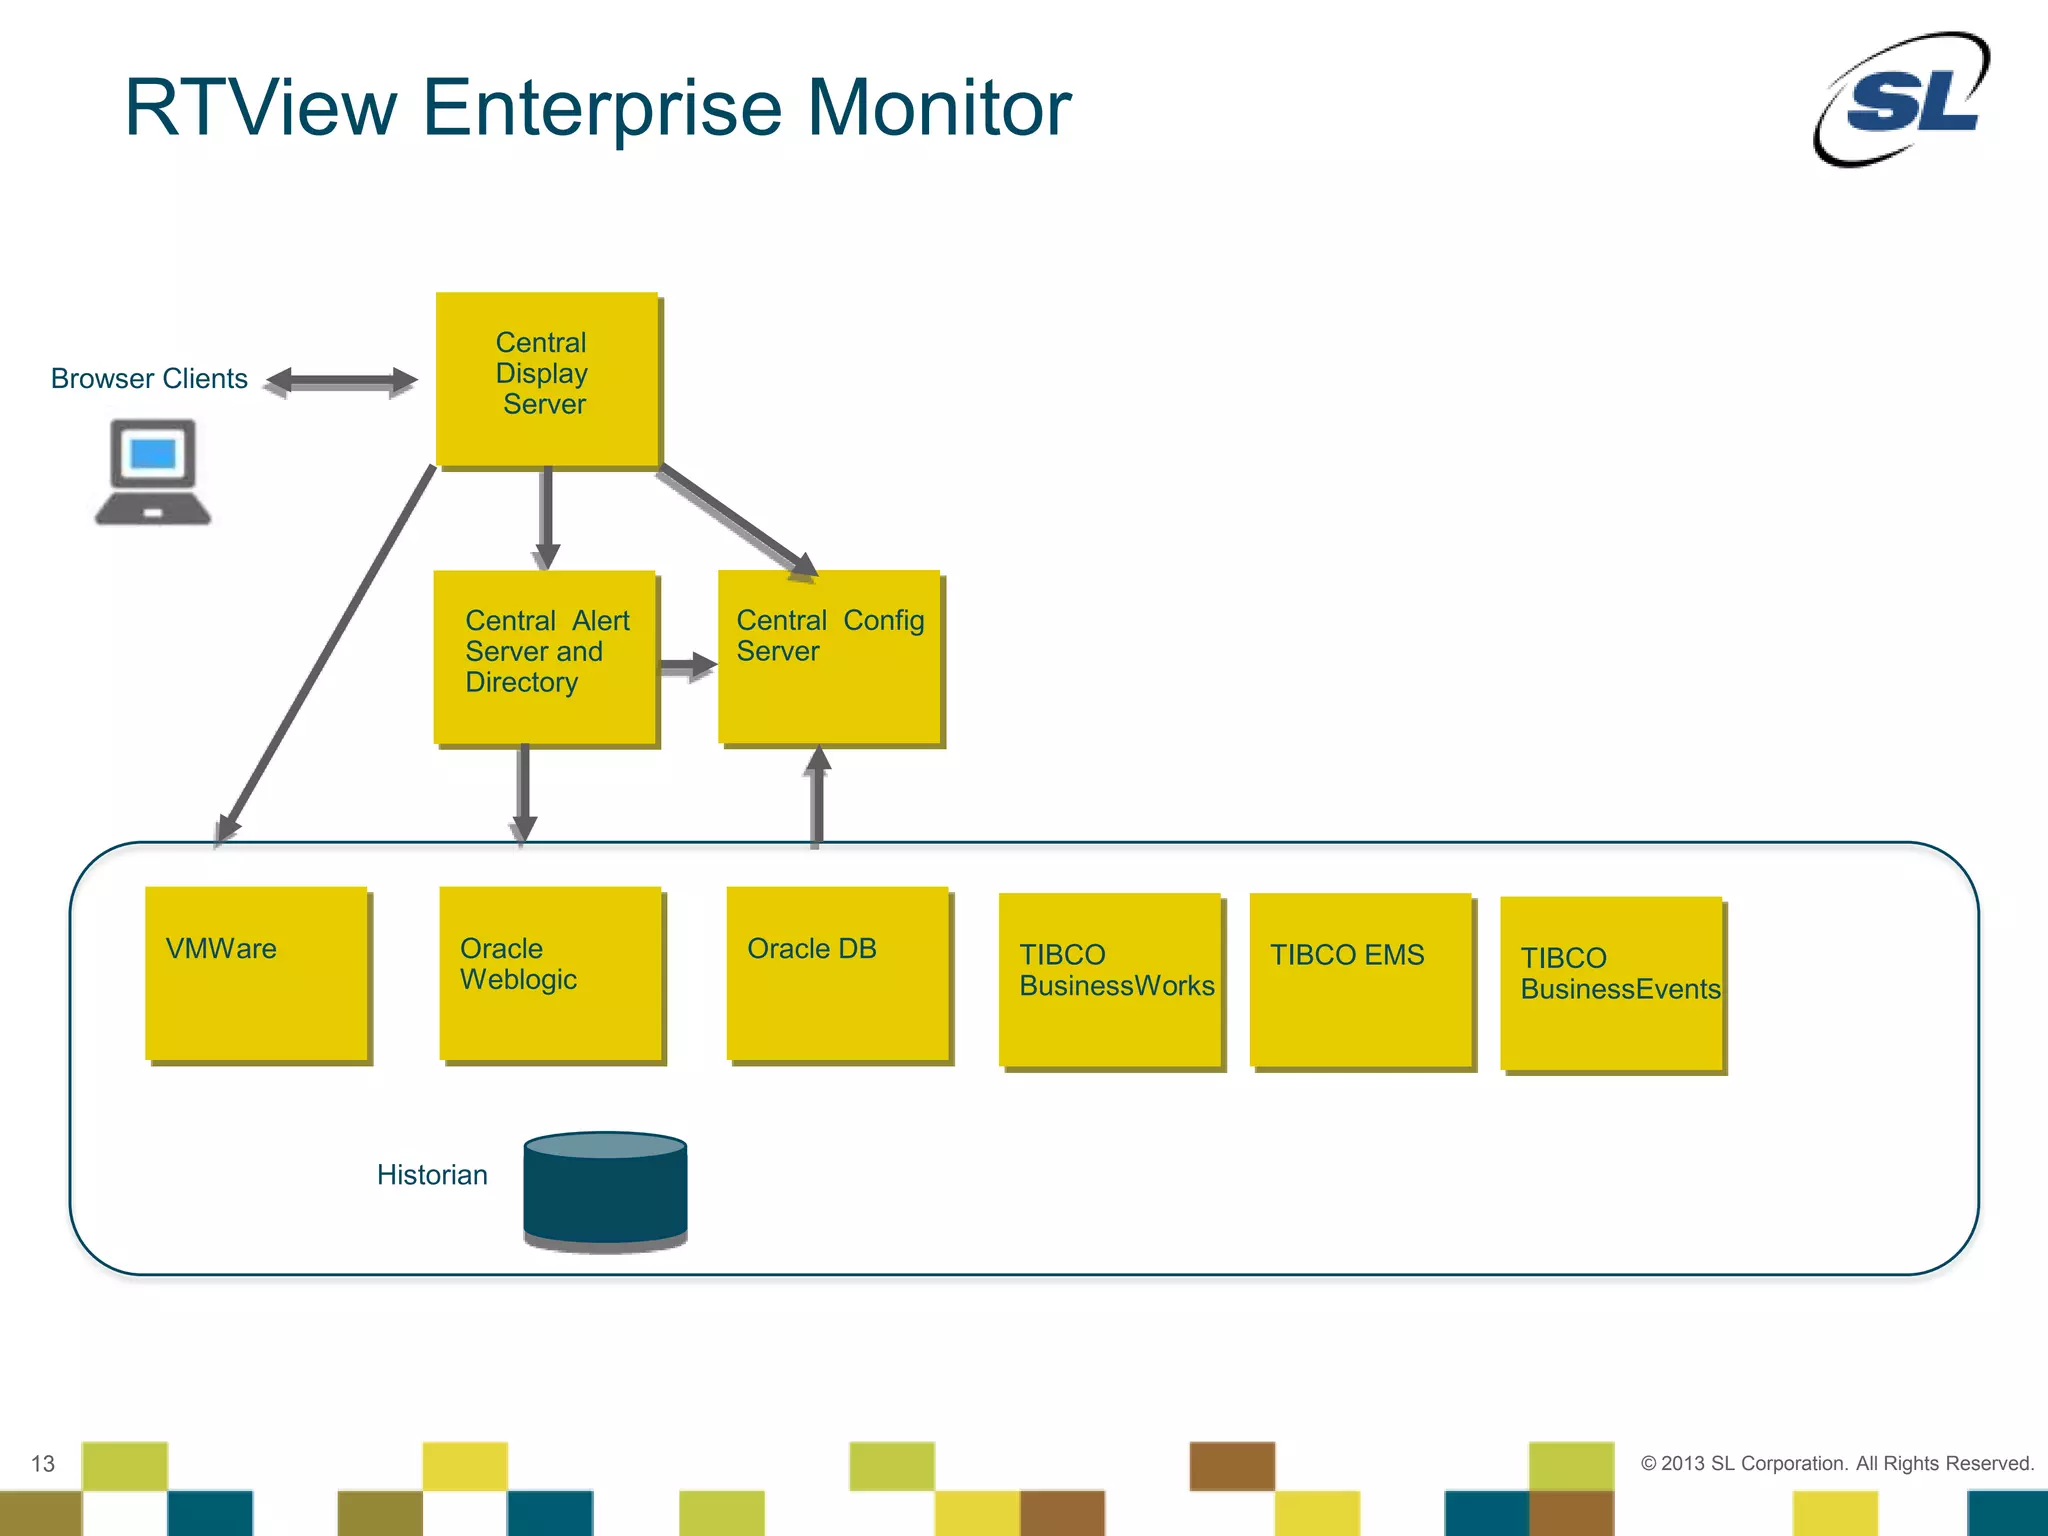
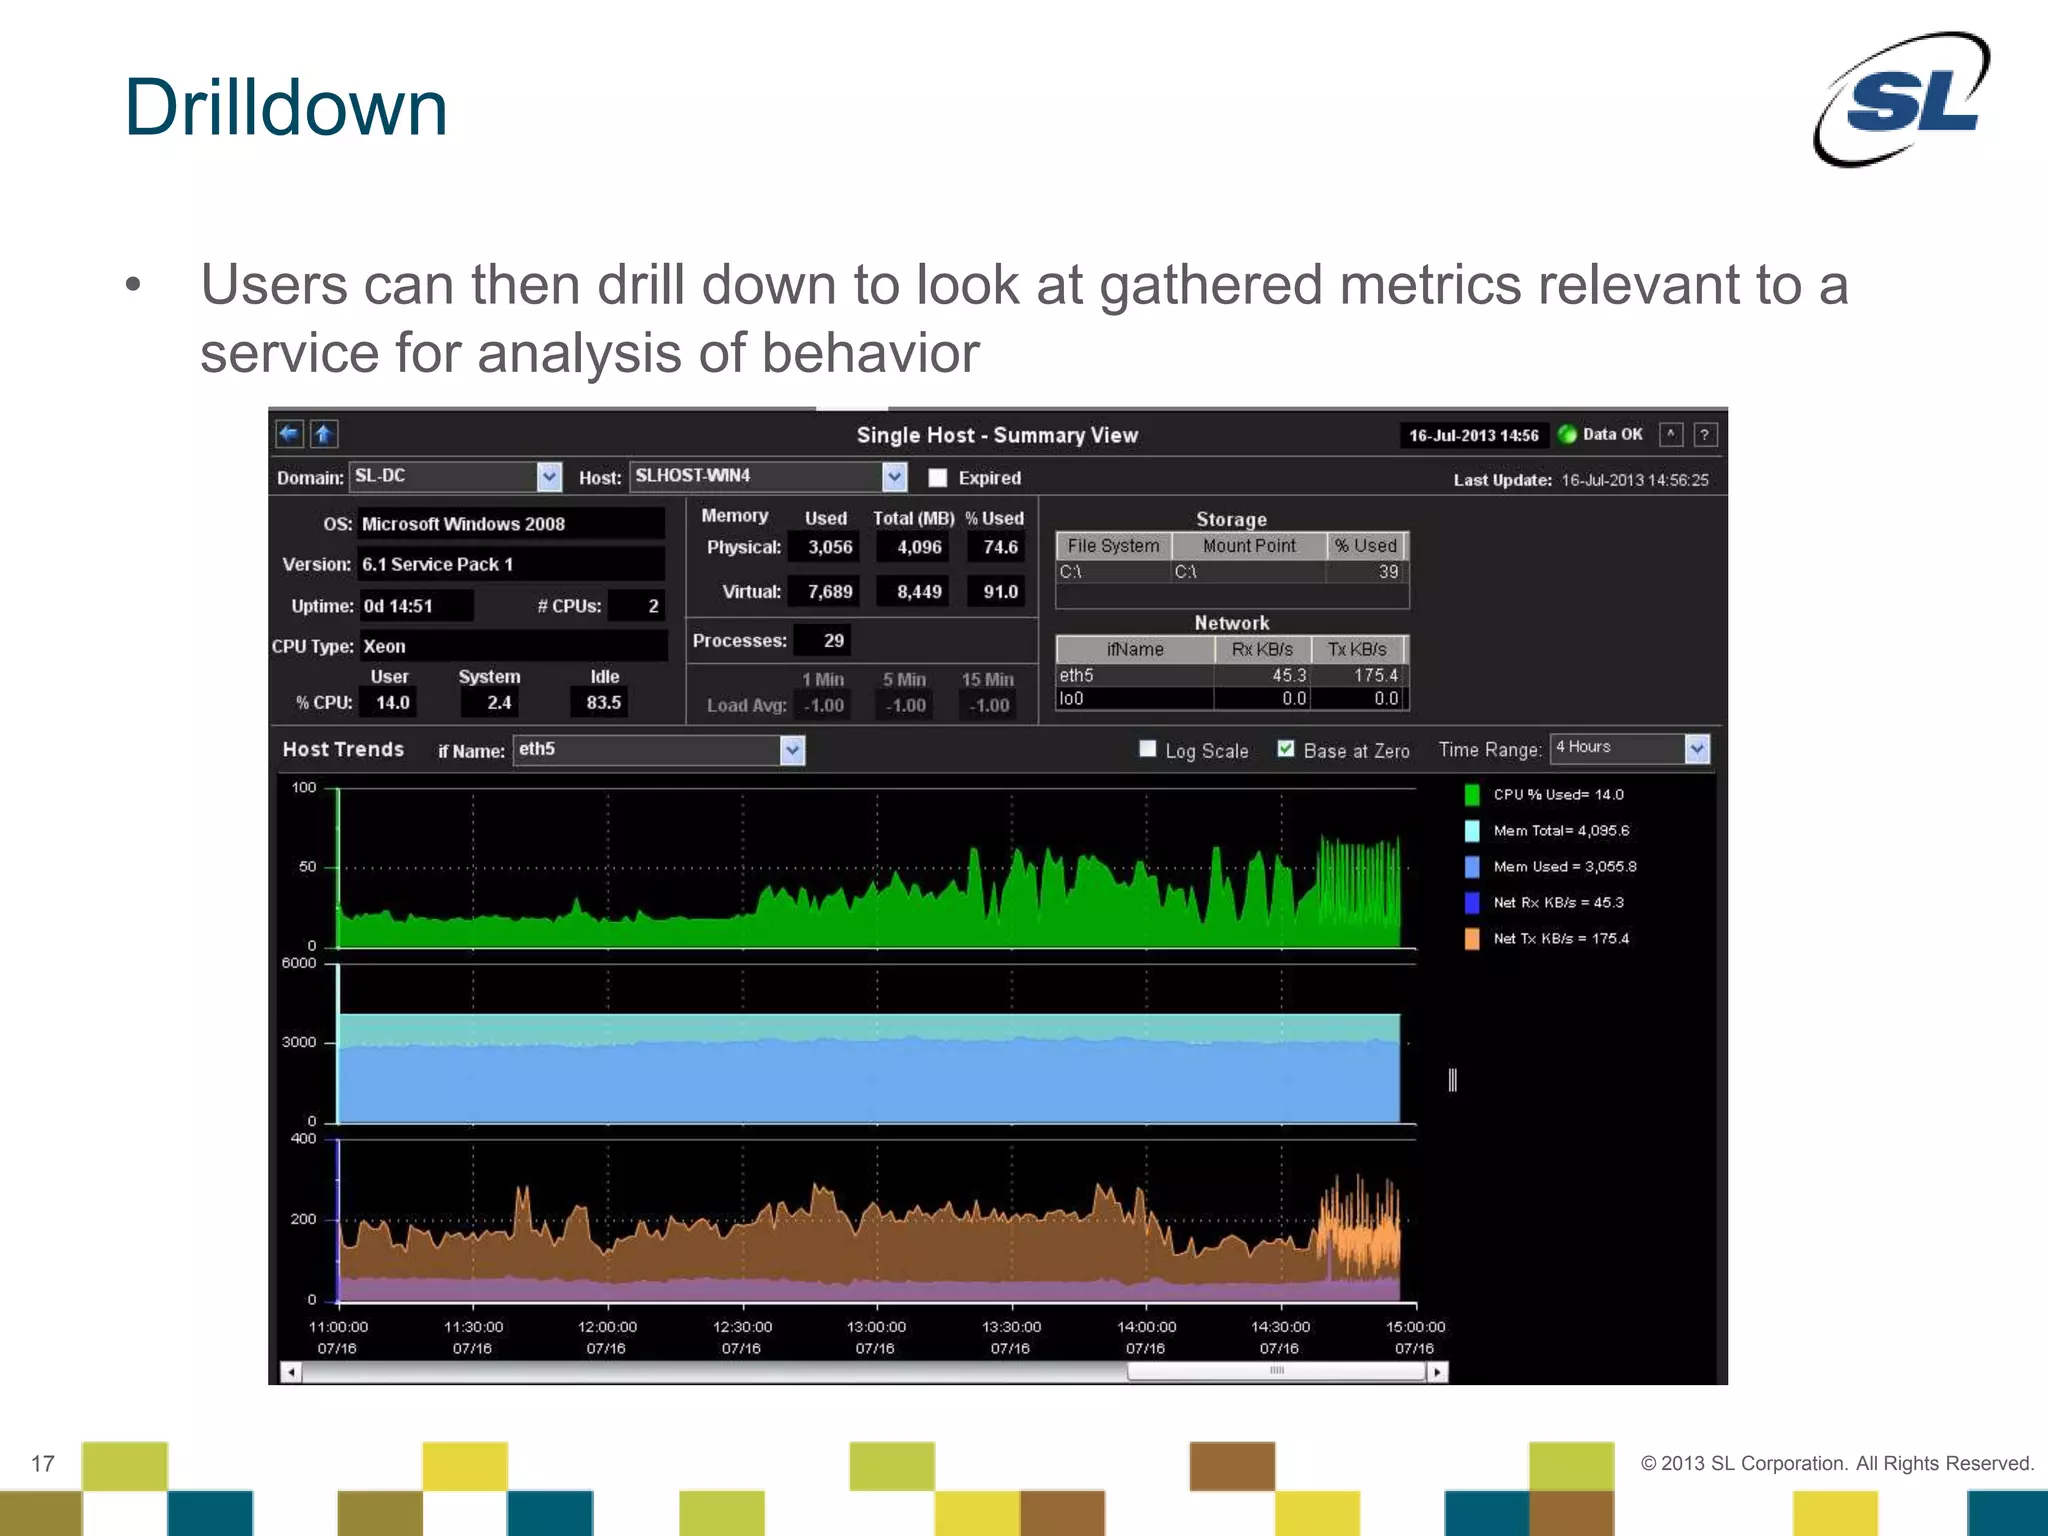
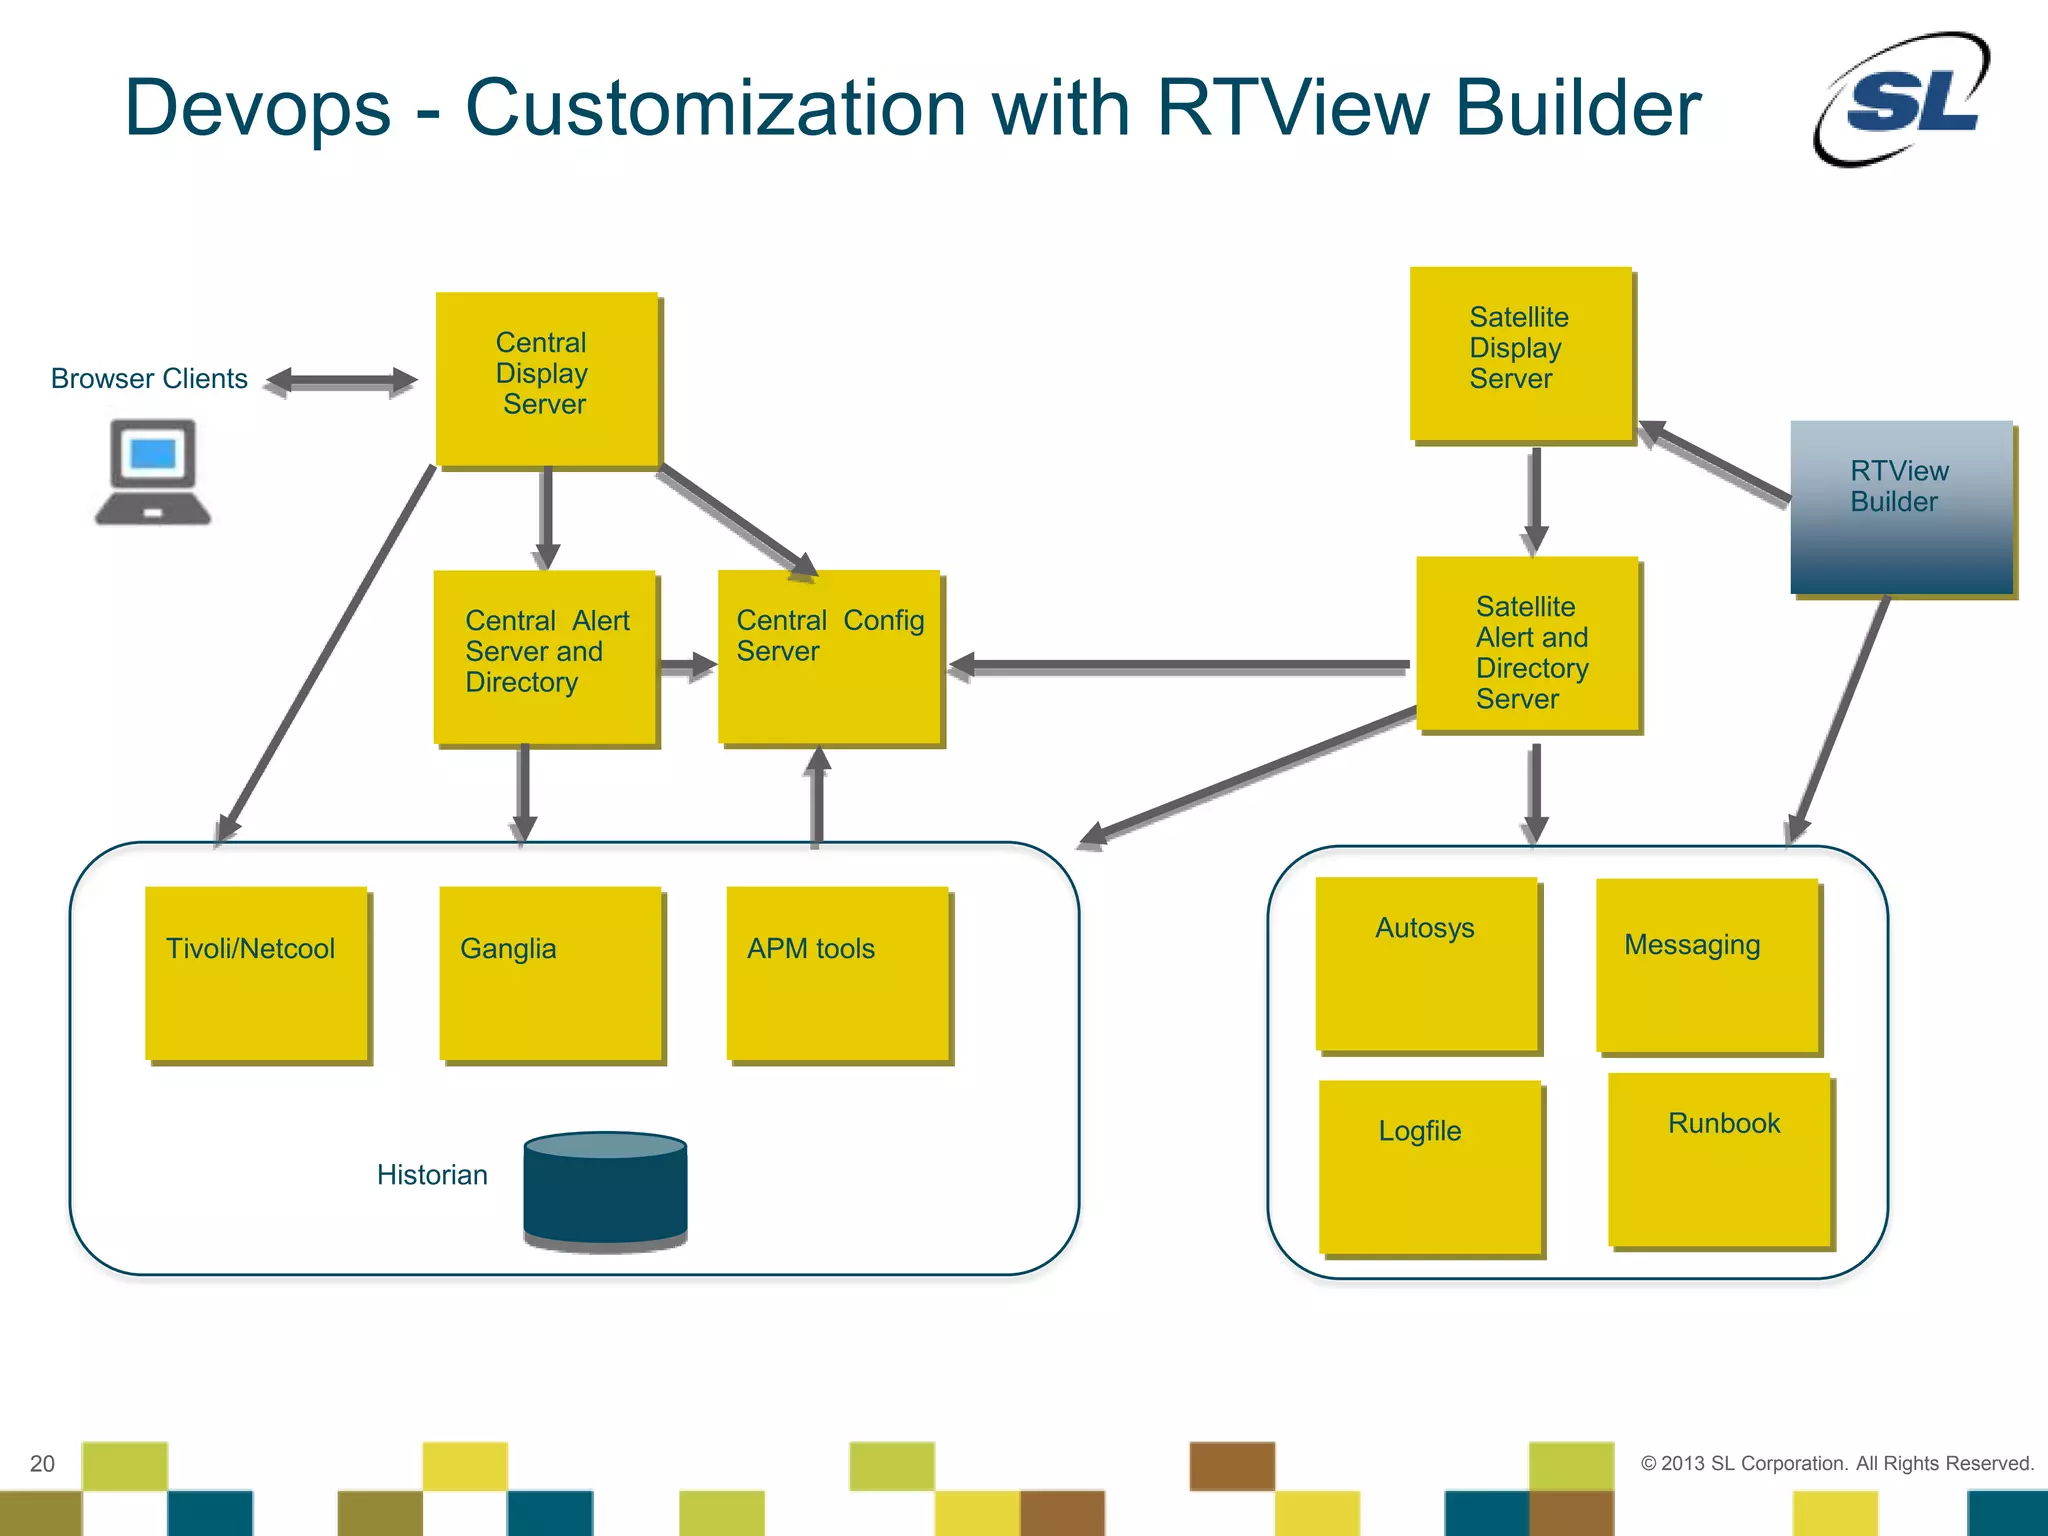
When APM came to the forefront five or so years ago, we all thought we’d finally found the answer to our visibility challenges. Almost every organization implemented some form of APM. The truth is these solutions, for the most part, delivered. APM today is doing exactly what it’s supposed to be doing. But it is still not enough.
APM has fallen short in two separate areas. One is not addressing the multitude of data – in addition to the metrics gathered by APM solutions – that must be analyzed to determine application health. The second is the failure to predict the global shift from an ITIL-based IT Ops strategy to a DevOps/Application Support structure; from silos of information to a merged architecture where everyone has access to the data and views they need.
APM is now just a piece of an end-to-end visibility and control solution.
In this webinar, Rodney Morrison, SL's VP of Products, discussed the disillusionment of APM, and did a walk-through of several use cases of companies who are leading the way to the new era of end-to-end visibility and control of their critical applications and infrastructure.
Learn how these companies are able to:
• See only the events that matter to them with enough context to show why they matter
• Provide access to end-to-end, time-correlated monitoring metrics for faster troubleshooting
• Enable custom, real-time holistic views of application configuration, dependencies and data flows for more intuitive understanding of application performance
• Automate manual processes such health checks and stop and start scripts to work faster and reduce errors
RTView Enterprise Monitor is packaged together with RTView Classic, which allows for deep customization of Enterprise Monitor, including the creation of custom Solution packages. Separately entitled Solution packages are available, covering a variety of different technologies that may be part of your application architecture.
For an organization to successfully adopt a common end to end monitoring platform it has got to be flexible. Otherwise business units will stray from the solution and defeat the cost saving intent for reducing the number of point solutions.At the heart of RTView Enterprise Monitor is RTView Classic which is a product that has been used for over a decade for rapid development of real-time information systems.RTViewClassic is used to create custom views for Enterprise Monitor, Custom Solution packages to bring data and events from specific technologies or monitoring tools, and custom alert rule templates. Solution packages come with a wide variety of predefined alert rule templates. Alert rule templates allow one rule definition to apply to many monitored configuration items in EM. Once an alert rule template is created, end users can configure a global alert threshold to apply to all configuration items as well as overrides for specific items. Those alert templates can be managed from the EM alert administration console to set thresholds, overrides, enable/disable and activation policies dynamically at run-time without requiring rule base updates to the system.
So I am going to go over fairly quickly two uses cases today. One from a small organization and one from a very large IT organization. The first one is a small to medium logistics firm which manages transportation and shipping of goods worldwide. To manage those processes they have applications running on 200 Virtual Machines. Their application architecture includes Oracle Weblogic, Oracle RAC DB, Oracle Coherence,TIBCOBusinessWorks, TIBCO EMS, and TIBCO BusinessEvents.Prior to implementing Enterprise RTView, they had HP OpenView and Foglight for looking at infrastructure metrics.They had worldwide support teams which were a combination of typical operations and app support and needed more visibility into their application architecture to better predict when issues were going to occur and have the data to repair them quickly.
Their end users could now view the available services in their organization and at a quick glance determine which service is going to be impacted the most by the current state of health of their infrastructure.
They can also look at the health state of a service over time, to see when the service was in a critical condition, and whether that has been trending toward worse service levels or is perhaps cyclical.
Each service can also be viewed by the types of supporting infrastructure it depends on and whether any of those components are in a state of performance degradation.
Once a service or a component of a service has been identified as in a state which might cause performance issues, users can drill down and look at the important performance metrics across the time range of concern.
In a few week the Devops teams now have end to end visibility of all supporting architecture components in production test and dev environments. These teams heavily used service and component level criticalities to better fine tune the summary service heatmaps so that they properly indicate which issues must be addressed first. The also implemented notification for service alerts which indicate a combination of critical events that will be sent to the party responsible for that service.In the future they also plan to implement the ability for entitled users to instigate complex restarts from the monitoring interface to resolve issues when discovered
The next use case is a very large IT organization which first began implementing RTView EM for the Investment Bank and then after successes there moved on to implement the solution for the Retail bank.There are 10 to 20 major departments in this organization with 100s of applications and roughly 90,000 hosts. Initially Operations used Tivoli, Netcool and Ganglia to monitor infrastructure metrics. The application teams did a variety of things including runbook procedures each shift, in-house solutions, APM tools and SMS/Email notifications from the Ops teams. Typically those were not used as much because there was just too much noise for them to be useful.Their main problem was that the app support teams were not effective enough in reducing downtime and not cost effective.
Their end users could then get a heatmap which was filtered by role to show only the service which the role was responsible for
App support teams act like NOC teams, in that they have very specific alert lists that are filtered only for the areas of their concern and they can own, suppress or close those alerts from the management console. They can also optionally view the alerts being handled by the infrastructure teams, if that helps analysis.
Now most major department areas have end to end role based views for operations and application support teams. Individual business units are happy because they can extend the centrally provided solution and are not stuck with limitations on data or visualization necessary for analysis. Hundreds of support team members world wide readily adopted the new solution and work flow with success.Upcoming enhancements to the system included new performance data and integration with ServiceNow.
So to conclude, RTView is extremely flexible which is important when you need to fine tune the data you need to present and analyze to efficiently cover your monitoring needs. Its scalable and manages large data sets, which allows you to determine exactly the granularity and history necessary to optimize your application performance. And it provides Service Health, Event correlation and management and Drilldown to metrics in a role based fashion. And that is extremely important to make your support teams efficient at being aware of issues that are in their domain and not have additional noise to filter out when trying to do analysis.