The root locus construction involves several steps:
1. Obtain the closed-loop transfer function and characteristic equation d(s) = 0.
2. Re-arrange the characteristic equation.
3. Mark zeros with “o” and poles with “x” on the s-plane.
4. Highlight segments of the real axis and add arrows.
5. Determine the number of asymptotes, their angles, and where they meet the real axis.
6. Use the Routh table to determine the jw-axis crossings.
7. Compute the breakaway points.
8. Determine the departure and arrival angles.
The document contains MATLAB code for signal processing lab experiments. It includes code to:
1. Generate and plot sequences based on the user's roll number.
2. Define custom functions to generate basic sequences like unit sample, unit step, exponential rise and decay.
3. Plot signals together and manipulate signals using operations like convolution.
4. Quantize signals and calculate signal-to-quantization noise ratio (SQNR).
5. Perform operations like filtering using transfer functions and z-transforms.
6. Implement the discrete Fourier transform and inverse discrete Fourier transform using a custom function.
The document outlines Reed-Solomon error correction codes. It discusses how Reed-Solomon codes encode data using a generator polynomial to produce parity check symbols. The document then describes how Reed-Solomon codes can decode errors using syndrome calculation, error location polynomials, and finding the error positions and values through algorithms like Forney's method and Chien search. Reed-Solomon codes are widely used in applications like CDs, DVDs, wireless communications and digital television for their ability to efficiently correct both random and burst errors.
This document summarizes optimization techniques for matrix factorization and completion problems. Section 8.1 introduces the matrix factorization problem and considers minimizing reconstruction error subject to a nuclear norm penalty. Section 8.2 discusses properties of the nuclear norm, including relationships to the trace norm and Frobenius norm. Section 8.3 provides performance guarantees for matrix completion when the underlying matrix is exactly low-rank. Section 8.4 describes proximal gradient methods for optimization, including updates that involve singular value thresholding. The document concludes by discussing an extension of these methods to dictionary learning and alignment problems.
1) The document describes the design of PD and PID controllers for a plant using root locus analysis and MATLAB simulations. A PD controller was designed to meet specifications for overshoot and settling time.
2) Next, a feedback compensation problem was analyzed where the minor loop was designed to meet specifications, and then the major loop was designed.
3) Finally, a PI controller was added to reduce the steady state error to zero for the major loop response. Simulations verified the designed system met all specifications.
HW3 – Nichols plots and frequency domain specifications FORM.docxsheronlewthwaite
HW3 – Nichols plots and frequency domain specifications
FORMULAE FOR SECOND ORDER SPECIFICATIONS:
If the higher order closed-loop system has two dominant poles (and no dominant zeros) it can be approximated by a second order
system. Here are the formulae for transient specifications for second order systems or approximate second order systems:
1. Natural frequency: 𝜔𝑛 (distance of pole to origin)
2. Damping ratio: 𝜁 (related to angle of the pole)
3. The closed-loop dominant poles: 𝑝1, 𝑝2 = −𝜎 ± 𝑗𝜔𝑑 = −𝜔𝑛𝜁 ± 𝑗𝜔𝑛√1 − 𝜁
2
4. Angle of the poles with negative real axis: 𝛽 = arccos 𝜁 = cos−1 𝜁
5. The damped frequency of oscillations is the imaginary part of the roots: 𝜔𝑑
6. The exponential time constant is the reciprocal of the real part of the roots: 𝜏 =
1
𝜎
=
1
𝜔𝑛𝜁
7. Distance of the pole from origin is √𝜎2 + 𝜔𝑑
2 = 𝜔𝑛 = natural frequency.
8. Settling time: 𝑇𝑠 =
4
𝜎
=
4
𝜔𝑛𝜁
9. Peak time: 𝑇𝑝 =
𝜋
𝜔𝑑
10. Maximum overshoot: 𝑀𝑝 = 𝑒
−
𝜋𝜁
√1− 𝜁2
= 𝑒−𝜋 cot 𝛽 = 𝑒
−𝜋
𝜎
𝜔𝑑
11. To get percent overshoot multiply 𝑀𝑝 with 100.
Similar characteristics in the frequency domain are:
1. Resonant frequency of the closed loop system: 𝜔𝑟 = 𝜔𝑛√1 − 2𝜁
2
2. Resonant peak amplitude the closed loop system: 𝑀𝑟 =
1
2𝜁√1−𝜁2
Note that there is no resonant frequency or peak when the damping ratio is greater than
1
√2
= 0.707
3. Cutoff frequency the closed loop system: 𝜔𝑐 = 𝜔𝑛√1 − 2𝜁
2 + √1 + (1 − 2𝜁2)2
Cutoff frequency tells about the bandwidth and is related to speed of the closed loop system.
Higher cut-off frequency → higher bandwidth → lower settling time, rise-time, peak time.
4. Damping ratio of the closed loop system 𝜁 is related to the phase margin of the open loop system:
𝜙 = tan−1
2
√√4+
1
𝜁4
−2
(𝑖𝑛 𝑟𝑎𝑑𝑖𝑎𝑛𝑠) ≈ 100𝜁 (𝑖𝑛 𝑑𝑒𝑔𝑟𝑒𝑒𝑠)
The approximate formula for phase margin, 100𝜁, works only for phase margins up to about 60 degrees.
Errors specifications:
1. For a typical system with a plant G and controller K.
The error is 𝐸(𝑠) =
1
1+𝐺𝐾
𝑅
The steady state error is 𝑒(∞) = lim
𝑠→0
𝐸(𝑠)𝑠 = lim
𝑠→0
𝑠𝑅
1+𝐺𝐾
2. Steady state error for a step input R(s) = 1/s is:
𝑒(∞) = lim
𝑠→0
1
1 + 𝐺𝐾
=
1
1 + lim
𝑠→0
𝐺𝐾
=
1
1 + 𝑑𝑐 𝑔𝑎𝑖𝑛 𝑜𝑓 𝐺𝐾
=
1
1 + 𝐾𝑝
3. Steady state error for a ramp input R(s) = 1/s2 is:
𝑒(∞) = lim
𝑠→0
1
𝑠(1 + 𝐺𝐾)
=
1
lim
𝑠→0
𝑠𝐺𝐾
=
1
𝐾𝑣
If GK has no integrator 𝐾𝑣 is 0 (ramp error is infinite). If GK has 1 integrator 𝐾𝑣 is finite, it is the x-intercept (frequency
intercept) of the asymptote line from the left half of the bode(GK). If GK has more integrators 𝐾𝑣 is infinite.
4. To reduce the error due to reference command (and disturbance dy) of frequency 𝜔 by a factor of F: |𝐺(𝑗𝜔)| > 𝐹 + 1 .
5. To reduce the error due to a sinusoidal noise command of frequency 𝜔 by a factor of F: |𝐺(
In this talk I introduced Yampa, the AFRP framework in Haskell, and the Quake-like game made by it. The content convers the basic of Functional Reactive Programming, Haskell Arrow, Yampa itself, time-space leak, etc.
This document provides an introduction to the lifting scheme for wavelet construction. Some key points:
- Lifting provides an alternative to classical wavelet transforms for constructing wavelets in an in-place and computationally efficient manner through split, predict, and update steps.
- Simple examples of lifting include the Haar wavelet, which splits data into even and odd indices, predicts the detail as the difference between pairs, and updates to preserve the average.
- The linear interpolation wavelet is also presented, using a higher order predictor and update to reproduce linear functions exactly.
- Lifting allows for fast, in-place computation by overwriting data during the transform without using auxiliary memory. It also facilitates
This document discusses the TMS320C6713 digital signal processor (DSP) development kit (DSK). The DSK features the high-performance TMS320C6713 floating-point DSP chip capable of 1350 million floating point operations per second. The DSK allows for efficient development and testing of applications for the C6713 DSP. It includes onboard memory, an analog interface circuit for data conversion, I/O ports, and JTAG emulation support. The DSK also includes a stereo codec for analog audio input/output.
The document describes a Python module called r.ipso that is used in GRASS GIS to generate ipsographic and ipsometric curves from raster elevation data. The module imports GRASS and NumPy libraries, reads elevation and cell count statistics from a raster, calculates normalized elevation and area values, and uses these to plot the curves and output quantile information. The module demonstrates calling GRASS functionality from Python scripts.
1. The document discusses key concepts in amplifier design using the scattering matrix (S-parameters) model. It defines concepts like transducer power gain, operating power gain, available power gain, and stability circles.
2. Operating power gain and available power gain are represented by circles on the Smith chart known as the operating power gain circle and available power gain circle respectively. These circles define the range of stable input/output impedance values that produce constant gain.
3. Several tests for stability are described, including Rollett's K-factor test and stability circles. Unilateral and bilateral cases are also distinguished, with the unilateral case requiring one port to be matched.
This document summarizes the MATLAB Reservoir Simulation Toolbox (MRST), which provides an environment for reservoir modelling and simulation using MATLAB. MRST features fully unstructured grids, rapid prototyping capabilities through automatic differentiation and object-oriented design, and industry-standard simulation methods. It has a large international user base in both academia and industry and consists of over 50 modules and thousands of lines of code.
Time response of continuous data systems, Different test Signals for the time response, Unit step response and Time-Domain Specifications, Time response of a first-order and second order systems for different test signals, Steady State Error and Error constants, Sensitivity, Control Actions: Proportional, Derivative, Integral and PID control. Introduction to Process Control Systems, Pneumatic hydraulics, Actuators.
Identification of the Mathematical Models of Complex Relaxation Processes in ...Vladimir Bakhrushin
The approach to solving the problem of complex relaxation spectra is presented.
Presentation for the XI International Conference on Defect interaction and anelastic phenomena in solids. Tula, 2007.
Practical Spherical Harmonics Based PRT MethodsNaughty Dog
The document summarizes methods for compressing precomputed radiance transfer (PRT) coefficients using spherical harmonics. It presents 4 methods with progressively higher compression ratios: Method 1 uses 9 bytes by removing a factor and scaling, Method 2 uses 6 bytes with a bit field allocation, Method 3 uses 6 bytes with a Lloyd-Max non-uniform quantizer, and Method 4 achieves 4 bytes with a different bit allocation. The methods are evaluated based on storage size, reconstruction quality, and rendering performance.
By Tobias Grosser, Scalable Parallel Computing Laboratory
The COSMO climate and weather model delivers daily forecasts for Switzerland and many other nations. As a traditional HPC application it was developed with SIMD-CPUs in mind and large manual efforts were required to enable the 2016 move to GPU acceleration. As today's high-performance computer systems increasingly rely on accelerators to reach peak performance and manual translation to accelerators is both costly and difficult to maintain, we propose a fully automatic accelerator compiler for the automatic translation of scientific Fortran codes to CUDA GPU accelerated systems. Several challenges had to be overcome to make this reality: 1) improved scalability, 2) automatic data placement using unified memory, 3) loop rescheduling to expose coarse-grained parallelism, 4) inter-procedural loop optimization, and 5) plenty of performance tuning. Our evaluation shows that end-to-end automatic accelerator compilation is possible for non-trivial portions of the COSMO climate model, despite the lack of complete static information. Non-trivial loop optimizations previously implemented manually are performed fully automatically and memory management happens fully transparently using unified memory. Our preliminary results show notable performance improvements over sequential CPU code (40s to 8s reduction in execution time) and we are currently working on closing the remaining gap to hand-tuned GPU code. This talk is a status update on our most recent efforts and also intended to gather feedback on future research plans towards automatically mapping COSMO to FPGAs.
Tobias Grosser Bio
Tobias Grosser is a senior researcher in the Scalable Parallel Computing Laboratory (SPCL) of Torsten Hoefler at the Computer Science Department of ETH Zürich. Supported by a Google PhD Fellowship he received his doctoral degree from Universite Pierre et Marie Curie under the supervision of Albert Cohen. Tobias' research is taking place at the border of low-level compilers and high-level program transformations with the goal of enabling complex - but highly-beneficial - program transformations in a production compiler environment. He develops with the Polly loop optimizer a loop transformation framework which today is a community project supported throught the Polly Labs research laboratory. Tobias also developed advanced tiling schemes for the efficient execution of iterated stencils. Today Tobias leads the heterogeneous compute efforts in the Swiss University funded ComPASC project and is about to start a three year NSF Ambizione project on advancing automatic compilation and heterogenization techniques at ETH Zurich.
Email
bgerofi@riken.jp
For more info on The Linaro High Performance Computing (HPC) visit https://www.linaro.org/sig/hpc/
This document discusses time response characteristics of first-order and second-order systems. It defines key terms like poles, zeros, damping ratio, natural frequency that determine the system response. Specific topics covered include influence of pole locations on response, specifications for transient response, comparison of underdamped vs overdamped vs critically damped systems. Worked examples calculate response parameters for various transfer functions. The document provides information on analyzing and characterizing linear system responses based on their pole-zero locations and configurations.
This document describes the design of a controller for a ball and beam system. It provides the parameters of the ball and beam model, including the mass of the ball, radius of the ball, lever arm offset, gravitational acceleration, length of the beam, ball's moment of inertia, and system equations. The design criteria are for the system to have a settling time less than 3 seconds and overshoot less than 5%. PID, root locus, and frequency response methods are used to design controllers that meet these criteria. Simulation results in MATLAB show the open-loop system response and closed-loop responses with designed controllers.
International Journal of Engineering Research and Applications (IJERA) is an open access online peer reviewed international journal that publishes research and review articles in the fields of Computer Science, Neural Networks, Electrical Engineering, Software Engineering, Information Technology, Mechanical Engineering, Chemical Engineering, Plastic Engineering, Food Technology, Textile Engineering, Nano Technology & science, Power Electronics, Electronics & Communication Engineering, Computational mathematics, Image processing, Civil Engineering, Structural Engineering, Environmental Engineering, VLSI Testing & Low Power VLSI Design etc.
The document discusses block ciphers and stream ciphers. It defines block ciphers as encrypting data in fixed-size blocks using the same key for each block. Stream ciphers encrypt individual bits or characters, generating a unique key for each bit using a pseudorandom number generator. The document then focuses on stream ciphers, describing synchronous and self-synchronizing stream ciphers, linear feedback shift registers (LFSRs) used to generate keystreams, and how to determine a stream cipher's characteristic polynomial from its keystream bits.
This document discusses analyzing algorithms and asymptotic notation. It defines running time as the number of primitive operations before termination. Examples are provided to illustrate calculating running time functions and classifying them by order of growth such as constant, logarithmic, linear, quadratic, and exponential time. Asymptotic notation such as Big-O, Big-Omega, and Big-Theta are introduced to classify functions by their asymptotic growth rates. Examples are given to demonstrate determining tight asymptotic bounds between functions. Recurrences are defined as equations describing functions in terms of smaller inputs and base cases, which are useful for analyzing recurrent algorithms.
This document provides formulas and code snippets for calculating distances, bearings, and other values between latitude/longitude points. It discusses the haversine formula for calculating great-circle distance, as well as the spherical law of cosines. It also provides formulas and examples for calculating initial and final bearings, midpoints, and intermediate points along a great-circle path between two points.
Ece512 h1 20139_621386735458ece512_test2_solutionsnadia abd
This 3-question test evaluates a student's knowledge of analog filter design and performance metrics. In question 1, the student is asked to derive the transfer function and sketch the pole-zero plot of a 2nd order bandpass filter. In question 2, the student must select component values to realize a given transfer function. Question 3 involves calculating the maximum input before distortion and estimating signal-to-noise ratios and spurious free dynamic range for a circuit over a range of input amplitudes. The student's work is shown and graded.
1) Testing digital circuits involves detecting faults that could lead to failures or errors. Common faults include stuck-at faults where a line is stuck at logic 0 or 1.
2) Test patterns are generated to detect faults by sensitizing a path from the fault to an output and justifying input values. Boolean difference and D-algorithms are used.
3) Faults in PLA circuits include growth, disappearance, shrinkage and appearance faults affecting the AND and OR planes. Their effect is modeled and tests generated.
4) Fault tolerance techniques include avoidance, detection using redundancy, masking using voting, and dynamic reconfiguration to replace faulty components. Error detecting and correcting codes are also used.
This doctoral thesis models pulse propagation in optical fibers using finite-difference methods. It summarizes the numerical model, which solves the nonlinear Schrödinger equation describing pulse propagation using Crank-Nicholson and split-step Fourier methods. It tests the model's accuracy by comparing results to analytic solutions and a commercial simulation program. Effects like dispersion, loss, self-phase modulation and polarization mode dispersion are modeled. Additional models are presented for optical amplifiers and filters used in the fiber links.
Regret Minimization in Multi-objective Submodular Function MaximizationTasuku Soma
This document presents algorithms for minimizing regret ratio in multi-objective submodular function maximization. It introduces the concept of regret ratio for evaluating the quality of a solution set for multiple objectives. It then proposes two algorithms, Coordinate and Polytope, that provide upper bounds on regret ratio by leveraging approximation algorithms for single objective problems. Experimental results on a movie recommendation dataset show the proposed algorithms achieve significantly lower regret ratios than a random baseline.
Similar to Root Locus Method - Control System - Bsc Engineering (20)
Using recycled concrete aggregates (RCA) for pavements is crucial to achieving sustainability. Implementing RCA for new pavement can minimize carbon footprint, conserve natural resources, reduce harmful emissions, and lower life cycle costs. Compared to natural aggregate (NA), RCA pavement has fewer comprehensive studies and sustainability assessments.
TIME DIVISION MULTIPLEXING TECHNIQUE FOR COMMUNICATION SYSTEMHODECEDSIET
Time Division Multiplexing (TDM) is a method of transmitting multiple signals over a single communication channel by dividing the signal into many segments, each having a very short duration of time. These time slots are then allocated to different data streams, allowing multiple signals to share the same transmission medium efficiently. TDM is widely used in telecommunications and data communication systems.
### How TDM Works
1. **Time Slots Allocation**: The core principle of TDM is to assign distinct time slots to each signal. During each time slot, the respective signal is transmitted, and then the process repeats cyclically. For example, if there are four signals to be transmitted, the TDM cycle will divide time into four slots, each assigned to one signal.
2. **Synchronization**: Synchronization is crucial in TDM systems to ensure that the signals are correctly aligned with their respective time slots. Both the transmitter and receiver must be synchronized to avoid any overlap or loss of data. This synchronization is typically maintained by a clock signal that ensures time slots are accurately aligned.
3. **Frame Structure**: TDM data is organized into frames, where each frame consists of a set of time slots. Each frame is repeated at regular intervals, ensuring continuous transmission of data streams. The frame structure helps in managing the data streams and maintaining the synchronization between the transmitter and receiver.
4. **Multiplexer and Demultiplexer**: At the transmitting end, a multiplexer combines multiple input signals into a single composite signal by assigning each signal to a specific time slot. At the receiving end, a demultiplexer separates the composite signal back into individual signals based on their respective time slots.
### Types of TDM
1. **Synchronous TDM**: In synchronous TDM, time slots are pre-assigned to each signal, regardless of whether the signal has data to transmit or not. This can lead to inefficiencies if some time slots remain empty due to the absence of data.
2. **Asynchronous TDM (or Statistical TDM)**: Asynchronous TDM addresses the inefficiencies of synchronous TDM by allocating time slots dynamically based on the presence of data. Time slots are assigned only when there is data to transmit, which optimizes the use of the communication channel.
### Applications of TDM
- **Telecommunications**: TDM is extensively used in telecommunication systems, such as in T1 and E1 lines, where multiple telephone calls are transmitted over a single line by assigning each call to a specific time slot.
- **Digital Audio and Video Broadcasting**: TDM is used in broadcasting systems to transmit multiple audio or video streams over a single channel, ensuring efficient use of bandwidth.
- **Computer Networks**: TDM is used in network protocols and systems to manage the transmission of data from multiple sources over a single network medium.
### Advantages of TDM
- **Efficient Use of Bandwidth**: TDM all
Introduction- e - waste – definition - sources of e-waste– hazardous substances in e-waste - effects of e-waste on environment and human health- need for e-waste management– e-waste handling rules - waste minimization techniques for managing e-waste – recycling of e-waste - disposal treatment methods of e- waste – mechanism of extraction of precious metal from leaching solution-global Scenario of E-waste – E-waste in India- case studies.
Embedded machine learning-based road conditions and driving behavior monitoringIJECEIAES
Car accident rates have increased in recent years, resulting in losses in human lives, properties, and other financial costs. An embedded machine learning-based system is developed to address this critical issue. The system can monitor road conditions, detect driving patterns, and identify aggressive driving behaviors. The system is based on neural networks trained on a comprehensive dataset of driving events, driving styles, and road conditions. The system effectively detects potential risks and helps mitigate the frequency and impact of accidents. The primary goal is to ensure the safety of drivers and vehicles. Collecting data involved gathering information on three key road events: normal street and normal drive, speed bumps, circular yellow speed bumps, and three aggressive driving actions: sudden start, sudden stop, and sudden entry. The gathered data is processed and analyzed using a machine learning system designed for limited power and memory devices. The developed system resulted in 91.9% accuracy, 93.6% precision, and 92% recall. The achieved inference time on an Arduino Nano 33 BLE Sense with a 32-bit CPU running at 64 MHz is 34 ms and requires 2.6 kB peak RAM and 139.9 kB program flash memory, making it suitable for resource-constrained embedded systems.
Presentation of IEEE Slovenia CIS (Computational Intelligence Society) Chapte...University of Maribor
Slides from talk presenting:
Aleš Zamuda: Presentation of IEEE Slovenia CIS (Computational Intelligence Society) Chapter and Networking.
Presentation at IcETRAN 2024 session:
"Inter-Society Networking Panel GRSS/MTT-S/CIS
Panel Session: Promoting Connection and Cooperation"
IEEE Slovenia GRSS
IEEE Serbia and Montenegro MTT-S
IEEE Slovenia CIS
11TH INTERNATIONAL CONFERENCE ON ELECTRICAL, ELECTRONIC AND COMPUTING ENGINEERING
3-6 June 2024, Niš, Serbia
Optimizing Gradle Builds - Gradle DPE Tour Berlin 2024Sinan KOZAK
Sinan from the Delivery Hero mobile infrastructure engineering team shares a deep dive into performance acceleration with Gradle build cache optimizations. Sinan shares their journey into solving complex build-cache problems that affect Gradle builds. By understanding the challenges and solutions found in our journey, we aim to demonstrate the possibilities for faster builds. The case study reveals how overlapping outputs and cache misconfigurations led to significant increases in build times, especially as the project scaled up with numerous modules using Paparazzi tests. The journey from diagnosing to defeating cache issues offers invaluable lessons on maintaining cache integrity without sacrificing functionality.
Redefining brain tumor segmentation: a cutting-edge convolutional neural netw...IJECEIAES
Medical image analysis has witnessed significant advancements with deep learning techniques. In the domain of brain tumor segmentation, the ability to
precisely delineate tumor boundaries from magnetic resonance imaging (MRI)
scans holds profound implications for diagnosis. This study presents an ensemble convolutional neural network (CNN) with transfer learning, integrating
the state-of-the-art Deeplabv3+ architecture with the ResNet18 backbone. The
model is rigorously trained and evaluated, exhibiting remarkable performance
metrics, including an impressive global accuracy of 99.286%, a high-class accuracy of 82.191%, a mean intersection over union (IoU) of 79.900%, a weighted
IoU of 98.620%, and a Boundary F1 (BF) score of 83.303%. Notably, a detailed comparative analysis with existing methods showcases the superiority of
our proposed model. These findings underscore the model’s competence in precise brain tumor localization, underscoring its potential to revolutionize medical
image analysis and enhance healthcare outcomes. This research paves the way
for future exploration and optimization of advanced CNN models in medical
imaging, emphasizing addressing false positives and resource efficiency.
A SYSTEMATIC RISK ASSESSMENT APPROACH FOR SECURING THE SMART IRRIGATION SYSTEMSIJNSA Journal
The smart irrigation system represents an innovative approach to optimize water usage in agricultural and landscaping practices. The integration of cutting-edge technologies, including sensors, actuators, and data analysis, empowers this system to provide accurate monitoring and control of irrigation processes by leveraging real-time environmental conditions. The main objective of a smart irrigation system is to optimize water efficiency, minimize expenses, and foster the adoption of sustainable water management methods. This paper conducts a systematic risk assessment by exploring the key components/assets and their functionalities in the smart irrigation system. The crucial role of sensors in gathering data on soil moisture, weather patterns, and plant well-being is emphasized in this system. These sensors enable intelligent decision-making in irrigation scheduling and water distribution, leading to enhanced water efficiency and sustainable water management practices. Actuators enable automated control of irrigation devices, ensuring precise and targeted water delivery to plants. Additionally, the paper addresses the potential threat and vulnerabilities associated with smart irrigation systems. It discusses limitations of the system, such as power constraints and computational capabilities, and calculates the potential security risks. The paper suggests possible risk treatment methods for effective secure system operation. In conclusion, the paper emphasizes the significant benefits of implementing smart irrigation systems, including improved water conservation, increased crop yield, and reduced environmental impact. Additionally, based on the security analysis conducted, the paper recommends the implementation of countermeasures and security approaches to address vulnerabilities and ensure the integrity and reliability of the system. By incorporating these measures, smart irrigation technology can revolutionize water management practices in agriculture, promoting sustainability, resource efficiency, and safeguarding against potential security threats.
Using recycled concrete aggregates (RCA) for pavements is crucial to achieving sustainability. Implementing RCA for new pavement can minimize carbon footprint, conserve natural resources, reduce harmful emissions, and lower life cycle costs. Compared to natural aggregate (NA), RCA pavement has fewer comprehensive studies and sustainability assessments.
Harnessing WebAssembly for Real-time Stateless Streaming PipelinesChristina Lin
Traditionally, dealing with real-time data pipelines has involved significant overhead, even for straightforward tasks like data transformation or masking. However, in this talk, we’ll venture into the dynamic realm of WebAssembly (WASM) and discover how it can revolutionize the creation of stateless streaming pipelines within a Kafka (Redpanda) broker. These pipelines are adept at managing low-latency, high-data-volume scenarios.
2008 BUILDING CONSTRUCTION Illustrated - Ching Chapter 02 The Building.pdf
Root Locus Method - Control System - Bsc Engineering
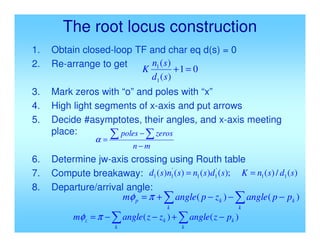
1. The root locus construction
1. Obtain closed-loop TF and char eq d(s) = 0
2. Re-arrange to get
3. Mark zeros with “o” and poles with “x”
4. High light segments of x-axis and put arrows
5. Decide #asymptotes, their angles, and x-axis meeting
place:
6. Determine jw-axis crossing using Routh table
7. Compute breakaway:
8. Departure/arrival angle:
0
1
)
(
)
(
1
1
=
+
s
d
s
n
K
m
n
zeros
poles
−
−
=
α
)
(
/
)
(
);
(
)
(
)
(
)
( 1
1
'
1
1
'
1
1 s
d
s
n
K
s
d
s
n
s
n
s
d =
=
−
−
−
+
=
k
k
k
k
p p
p
angle
z
p
angle
m )
(
)
(
π
φ
−
+
−
−
=
k
k
k
k
z p
z
angle
z
z
angle
m )
(
)
(
π
φ
2. General controller design
G(s)
C(s)
+
-
r(s) e y(s)
plant
controller
Goal: for a given plant G(s)
a set of desired step response specifications
design a controller C(s) such that
the closed-loop step response meets the desired specs
3. RL based controller parameter selection
• Controller form is given
• A single parameter needs to be determined
– Draw root locus
– Select dominant poles in the desired region
• Two parameter needs to be determined
– Use required specification to reduce degree of
freedoms to one
– Draw root locus
– Select dominant pole in desired region
4. Effects of additional pole
• One additional R.L. branch shoots out
• It increases # asymp. by one
– More asymptotes go towards +Re-axis
– More likely to be unstable
• Poles tend to push R.L. away from them
Don’t introduce poles unless required by
other concerns
6. Effects of additional zero
• It sinks one branch of R.L.
• It reduces the # asymp. by one
– Asymptotes move more towards –Re-axis
– More likely to be stable
• Zeros attract R.L.
– Each zero attracts one branch
– If > 1 branches nearby, they go to Re-axis
& split, the one branch goes to zero
– Never have >= 2 branches go to a zero
8. • The dominant pole
pair are more
negative
• But there is one pole
(real) close to s = 0,
which will settle very
slowly (sluggish
settling)
If we put that additional zero
near (0,0):
9. Controller design by R.L.
Typical setup:
C(s) G(s)
( )
( )
( )
( )
0
1
1
1
=
+
⋅
−
−
s
d
s
n
p
s
z
s
K
L
L
( ) ( )
( )
s
d
s
n
s
G =
( )( )
( )( )L
L
2
1
2
1
)
(
p
s
p
s
z
s
z
s
K
s
C
−
−
−
−
=
Controller Design Goal:
1. Select poles and zero of C(s) so that R.L. pass through desired region
2. Select K corresponding to a good choice of dominant pole pair
10. Matlab program template
% enter plant transfer function Gp(s)
nump = …. ; denp=…. ;
% enter desired closed loop step response specification:
% you may allow both uppper and lower limits
… …
% convert from specs to zeta, omegan, sigma, omegad
… …
%Draw root locus; may need to re-arrange equation based on steady state ess requirements
…
%adjust window size, x-limit, y-limit, etc using values of omegan, sigma, omegad
…
% hold the graph, and plot allowable region for pole location on RL graph
… …
% Computer controller transfer function
%if PD or lead needed, design a PD or lead
…
%if PI or lag needed, design a PI or lag
…
%design P, or final decision on overall gain
…
% get controller TF
…
% obtain closed loop transfer function from Gp(s) and C(s)
… … numcl=…; dencl=…; … …
% obtain closed-loop step response
… …
% compute actual step response specs, using your program from before
… …
% are they good?
% compute the actual closed-loop poles, place “x” at those locations
… …
% are they in the allowable region?
11. Proportional control design
1. Draw R.L. for given plant
2. Draw desired region for poles from specs
3. Pick a point on R.L. and in desired region
• Use ginput to get point and convert to complex #
4. Compute K using abs
and polyval
5. Obtain closed-loop TF
6. Obtain step response and compute specs
7. Decide if modification is needed
( )
( )
0
1=
+
s
d
s
n
K
( ) ( )
D
P
G
s
G
K
1
1
=
−
=
12. When to use:
If R.L. of G(s) goes through
the desired region for c.l. poles
What is that region:
– From design specs, get desired Mp, ts, tr,
etc.
– Use formulae for 2nd order system to get
desired ωn , ζ, σ, ωd
– Identify / plot these in s-plane
13. Example:
When C(s) = 1, things are okay
But we want initial response speed as fast as
possible; yet we can only tolerate 10%
overshoot.
Sol: From the above, we need
that means:
( )
6
1
+
s
s
%
10
≤
p
M
6
.
0
≥
ζ
C(s)
14.
15.
16.
17.
18.
19.
20.
21. This is a cone around –Re axis with ±60° area
We also want tr to be as small as possible.
i.e. : want ωn as large as possible
i.e. : want pd to be as far away from s = 0 as
possible
1. Enter plant, Draw R.L., draw max Mp cone
2. Since RL pass through desired cone, Pick
pd on R.L., in cone, with max | pd |
3.
( )
25
6
1
=
+
⋅
=
= d
d
d
p
p
p
G
K
24. Example:
Want: , as fast as possible
Sol:
1. Draw R.L. for
2.
Draw cone ±45° about –Re axis
3. Pick pd as the crossing point of the
ζ= 0.7 line & R.L.
4.
( )
( )( )
6
2
10
+
+
=
s
s
s
s
G
%
5
≤
p
M
( )
1
2 6 10 0.94
P d d d
d
K p p p
G p
= = ⋅ + ⋅ + ≈
7
.
0
%
5 ≥
≤ ζ
p
M
( )
6
)
2
(
10
+
+ s
s
s
C(s)
pd=-0.9+j0.9
25. -25 -20 -15 -10 -5 0 5 10
-20
-15
-10
-5
0
5
10
15
20
Root Locus
Real Axis
Im
a
g
in
a
r
y
A
x
is
26. 0 1 2 3 4 5 6 7 8
0
0.2
0.4
0.6
0.8
1
Step Response
Time (sec)
Amplitude
Overshoot is a little too much.
Re-choose pd =-0.8+j0.8
27.
28. -6 -5 -4 -3 -2 -1 0 1
-5
0
5
0.12
0.24
0.38
0.5
0.64
0.76
0.88
0.97
0.12
0.24
0.38
0.5
0.64
0.76
0.88
0.97
1
2
3
4
5
6
Root Locus
RealAxis
I
m
a
g
i
n
a
r
y
A
x
i
s
30. Controller tuning:
1. First design typically may not work
2. Identify trends of specs changes as K
is increased.
e.g.: as KP , pole
3. Perform closed-loop step response
4. Adjust K to improve specs
e.g. If MP too much, the 2. says
reduce KP
↑
↓
∴
↑
↓
∴ P
d M
&
,
, ζ
ω
σ
31. PD controller design
•
• This is introducing an additional zero to
the R.L. for G(s)
• Use this if the dominant pole pair
branches of G(s) do not pass through
the desired region
• Place additional zero to “bend” the RL
into the desired region
( ) ( )
z
s
K
s
K
K
s
C D
D
P +
=
+
=
D
P K
K
z =
32.
33. Design steps:
1. From specs, draw desired region for pole.
Pick from region, not on RL
2. Compute
3. Select
4. Select:
d
d j
p ω
σ +
−
=
( )
d
p
G
∠
( ) ( )
d
d p
G
z
p
z ∠
−
=
+
∠ π
s.t.
( )
( )
d
d p
G
z ∠
−
+
= π
ω
σ tan
i.e.
( )
⋅
=
⋅
+
=
D
P
d
d
D
K
z
K
p
G
z
p
K
1
Gpd=evalfr(sys_p,pd)
phi=pi - angle(Gpd)
z=abs(real(pd))+abs(imag(pd)/tan(phi))
Kd=1/abs(pd+z)/abs(Gpd)
Use [x, y] = ginput(1);
pd = x+j*y;
34.
35.
36. Example:
Want:
Sol:
(pd not on R.L.)
(Need a zero to attract R.L. to pd)
%
2
sec
2
%,
5 for
t
M s
p ≤
≤
7
.
0
%
5 ≥
≤ ζ
p
M
2
4
sec
2 ≥
=
≤
s
s
t
t σ
2
2
Choose j
pd +
−
=
( )
707
.
0
,
2
,
2 =
=
= ζ
ω
σ d
)
2
(
1
+
s
s
C(s)
37.
38.
39.
40.
41. 2.
3.
4.
( )
4
tan π
ω
σ d
z +
=
( ) ( )( )
2
2
2
2
2
1
+
+
−
+
−
∠
=
∠ j
j
d
p
G
( ) 2
2
2 j
j ∠
−
+
−
−∠
=
4
3
4
5
2
4
3 π
π
π
π
=
−
=
−
−
=
4
1
2
2 =
+
=
( )( )
=
⋅
=
=
+
+
−
⋅
+
−
+
+
−
= −
8
2
2
2
2
2
2
4
2
2
1
1
D
P
D
K
z
K
j
j
j
K
( ) s
s
C 2
8+
=
( ) 4
4
3 π
π
π
π =
−
=
∠
− d
p
G
42. 0 0.5 1 1.5 2 2.5 3
0
0.2
0.4
0.6
0.8
1
Step Response
Time (sec)
Amplitude
ts is OK
But Mp too large
To redesign:
Reduce ωd
pd=-2+j1.5
45. Drawbacks of PD
• Not proper : deg of num > deg of den
• High frequency gain → ∞:
• High gain for noise since noise is HF
Saturates circuits
Cannot be implemented physically
as
P D
K K jω ω
+ → ∞ → ∞
Q
∴
46. Lead Controller
• Approximation to PD
• Same usefulness as PD
•
• It contributes a lead angle:
( ) 0
>
>
+
+
= z
p
p
s
z
s
K
s
C
( ) ( )
z
p
p
C d
d +
∠
=
∠
φ
=
( )
p
pd +
∠
−
47. Lead Design:
1. Enter G, Draw R.L. for G
2. Enter specs, draw region for desired c.l.
poles
3. Select pd from region
4. Let
Pick –z somewhere below pd on –Re axis
Let
Select
( )
d
d j
p ω
σ +
−
=
( )
d
p
G
∠
−
= π
φ
( ) φ
φ
φ
φ −
=
+
∠
= 1
2
1 ,
z
pd
( ) 2
s.t. φ
=
+
∠ p
p
p d
( )
2
tan
i.e. φ
ω
σ d
p +
=
C(s) G(s)
48. • There are many choices of z, p
• More neg. (–z) & (–p) → more close to
PD & more sensitive to noise, and
worse steady-state error
• But if –z is > Re(pd), pd may not
dominate
( ) ( )
d
d
d
d
p
d
p
z
d
p p
G
z
p
p
p
p
G
K
⋅
+
+
=
⋅
=
+
+
1
Let
( )
p
s
z
s
K
s
C
+
+
=
:
is
controller
Your
49. Example: Lead Design
MP is fine,
but too slow.
Want: Don’t increase MP
but double the resp. speed
Sol: Original system: C(s) = 1
Since MP is a function of ζ, speed is
proportional to ωn
5
.
0
2
2
,
2 =
=
= ζ
ζω
ω n
n
4
2
2
4
TF
c.l.
+
+
=
s
s
C(s)
)
2
(
4
+
s
s
50.
51. Draw R.L. & desired
region
Pick pd right at the
vertex:
(Could pick pd a little
inside the region
to allow “flex”)
5
.
0
new
want
we
Hence ≥
ζ
4
new ≥
n
ω
3
2
2 j
pd +
−
=
52.
53. Clearly, R.L. does not pass through pd,
nor the desired region.
need PD or Lead to “bend” the R.L.
into region.
(Note our choice may be the easiest to
achieve)
Let’s do Lead:
( ) ( )
2
+
∠
+
∠
+
=
−
= d
d
d p
p
p
G π
π
φ
∴
6
2
3
2 π
π
π
π =
+
+
=
54. Pick –z to the left of pd
4
,
4
Pick =
−
=
− z
z
( )
3
4
1
π
φ =
+
∠
= d
p
6
6
3
then 1
2
π
π
π
φ
φ
φ =
−
=
−
=
( )
2
tan
then φ
ω
σ d
p +
=
8
3
2
2 3
1
=
+
=
( )
7
2
4
1
≈
=
+
⋅
+
+
d
p
d
p
p
d
p
z
d
p
K
( ) 8
4
7 +
+
=
∴ s
s
s
C
55. 0 0.5 1 1.5 2 2.5 3
0
0.2
0.4
0.6
0.8
1
1.2
Step Response
Time (sec)
Amplitude
Speed is doubled, but over shoot is too much.
56. 0 0.5 1 1.5 2 2.5 3
0
0.2
0.4
0.6
0.8
1
1.2
Step Response
Time (sec)
Amplitude
( )
8
4
7
+
+
=
s
s
s
C ( )
10
4
6
+
+
=
s
s
s
C
Change controller from to
To reduce the gain a bit, and make it a little closer to PD
57. Particular choice of z :
( ) ( ) ( )
2
2
2
1
φ
φ
φ +
∠
=
+
∠
=
−
∠
=
−
∠
=
+
∠
= d
d
d
d
d
p
A
Bp
A
p
z
p
z
O
z
p
( )=
+
∠
= p
pd
2
φ
( )
∞
+
∠
=
∠ O
p
O
Ap d
d d
p
∠
=
O
Ap
Bp d
d ∠
bisect
s.t.
B
Choose
A
Bp
OBp d
d ∠
=
∠
∴
O
Apd
∠
= 2
1
d
p
∠
= 2
1
2
2
φ
−
∠
= d
p
58. ( )
1
tan φ
ω
σ d
z +
=
( )
2
tan φ
ω
σ d
p +
=
3
2
2
:
example
prev.
In j
pd +
−
=
3
2
,
2 =
= d
ω
σ
get
we
procedure,
above
Follow
( ) 46
.
5
93
.
2
73
.
4 +
+
= s
s
s
C
359
.
0
,
%
21
:
step
c.l. =
= r
p t
M
repeat.
,
5
.
2
to
2
change =
σ
375
.
0
,
%
1
.
16
:
step
c.l. =
= r
p t
M