Downloaded 196 times
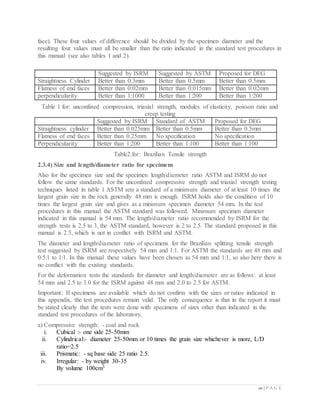
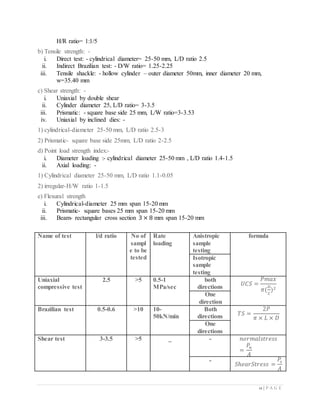
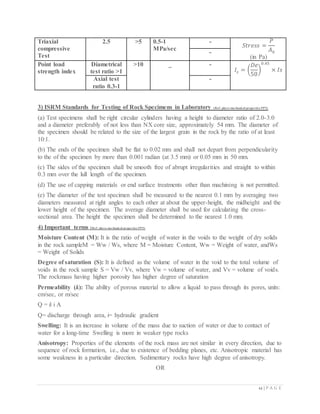


This document provides information on preparing rock samples for laboratory testing. It discusses collecting core samples from the field and storing them properly to avoid contamination. It describes equipment for cutting, grinding, and polishing samples in the laboratory. Standard sizes for core drill bits and criteria for sample straightness, flatness, perpendicularity, and length to diameter ratios are presented. Proper preparation of representative rock samples is important for obtaining accurate test results on rock properties like strength and deformability.