This paper aims to classify grasp types from electromyography (EMG) data using artificial neural networks. EMG data was collected from six grasps and decomposed into intrinsic mode functions using empirical mode decomposition. Seven features were extracted from the frequency and time domains. Various feature subsets were used to train a neural network classifier, with the best results achieved using all features except variance from the EMG data and the first three intrinsic mode functions. The paper seeks to recognize intended grasps from EMG input data using neural networks in order to improve prosthetic control.
![ROB 537 Final Project 2
main contribution is finding the correct model to enhance the
understanding and execution level of EMG signals in
prosthetics controlling areas.
In the above paragraphs, we have looked at the main problem,
the difficulties, possible solutions and contribution to the field.
Using EMG data is based on an signal processing techniques.
In previous work, we find that using Empirical Mode
Decomposition (EMD) can enhance the identification
accuracy or a pattern recognition[4]. In this paper, we further
exploit the use of EMD and extracting the features of EMG
data using Artificial Neural Networks (ANN). Therefore, in
the next paragraphs, more specific information about the
background and some key points in choosing correct data
processing and machine learning algorithm will be discussed
in Section II and III. Then Section IV consists the actual
manner in which the data was processed for this paper, and
finally the machine learning algorithm used. In Section V and
VI, it may analysis the results draw the detailed conclusions.
II. SPECIFICS AND BACKGROUND ABOUT THE
PROBLEM
In this sections we will talk in detail about the things needed
to know to understand the problem being solved. This can be
divided into different sections: understanding how EMG
works, what signal processing is and feature extraction means.
And finally, what is machine learning?
A. What is EMG?
An electromyogram (EMG) measures the electrical activity
of muscles at rest and during contraction. It is the potential
difference between muscles during contraction and expansion
of muscles. When humans do different types of tasks with
their hands, these signals are passed to the hand via neurons
from the brain. Nerve conduction studies measure how well
and how fast the nerves can send electrical signals.
EMG is mainly used in clinical purposes in analyzing the
condition of muscles of the patients. We can measure these
electrical signals and based upon the features of the signals,
like amplitude, we can understand what’s happening in the
muscles. Due to the development in the electronic field EMG
has gained a lot of interest in the recent past. Many
researchers and companies used EMG to control prosthetics
and wearables. Since EMG gives out very small electrical
signal, i.e. micro-millivolts, and since it is also susceptible
very to noise it is quite hard to analyze an EMG signal. This
is where signal processing and feature extraction comes into
play. As data is being used which has already processed,
focus is not being placed on this part very much, even though
this is one of the essential step in EMG analysis.
Fig.1 Raw EMG signal
Most of the time the signals we collect are in raw format
which is basically useless and they cannot be understood.
Signal processing is a technique where mathematical models
are used to extract information from the signals so they can be
analyzed. There are many types of signals and depending upon
the type of signal being dealt with different mathematical
models are used. In this case it is time-series data, which
means the signal changes with respect to time. There are
different types of signal processing techniques such as time
frequency analysis or Hilbert transform to process time
varying data. This can also be helpful in feature extraction.
Feature extraction is one of the main parts of this project.
In this paper, the most efficient technique in transforming
useful information from signals is Empirical Mode
Decomposition (EMD). EMD is a method of breaking down a
signal without leaving the time domain. EMD process is
useful for analyzing natural signals which are most often
nonlinear and non-stationary [14]. The EMD’s functions,
known as Intrinsic Mode Functions (IMF) are sufficient to
describe the signal even they are not necessarily orthogonal.
Therefore, the main process of experiments in this paper is
collecting signals, then through EMD to extract different
features from EMG signal and its functions IMFs. Then, the
output received in this stage is used as input to the learning
algorithm being used. So, it is very important to extract the
features from which the algorithm can learn and be trained
easily.
The next step is choosing the right algorithm which can
predict the output based on the inputs given. There are many
algorithms which can do this, but in this project Artificial
Neural Networks are being focused on. ANN is a part of
machine learning which is mimicked from the human brain. It
has a set of inputs, outputs and many adaptable weights
which are helpful in mapping inputs to outputs. ANN has
different kinds of architects in it, i.e Back-prop, Recursive
ANN, and more [4]. Different kinds of architectures are used
to solve different problems. The kinds of feature extraction
methods and architecture being used in this project in coming
sections will be discussed in great detail.](https://image.slidesharecdn.com/54edc259-e9b5-4a22-899a-f9efa958e114-160217034015/85/rob-537-final-paper-fourth-modify-2-320.jpg)
![ROB 537 Final Project 3
Fig.2 Simple representation of ANN
In this project, data from UCI machine learning repository is
going to be used. This data is collected from the human hand
using surface EMG sensors. There are total of 3 EMG sensors
of which one is used as datum and another two are used to
measure the electrical activity in the muscles. The data is
collected from six subjects (three male and three female) when
they are performing six different daily grasps, i.e pinch,
cylindrical, spherical, tip, palmar, lateral, and hook. Each
grasp is done 30 times for a duration of six seconds.
MATLAB and Python are then going to be used for the feature
extraction and coding the algorithm. The following section
will describe the work already done in this field and how it
can be used to understand and develop ANN’s better.
III. GENERAL APPROACHES AND RELATED WORK
The problem of muscle actuation prediction for control using
EMG signals is not a new one, and has been approached in
many different ways. The problem can also be split into
different sections, each of which can be solved independent of
how the other sections are solved. The first section is data
acquisition. As stated above, the goal here is to record a signal
that most directly represents the myoelectric signal, using
equipment and filters to remove as much of the noise as
possible. Noise from various sources, such as 50/60 Hz
electromagnetic induction from power lines, can greatly affect
the signal, mainly due to the small amplitude of the EMG
signal (micro-millivolts) [4]. Additionally, the signal has to
travel through the tissue and skin, adding opportunity for noise
and cross contamination between signals to be introduced. To
attempt to mitigate this, the skin should be thoroughly cleaned
before the sensors are applied, and the sensors should be
placed in precise orientation to each other to maintain
consistency.
Fig.3 EMG sensors and example of where they may be
placed on the forearm
The signal can then be amplified and filtered, using a bandpass
filter to remove low and high frequency noise, and the data
collected.
The second challenge is processing the data, and converting it
into a form that can be used for machine learning. This
process usually entails additional filtering or utilization of
transforms, and the choice of how to process the data will be
dictated by the machine learning algorithm used in the next
step, due to the fact that the output of this step will be used as
the input to the algorithm. There are many methods to process
the data, two in particular will be described. First, the data can
be processed as a time series, or second, specific features can
be collected from the data.
One way to perform time series analysis is using the
autoregressive model [4]. This model predicts that the next
value in a time series ŷ[n] is linearly dependent on its previous
outputs (y[n-1], y[n-2],...) and some unpredictable term. The
equation for this model is below, where ŷ(n) is the estimated
signal in a discrete time n, am are the AR-coefficients, e(n) is
the estimation error, and Mis the order of the model.
ŷ(n) = ∑ 𝑎𝑎 𝑚𝑚 (𝑛𝑛)𝑦𝑦(𝑛𝑛 − 𝑚𝑚) + 𝑒𝑒(𝑛𝑛)𝑀𝑀
𝑚𝑚=1 (1)
Fitting the signal to this model requires solving for the weights
defined in the autoregressive model using an optimization
algorithm such as least mean square. These weights defining
the equation for each signal using the autoregressive model are
then used as the inputs for the learning algorithm.
Specific features from the time series may also be found, and
those may be used as the inputs to the learning algorithm. One
method to find the features was performed by Sapsanis,
Georgoulas, and Tzes, using Empirical Mode Decomposition
(EMD) and a set of features calculated using various metrics
from the decomposed signal. EMD decomposes a signal into a
collection of intrinsic mode functions (IMF), which allow for
the calculation of certain features, such as Integrated
Electromyogram (IEMG), zero-crossing, Slope Sign Changes,
waveform length, Willison amplitude, variance, skewness and
kurtosis [3]. These features are then used as the inputs to the
learning algorithm.
The final part of the process, and the topic of greatest interest,
is the learning algorithm. Learning algorithms receive data,
learn from it, and attempt to make predictions based on that
data. Machine learning can be classified into two large camps,
supervised learning and unsupervised learning, with
combinations and offshoots as well. Supervised learning uses
a set of inputs and outputs, processed through an algorithm, to
try to predict new outputs based on new inputs of the same
process. Unsupervised learning (clustering, dimensionality
reduction, recommender systems, self organizing learning) has
no initial set of outputs mapped to learn from, and therefore
has no feedback from the environment [2]. Between
supervised and unsupervised learning are other machine
learning methods, such as semi-supervised learning, which
creates both labeled and unlabeled examples, and
reinforcement learning, where the learning algorithm receives](https://image.slidesharecdn.com/54edc259-e9b5-4a22-899a-f9efa958e114-160217034015/85/rob-537-final-paper-fourth-modify-3-320.jpg)
![ROB 537 Final Project 4
feedback from its environment to improve the accuracy of its
response.
There are many types of machine learning algorithms that
have been used for training EMG signals for prosthetic
control. One method is fuzzy logic. Fuzzy logic is similar to
boolean algebra or probabilistic models. It is based on the idea
that human thought processes are often imprecise and
uncertain, and they aim to mimic that process. Whereas a
traditional set would contain members that were of that set or
not at all, fuzzy systems allow members to have a “degree of
membership” to the set [2]. This may allow for greater
flexibility and accuracy when modeling real world systems.
Various other probabilistic model algorithms have also been
used for machine learning. These models include Bayesian
networks, Linear Discriminant Analysis, Gaussian Mixture
Model, and Support Vector Machines [2].
Another machine learning method to extract patterns and
predict trends is Artificial Neural Networks (ANN). ANN is
an information processing system that draws its inspiration
from the human brain. It uses a series of interconnected
parallel processing units, called neurons,that connect the
inputs to the outputs, and use interneuron connection weights
to store knowledge and predict the correct output based on the
inputs. The network is trained by introducing a data set to the
network with known inputs and outputs, and training it, by
adjusting the weights between the neurons, to map the given
inputs to the correct outputs. Advantages of ANN include
adaptiveness, real time operation, and fault tolerance [2].
Additionally, hybrid algorithms of the aforementioned
methods, and other methods, may be used. These hybrid
methods include Adaptive Neuro-Fuzzy Inference System, and
Fuzzy Clustering Neural Network [2].
In previous literature, there have been various algorithms used
to attempt to apply machine learning to EMG prosthetic
control. Soares, Dandrade, Lamounier and Carrijo used an
autoregressive model and a backpropagation neural network
algorithm to attempt to classify EMG signals in real time,
however, they did not perform this classification for various
specific grasps. Neural networks has been a popular method
for control using EMG data. On the other hand, Sapsanis,
Georgoulas, and Tzes used feature extraction methods using
various transforms to find unique features for various graphs
to classify them. Other modifications of various learning
algorithms have also been used, such as a modification to
fuzzy ARTMAP networks[5] and support vector machines [1].
IV. METHODS
As seen in the previous section, two common methods for
classification of EMG data is autoregressive model with a
neural network [2], or feature extraction and decomposition to
allow a linear classifier to be used [3]. The following method
uses feature extraction, but instead of decomposing to allow
the use of linear classification, the features are used to train an
ANN for use in classification.
A. Description of set experiments:
In this paper, data from EMG sensors are used as the input,
features are extracted from the data by decomposing into
Intrinsic Mode Functions (IMF) and extracting features in the
time and frequency domain, and then this data will be
classified in an Artificial Neural Network (ANN). In order to
improve the learning ability of the ANN, one of the variables
is the number of hidden layers which can guarantee to process
the data. Each person has his unique muscles activities, and
the input data is different. In this paper, different inputs are set
as an important variable to extract the output data which is a
main standard which evaluating the performance of algorithm.
The following part is a brief description of signal processing
and feature extraction and then analysis using ANN.
Fig.4 A Simple diagram showing the key elements of the
project.
B. Signal Processing and Feature Extraction:
In the background section this paper described previously
what signal processing means. In simple words, signal
processing is the technique where useful information is
extracted from the signal. EMG signals are non-stationary
signals and extracting useful information from it is very
complicated. There are a few techniques like fourier
transforms which help in getting useful information from the
signals. But these techniques are not very efficient when
compared to EMD. If the signals are considered a combination
of fast oscillating and slow oscillating signals EMD attempts
to differentiate the signal into fast and slow oscillating](https://image.slidesharecdn.com/54edc259-e9b5-4a22-899a-f9efa958e114-160217034015/85/rob-537-final-paper-fourth-modify-4-320.jpg)
![ROB 537 Final Project 5
components called Intrinsic Mode Functions (IMF). This IMF
represents a simple oscillatory function satisfying two
conditions:
1. The number of zero crossings and the number of
local extrema are either equal or differ by one.
2. The local average (defined by average of local
maximum and local minimum envelops) is equal to
zero
If we consider a signal x(t), the EMD algorithms can be
summarized as follows:
1. Find all local minima and local maxima of given
signal x(t). Create an upper emax(t) and a lower emin(t)
envelope interpolating between successive local
maxima and local minima respectively.
2. Calculate the running mean:
m(t)=
1
2
[emin(t)+e max (t)] (2)
3. Subtract the mean from the signal to extract the detail
d(t) = x(t) - m(t) (3)
4.
5. Repeat the whole process replacing x(t) with m(t)
until the final residual is a monotonic function
So, the original signal is eventually decomposed into a sum of
IMFs plus a residual term:
x(t)=∑IMF(t) +r(t) (4)
Fig.5 Raw EMG signal and IMFs of lateral grip.
Fig. 6 Residual term of EMG signal of lateral grip
Once we are done processing the raw EMG signal we will
extract different features from the raw EMG signal and IMFs.
The feature extraction stage is always executed when different
kinds of bio-signals are used. It gives out the relevant
information and also alleviates the problem with high
dimensionality. Features should be select in such a way that
they give out a good classification rate. Most of the
researchers used the following features to classify bio-
signals[3].
These features are also being used in this paper.
1. Integrated Electromyogram(IEMG)
This feature is an average value of the absolute values of
the EMG. It is defined as follows:
IEMG=
1
𝑁𝑁
∑xk (5)
Where xk is the kth sample data out of N samples of EMG
raw data
2. Slope Sign Change (SSC):
SSC counts the number of times the slope of the signal
changes sign. Given three contiguous EMG signals xk-1, xk and
xk+1 the number of slope sign changes can be calculated by
SSC = ∑f(x) where:
f(x) = 1 if xk < xk+1 and xk < xk-1
or xk > xk+1 and xk > xk-1
f(x) = 0 otherwise
3. Variance(VAR):
VAR is a measure of the power density of the EMG signal
and it is given by:
VAR =
1
1−𝑁𝑁
∑(xk -µ)2
(6)
4. Zero Crossing(ZC):
ZC counts the number of times that the signal crosses zero.
A threshold needs to be introduced to reduce the noise induced
at zero crossing. Given two contiguous EMG signals xkand
xk+1, then ZC can be calculated as: ZC = ∑f(x) where
f(x) = 1 if xk >0 and xk+1<0
or xk <0 and xk+1 >0
f(x) = 0 otherwise
5. Wavefrom Length(WL):
WL is a cumulative variation of the EMG that can indicate the
degree of variation about the EMG signal. It is given by
WL = (|xk+1-xk|) (7)
6. Kurtosis:](https://image.slidesharecdn.com/54edc259-e9b5-4a22-899a-f9efa958e114-160217034015/85/rob-537-final-paper-fourth-modify-5-320.jpg)
![ROB 537 Final Project 6
The kurtosis of a distribution is defined as:
𝑘𝑘 =
𝐸𝐸(𝑥𝑥−µ)4
σ4 (8)
7. Skewness:
The skewness of a distribution is defined as
𝑠𝑠 =
𝐸𝐸(𝑥𝑥−µ)3
𝜎𝜎3 (9)
Where is the mean of x, is the standard deviation of x, and E(t)
represents the expected value of the quantity t.
C. Processing of Extracted Features Using ANN:
As stated in the above section, 7 features were extracted from
each EMG signal, and 7 features were also extracted from 6
IMFs of each signal. Since there were 2 channels for each
grasp, this leads to 98 total features that may be used to
attempt to classify a grasp. These inputs were then be broken
up into subsets in two different ways. First, by number of
IMFs. First, the features from only the EMG signal were used
as input, then features from 1 additional IMF were added at a
time until all features from EMG and all IMFs were being
used as inputs, and the quality of classification was observed
and compared. Then the features were varied. Subsets of
features were used for input to the ANN, and the resulting
classification quality was observed and compared.
The ANN used was a feedforward ANN with one hidden
layer. The number of inputs were varied to match the number
of features being used for classification, and there were six
outputs, one for each grasp. The number of hidden units used
was based on the number of inputs, and was equal to the
average of the number of inputs and outputs. There are many
methods, or rules-of-thumb, on choosing the number of hidden
units. The rule chosen here was based on trial and error, and a
suggested starting point of between the size of the input layer
and output layer by Jeff Heaton in Introduction to Neural
Networks for Java, 2nd Edition [12]. The training method used
was scaled conjugate gradient (SCG) backpropagation, using
performance evaluation based on cross entropy. SCG is part of
the class of Conjugate Gradient Methods, and, on most
problems, shows super-linear convergence[7]. Unlike gradient
descent, which attempts to minimize a global error function
simply using the direction of the gradient, SCG denotes a
quadratic approximation to the error E in the neighborhood of
a point w by:
E'qw = E(w) +E'(w)T
y +
1
2
yT
E"(w)y (10)
To determine the minimum of this equation the critical points
must be found [8]. They can be found by solving the below
linear system [7].
E'qw(y) = E"(w)y + E'(w) = 0 (11)
SCG was used due to its effectiveness and speed relative to
other typically methods, such as standard backpropagation [7].
Cross entropy is an alternative approach to mean square error
(MSE) [13]. In the MSE function:
Em =
1
𝑚𝑚
∑ (𝑡𝑡𝑘𝑘 − 𝑦𝑦𝑘𝑘)𝑚𝑚
𝑘𝑘=1
2
(12)
Where Em is the total error, t is the target, and y is the output
of the ANN. This is then minimized to improve the ANNs
performance. Alternatively, the following cross entropy error
function can be minimized:
Em =
1
𝑚𝑚
∑ (𝑡𝑡𝑘𝑘 𝑙𝑙𝑙𝑙 𝑦𝑦𝑘𝑘 + (1 − 𝑡𝑡𝑘𝑘)𝑙𝑙𝑙𝑙(1 − 𝑦𝑦𝑘𝑘))𝑚𝑚
𝑘𝑘=1 (13)
When using cross entropy error function, the partial derivative
of Em with respect to the weight wjk is found:
∂Em
∂w
=σ(yk − tk) ∗ zj (14)
Therefore, when minimizing the error signal, the entropy
function has a better network performance with a shorter
stagnation period[13]. Since cross entropy is proven to
accelerate the backpropagation algorithm and to provide good
overall network performance, it was chosen for this paper.
The ANN classification network was created using the built in
patternnet function in Mathworks’ Matlab, with the training
function set to scaled conjugate gradient backpropagation,
and the performance function set to cross entropy. The input
data to the network was split into three categories. 70% of the
data was used to train the network, by computing the gradient
and updating the network weights and biases. 15% of the data
was used to validate the training, by applying the weights
found by the training set and the training function and
measuring the performance. Finally, 15% was used as testing
data, which is solely used for monitoring, and comparing
methods if desired.
Matlab’s Neural Network Training method for classification
and the above training and performance inputs have the
following possible stopping criteria. First, Epoch. The
maximum number of iterations was set to 1000.Second,
performance, which is based on cross entropy, and will stop
the algorithm when the system reaches a certain entropy. This
condition was set to 0. Third,the gradient. This was set to 10-6
.
Finally, validation checks, which measure how many times in
a row the validation set of data is not improving in
performance. If the validation set is not improving for more
iterations than this number, the algorithm stops. This was set
to 10. These stopping conditions were picked after trial and
error. It was found that the first stopping condition met was
typically the validation checks, which is beneficial because the
validation data typically begins to show worse performance
when the training is starting to fit the noise in the system, and
this is a good place to stop the training. A validation check of
10 consistently stopped the training when it began to fit the
noise in the system.
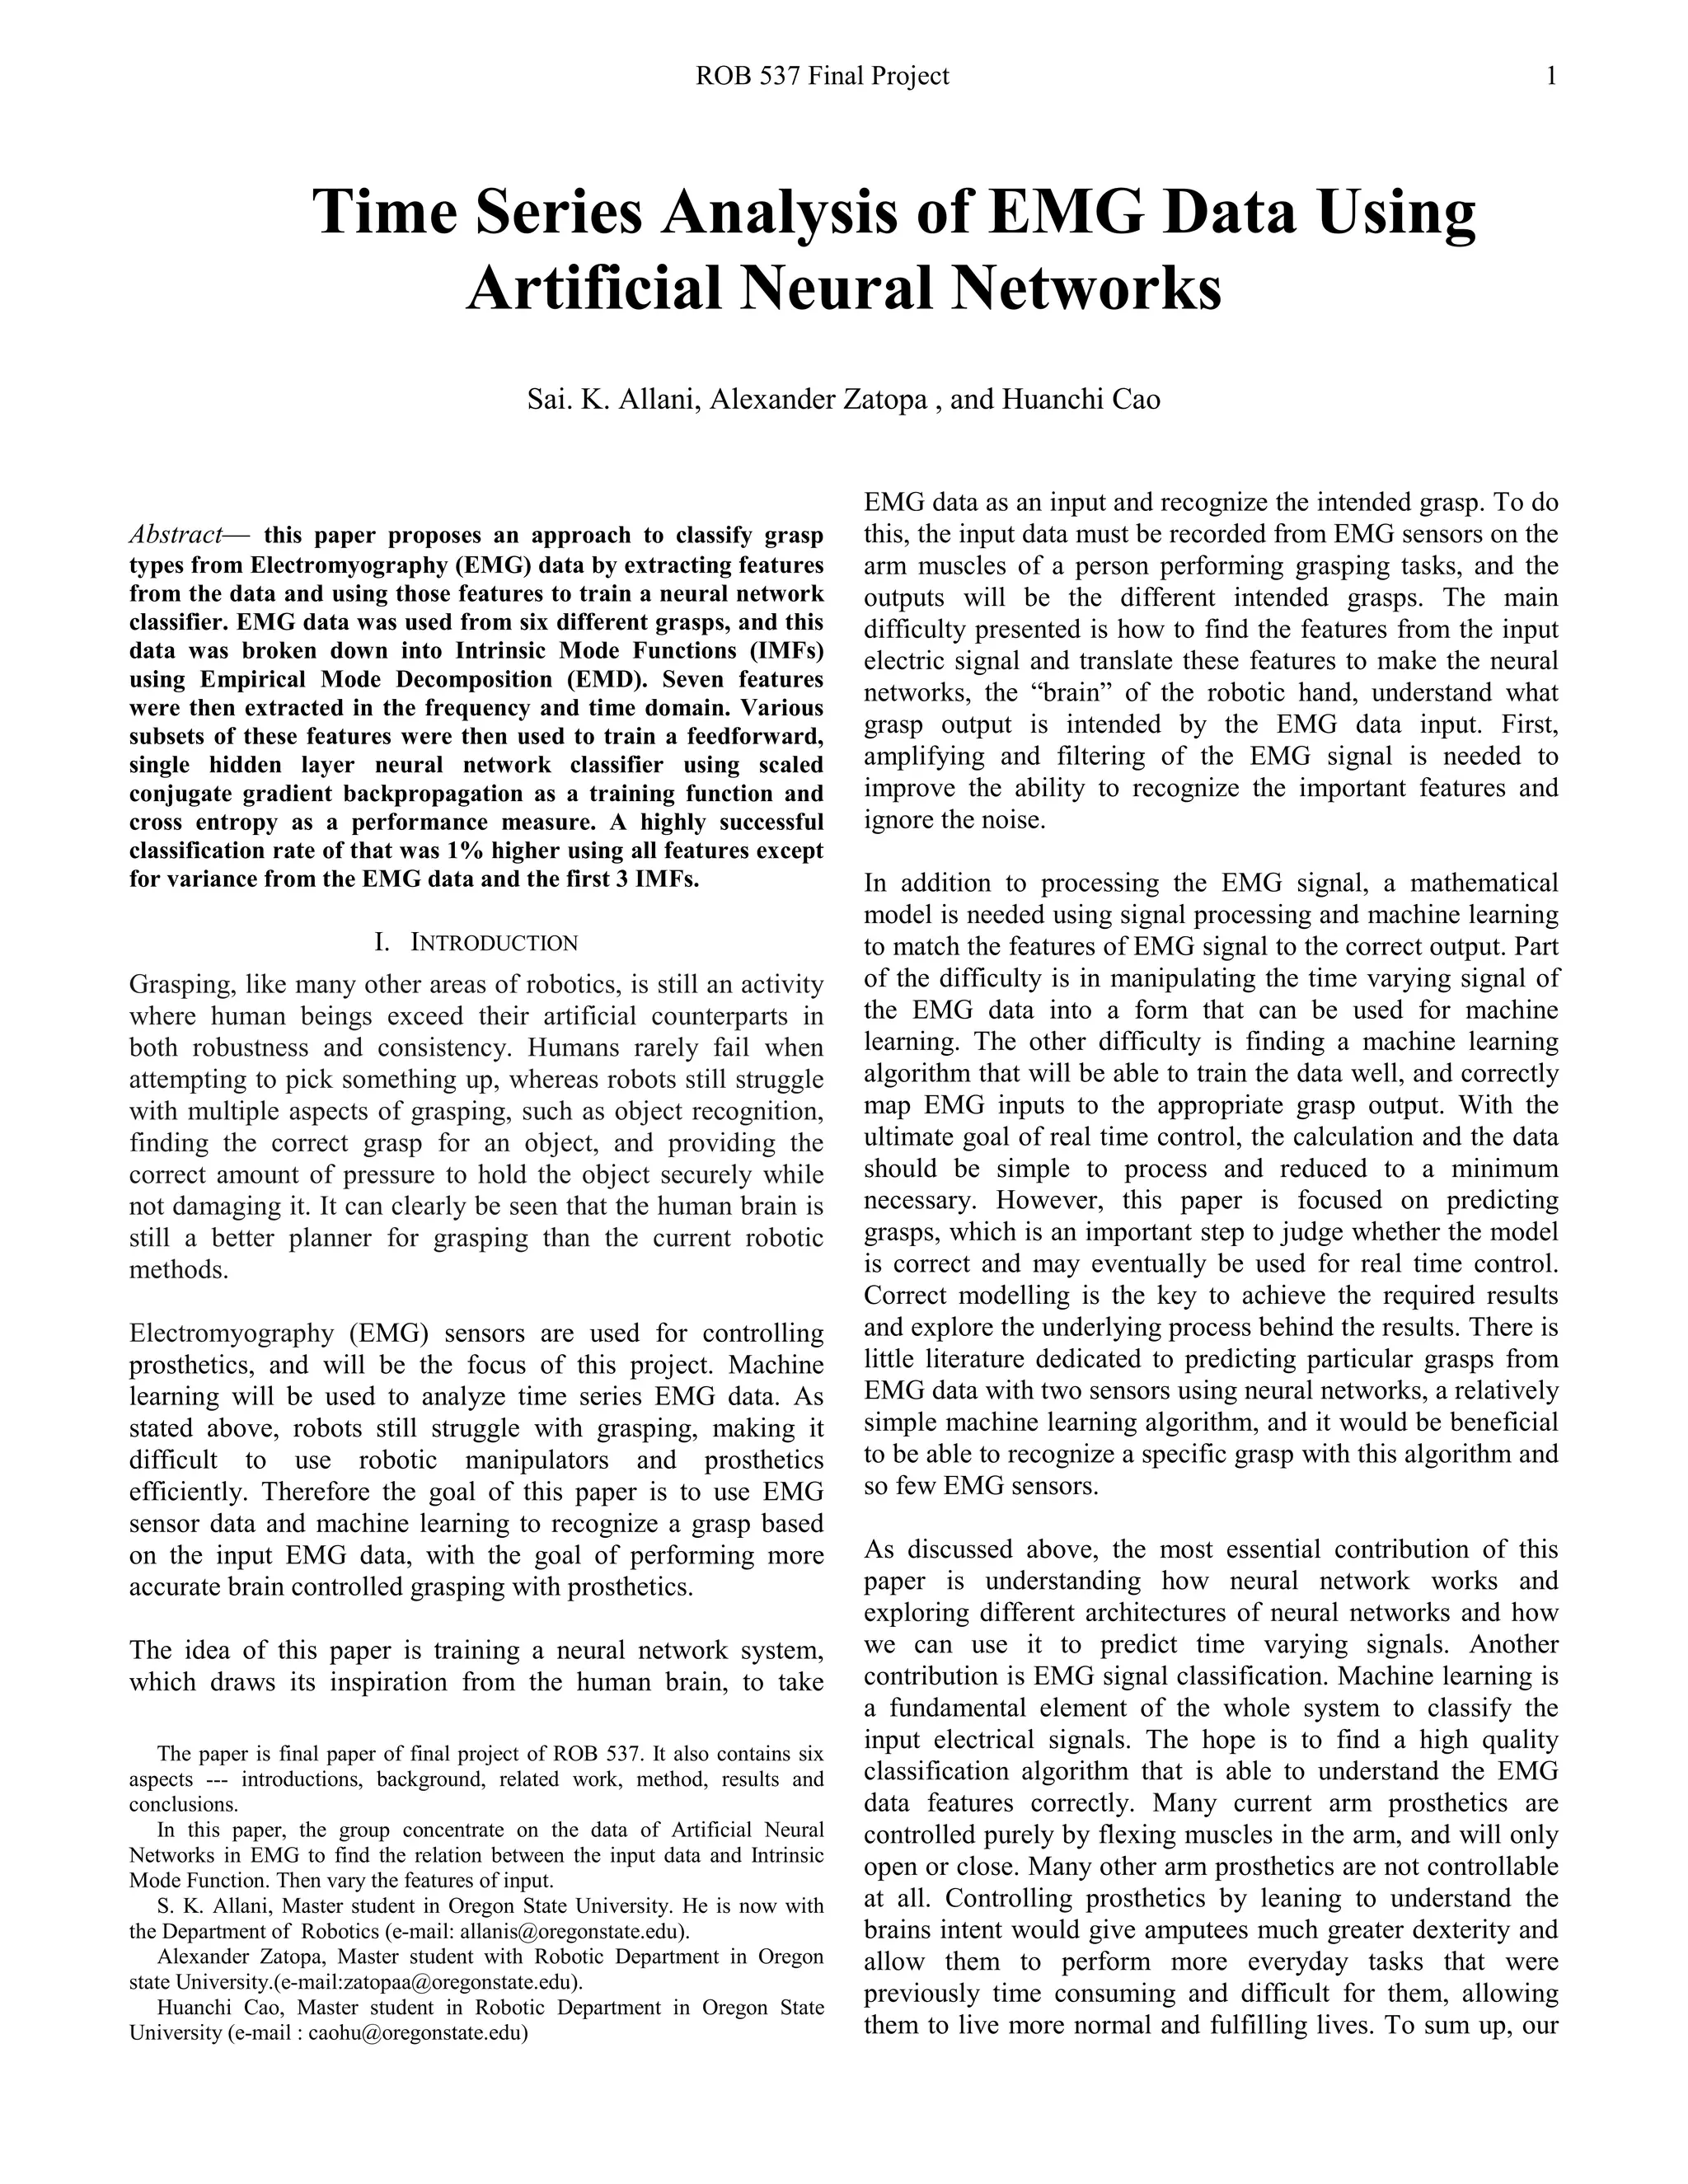
D. Varying the Number of IMFs Input into the ANN:
For the first set of tests, the number of IMFs used as input
was varied. The full input data set included 14 features from](https://image.slidesharecdn.com/54edc259-e9b5-4a22-899a-f9efa958e114-160217034015/85/rob-537-final-paper-fourth-modify-6-320.jpg)
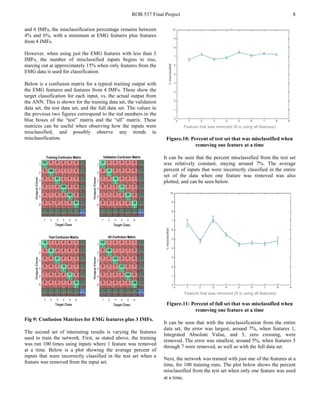
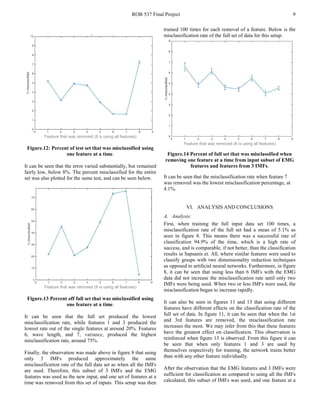
![ROB 537 Final Project 10
time was removed, producing figure 14. It can be seen that,
when only 3 IMFs are used and feature 7 is removed, the
misclassification rate is 4.1%, which is 1% lower than when
all the IMFs and features are used. Therefore, the
classification rate can be increased to 95.1% when all features
but 7 is used from the first 3 IMFs and the EMG.
B. Discussions and Conclusions:
In this work grasps were classified using data from two EMG
sensors. The classification was performed by finding seven
features from the EMG data and 6 IMFs, and inputting these
features into a neural network for classification. The
classification rate using features from the EMG data and the 6
IMFs was 94.9%. It was also found that feature 1, Integrated
Absolute Value, and feature 3, zero crossing, had the greatest
effect on classification. Finally, when all features but feature
7, variance, was used from the EMG data and 3 IMFs as input
to the network, the classification rate increased to 95.9%. In
the future, more analysis can be done on different
combinations of IMFs and features that may produce better
classification. More analysis may also be done into which
grasps were mistaken for other grasps, and see if there is a
trend in misclassification, and use this knowledge to increase
quality of training for those particular misclassifications.
Additionally, this training method may be applied to more
EMG data from different grasps, to test its robustness after
training on a relatively small set.
REFERENCES
[1] Bitzer, S.; van der Smagt, P., "Learning EMG control of a robotic hand:
towards active prostheses," in Robotics and Automation, 2006. ICRA
2006. Proceedings 2006 IEEE International Conference on , vol., no.,
pp.2819-2823, 15-19 May 2006 doi: 10.1109/ROBOT.2006.1642128
[2] Karlık B. Machine Learning Algorithms for Characterization of EMG
Signals. International Journal of Information and Electronics
Engineering IJIEE. 2014;4(3).
[3] Sapsanis C, Georgoulas G, Tzes A. EMG based classification of basic
hand movements based on time-frequency features. 21st Mediterranean
Conference on Control and Automation. 2013.
[4] Soares A, Andrade A, Lamounier E, Carrijo R. The Development of a
Virtual Myoelectric Prosthesis Controlled by an EMG Pattern
Recognition System Based on Neural Networks. Journal of Intelligent
Information Systems. 2003;21(2): 127–141.
[5] Vuskovic M, Du S. Classification of prehensile EMG patterns with
simplified fuzzy ARTMAP networks. Proceedings of the 2002
International Joint Conference on Neural Networks. IJCNN'02 (Cat.
No.02CH37290). 2002.
[6] P. F. Bach, “Myoelectric signal features for upper limb prostheses,”
no. June, 2009.
[7] M. Møller, “A scaled conjugate gradient algorithm for fast supervised
learning,” Neural networks, vol. 6. pp. 525–533, 1993.
[8] J.Orozco and C. a R. García, “Detecting Pathologies from Infant Cry
Applying Scaled Conjugate Gradient Neural Networks,” Eur. Symp.
Artif. Neural Networks, Bruges, no. April, pp. 349–354, 2003.
[9] M. B. I. Reaz, M. S. Hussain, and F. Mohd-Yasin, “Techniques of EMG
signal analysis: detection, processing, classification and applications,”
Biol. Proced. Online, vol. 8, no. 1, pp. 11–35, 2006.
[10] N. a Shrirao, N. P. Reddy, and D. R. Kosuri, “Neural network
committees for finger joint angle estimation from surface EMG
signals.,” Biomed. Eng. Online, vol. 8, p. 2, 2009.
[11] G. P. Zhang, “Neural networks for classification: a survey,” IEEE Trans.
Syst. Man Cybern. Part C (Applications Rev., vol. 30, no. 4, pp. 451–
462, 2000.
[12] Jeff Heaton, Introduction to Neural Networks for Java, 2nd Edition,
Heaton Research, Inc., 2008
[13] G.E. Nasr, E.A. Badr and C. Joun , “Cross Entropy Error Function in
Neural Networks: Forecasting Gasoline Demand” in FLAIRS-02
Proceedings. Copyright © 2002, AAAI.
[14] K.T. Coughlin and K.K. Tung, “11-year solar cycle in the stratosphere
extracted by the empirical mode decomposition method,” Adv. Space
Res., Nov. 2002 (submitted).](https://image.slidesharecdn.com/54edc259-e9b5-4a22-899a-f9efa958e114-160217034015/85/rob-537-final-paper-fourth-modify-10-320.jpg)