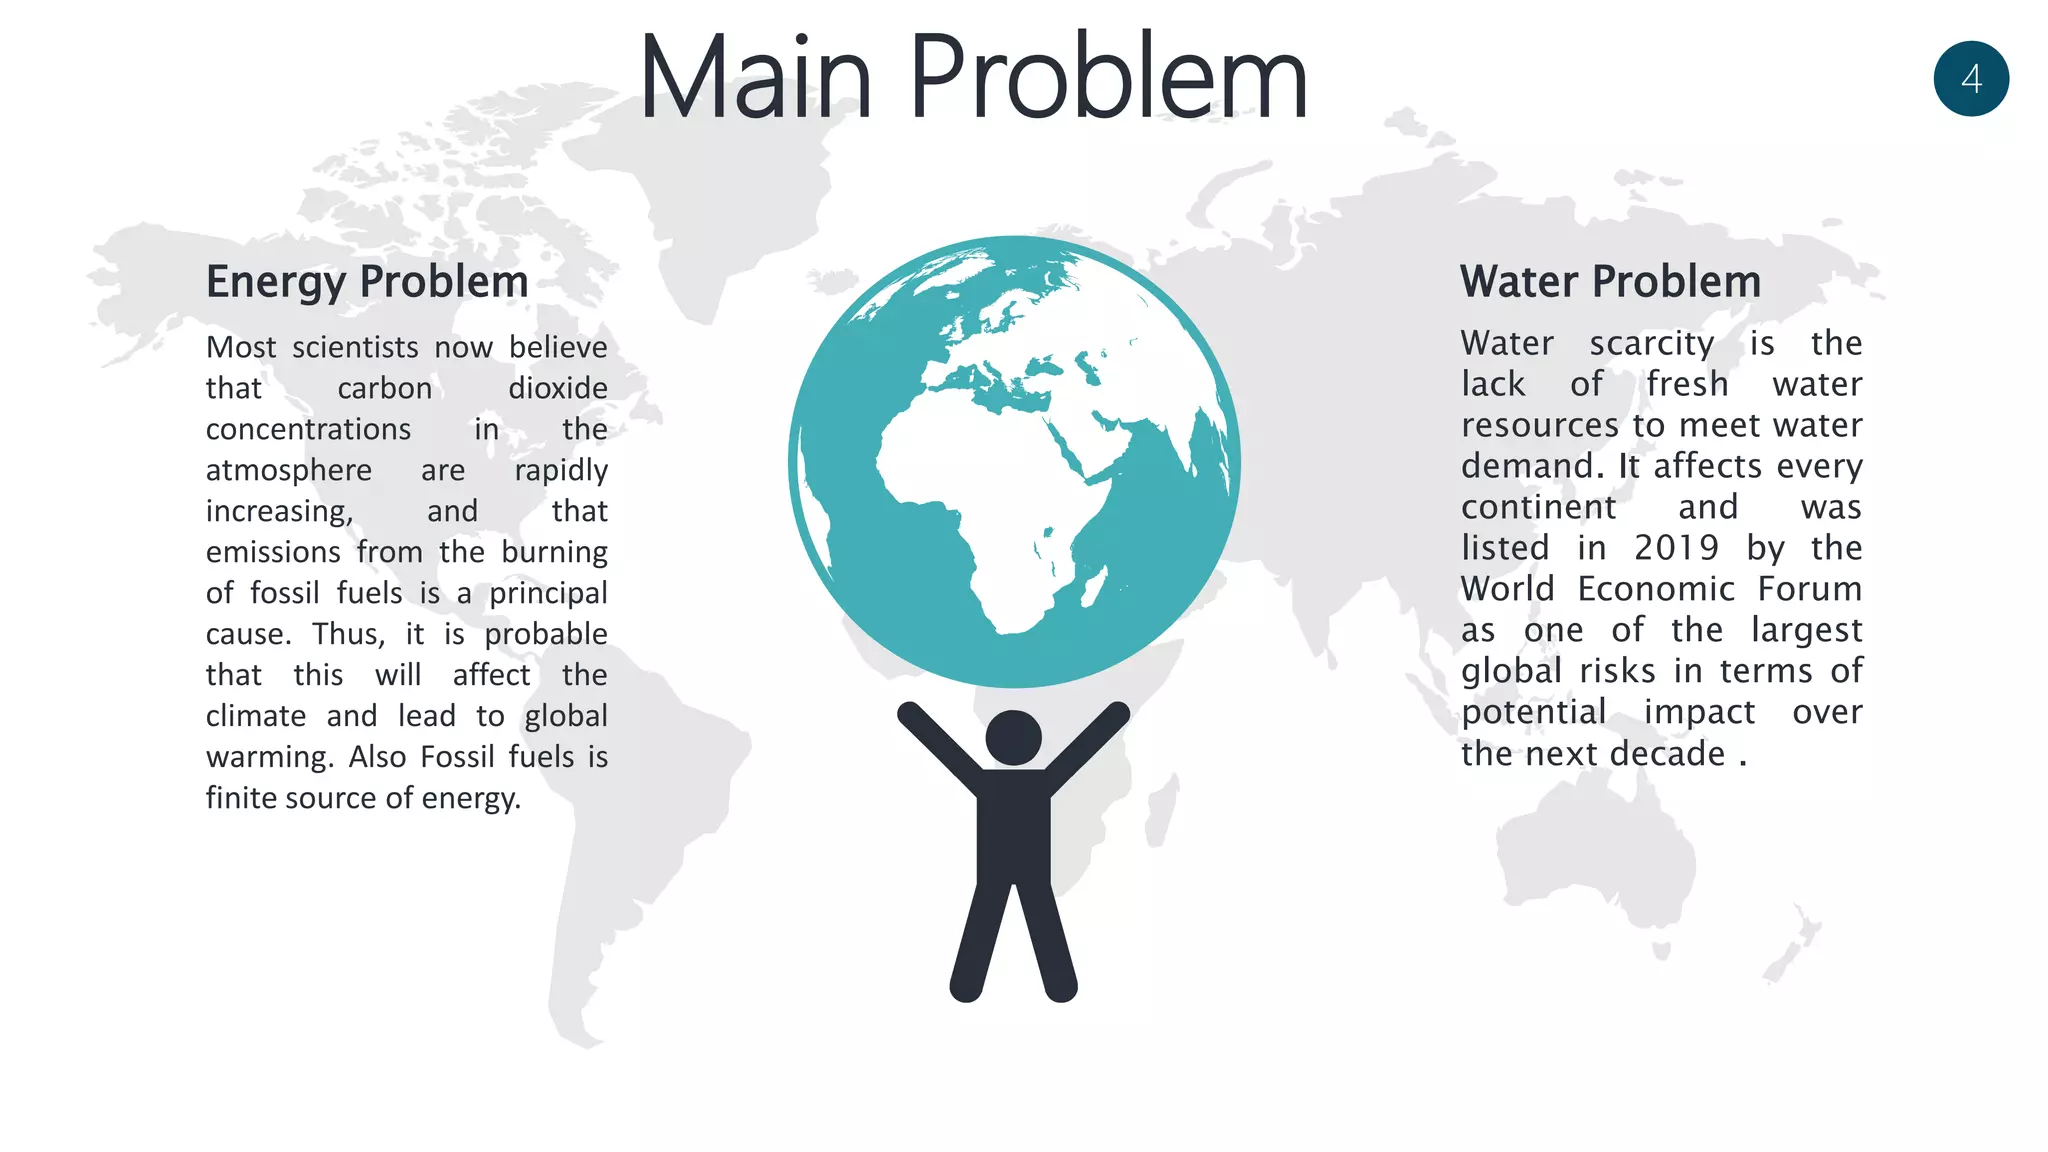
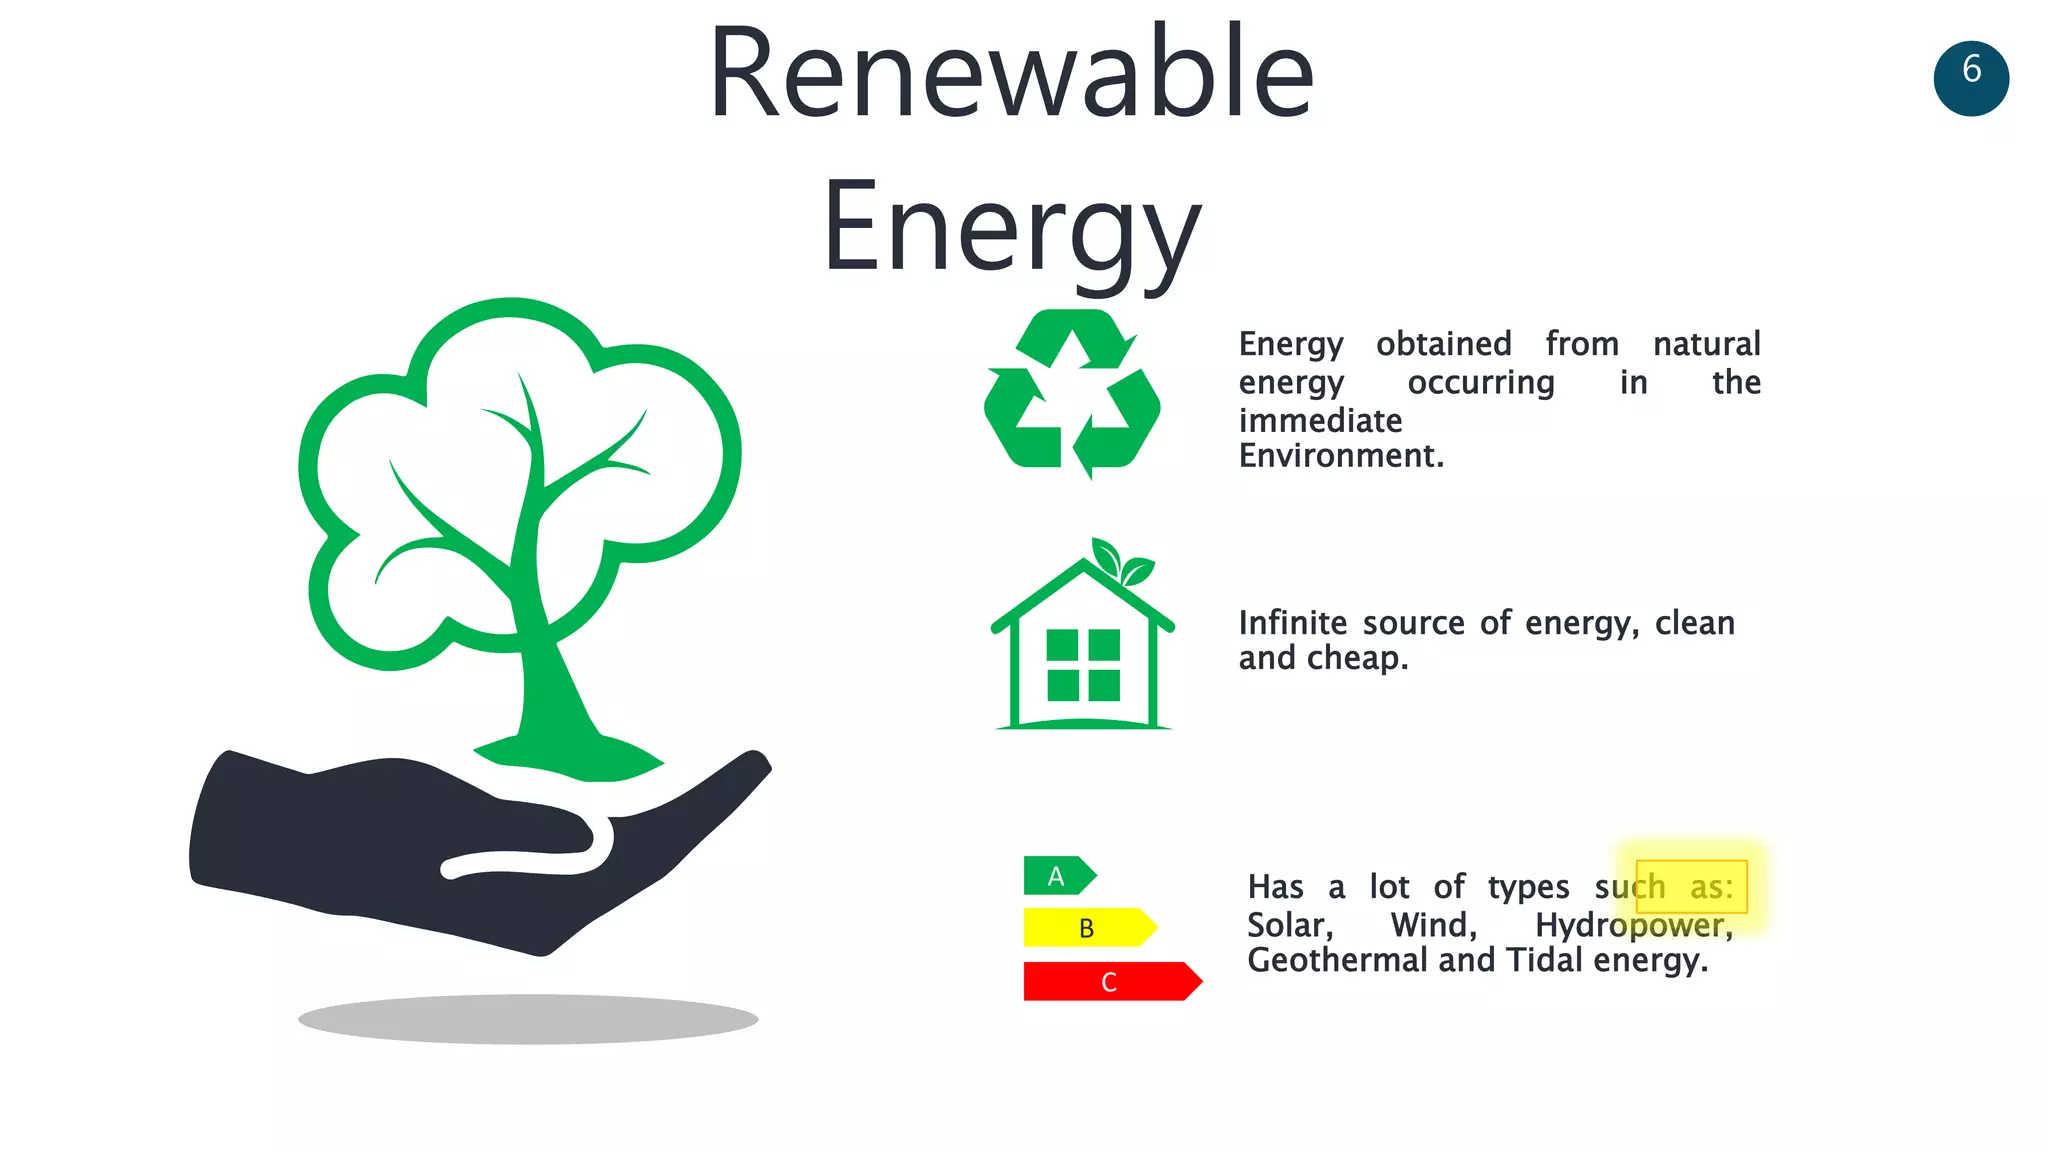
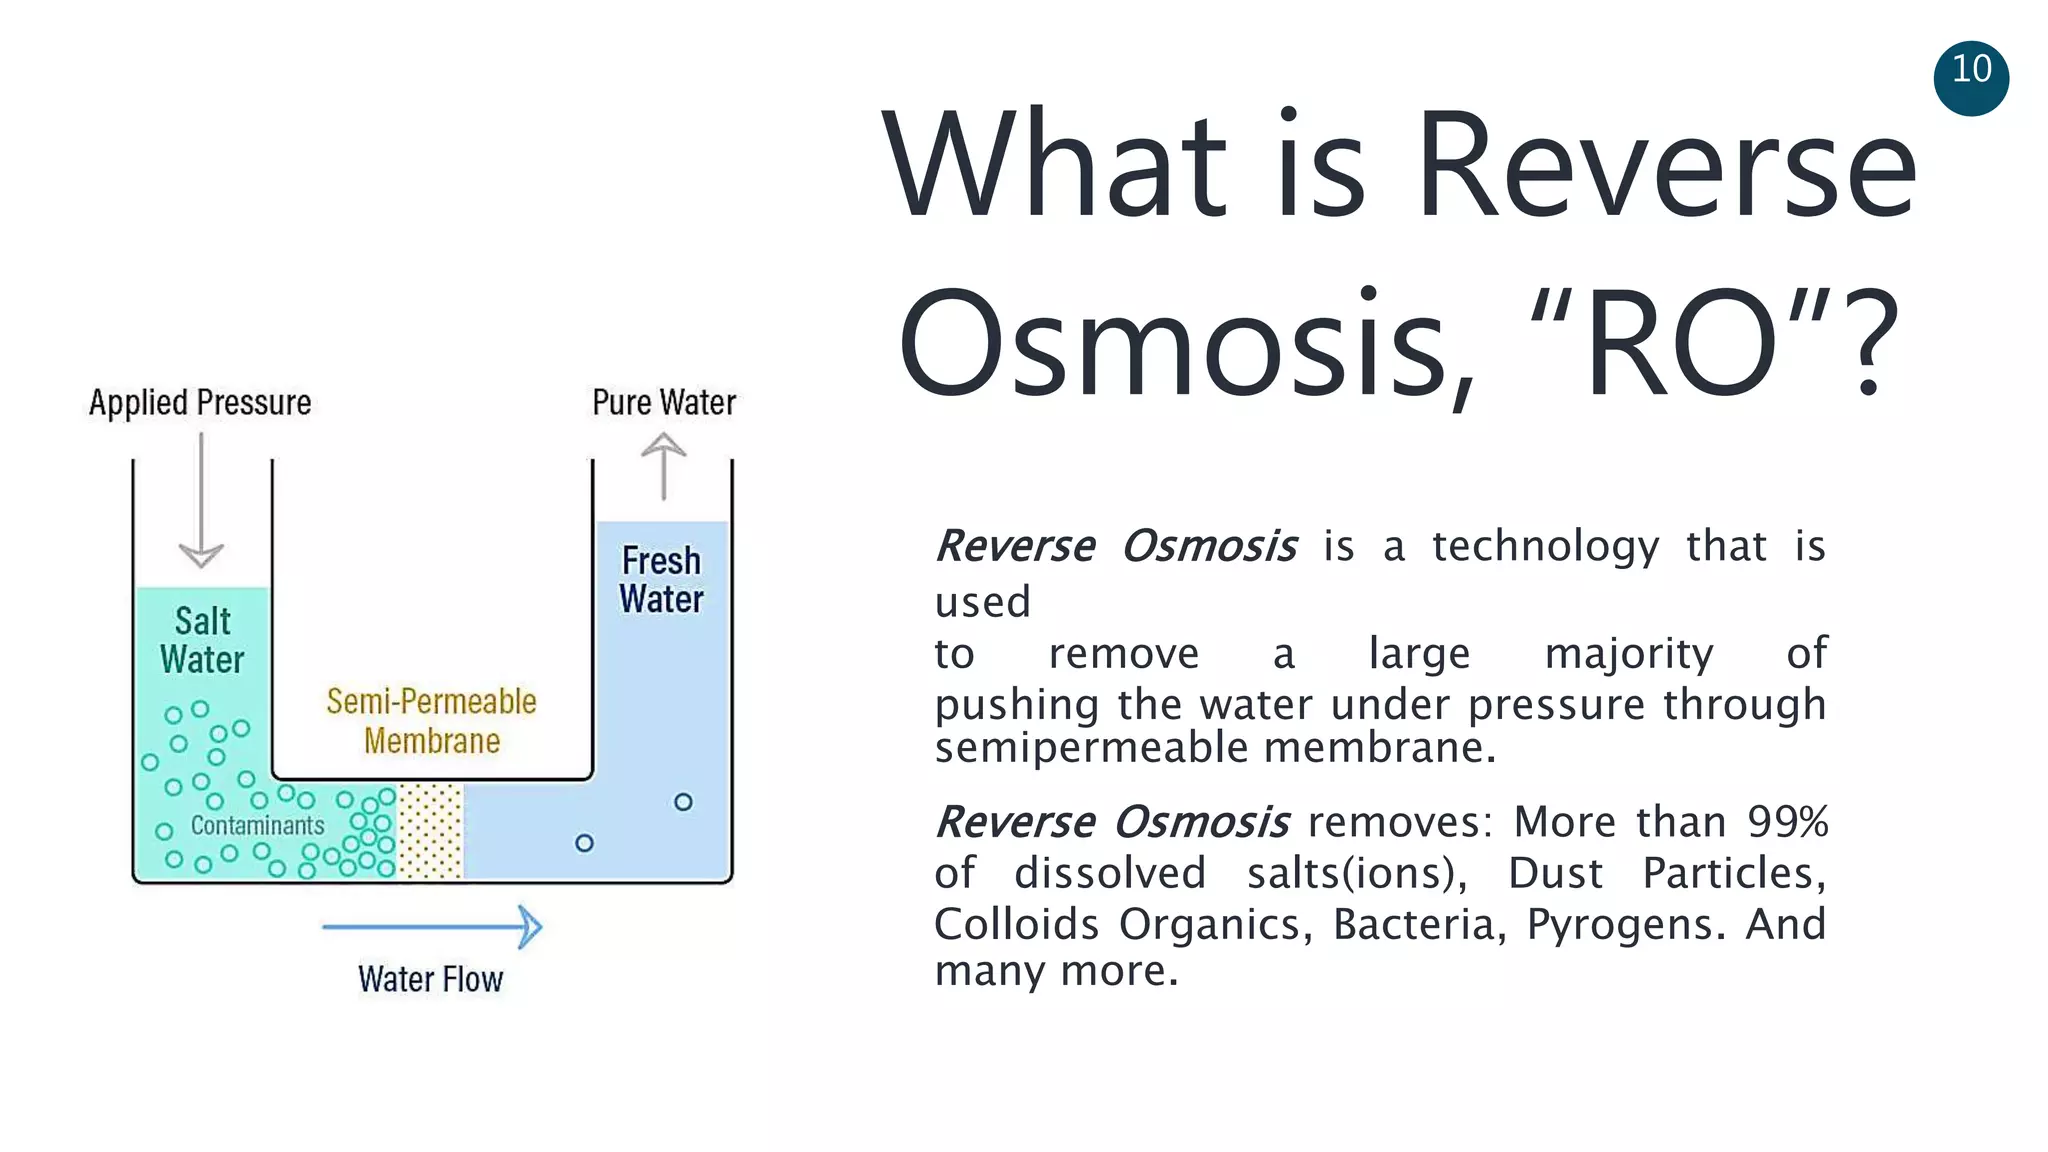
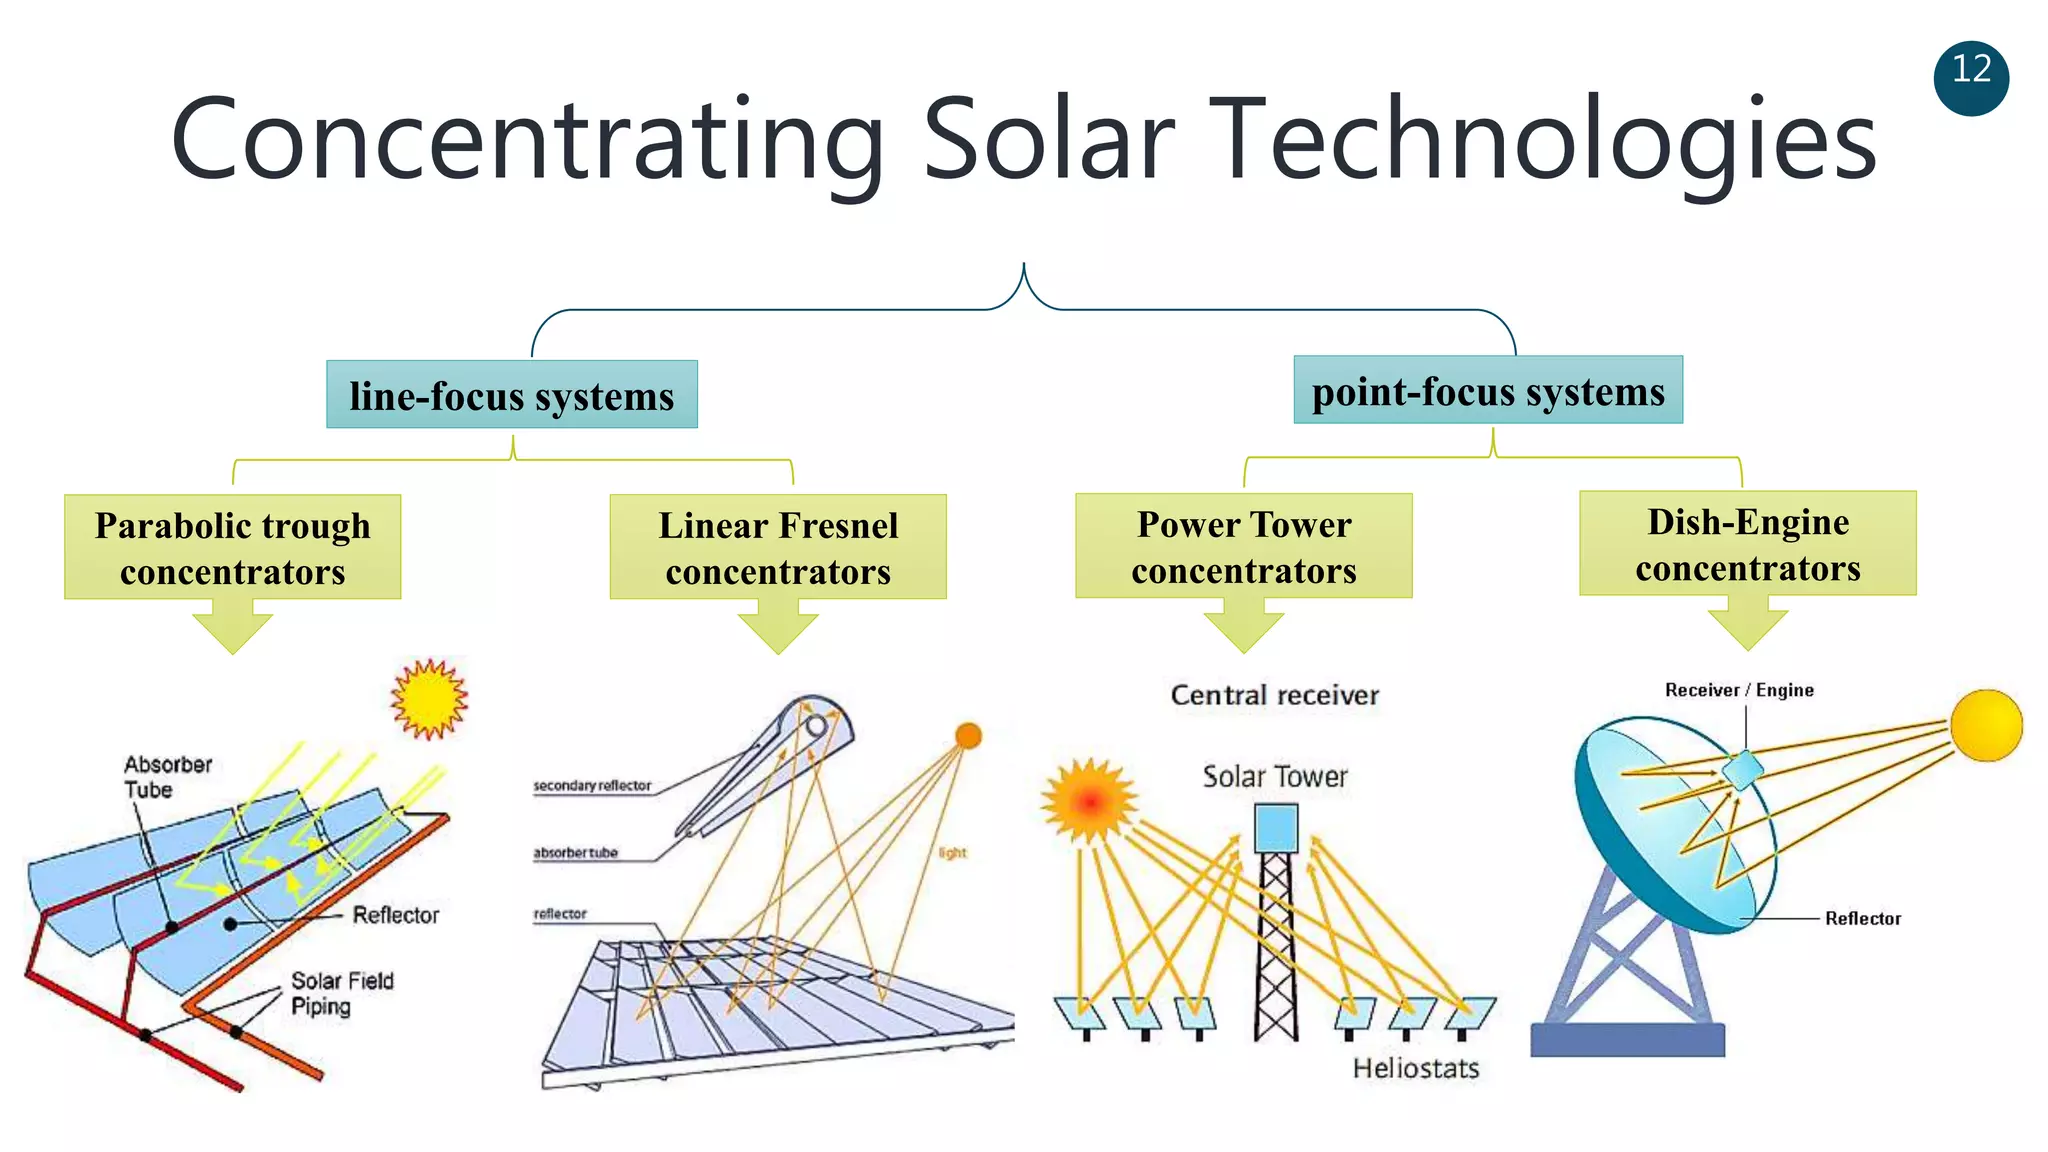
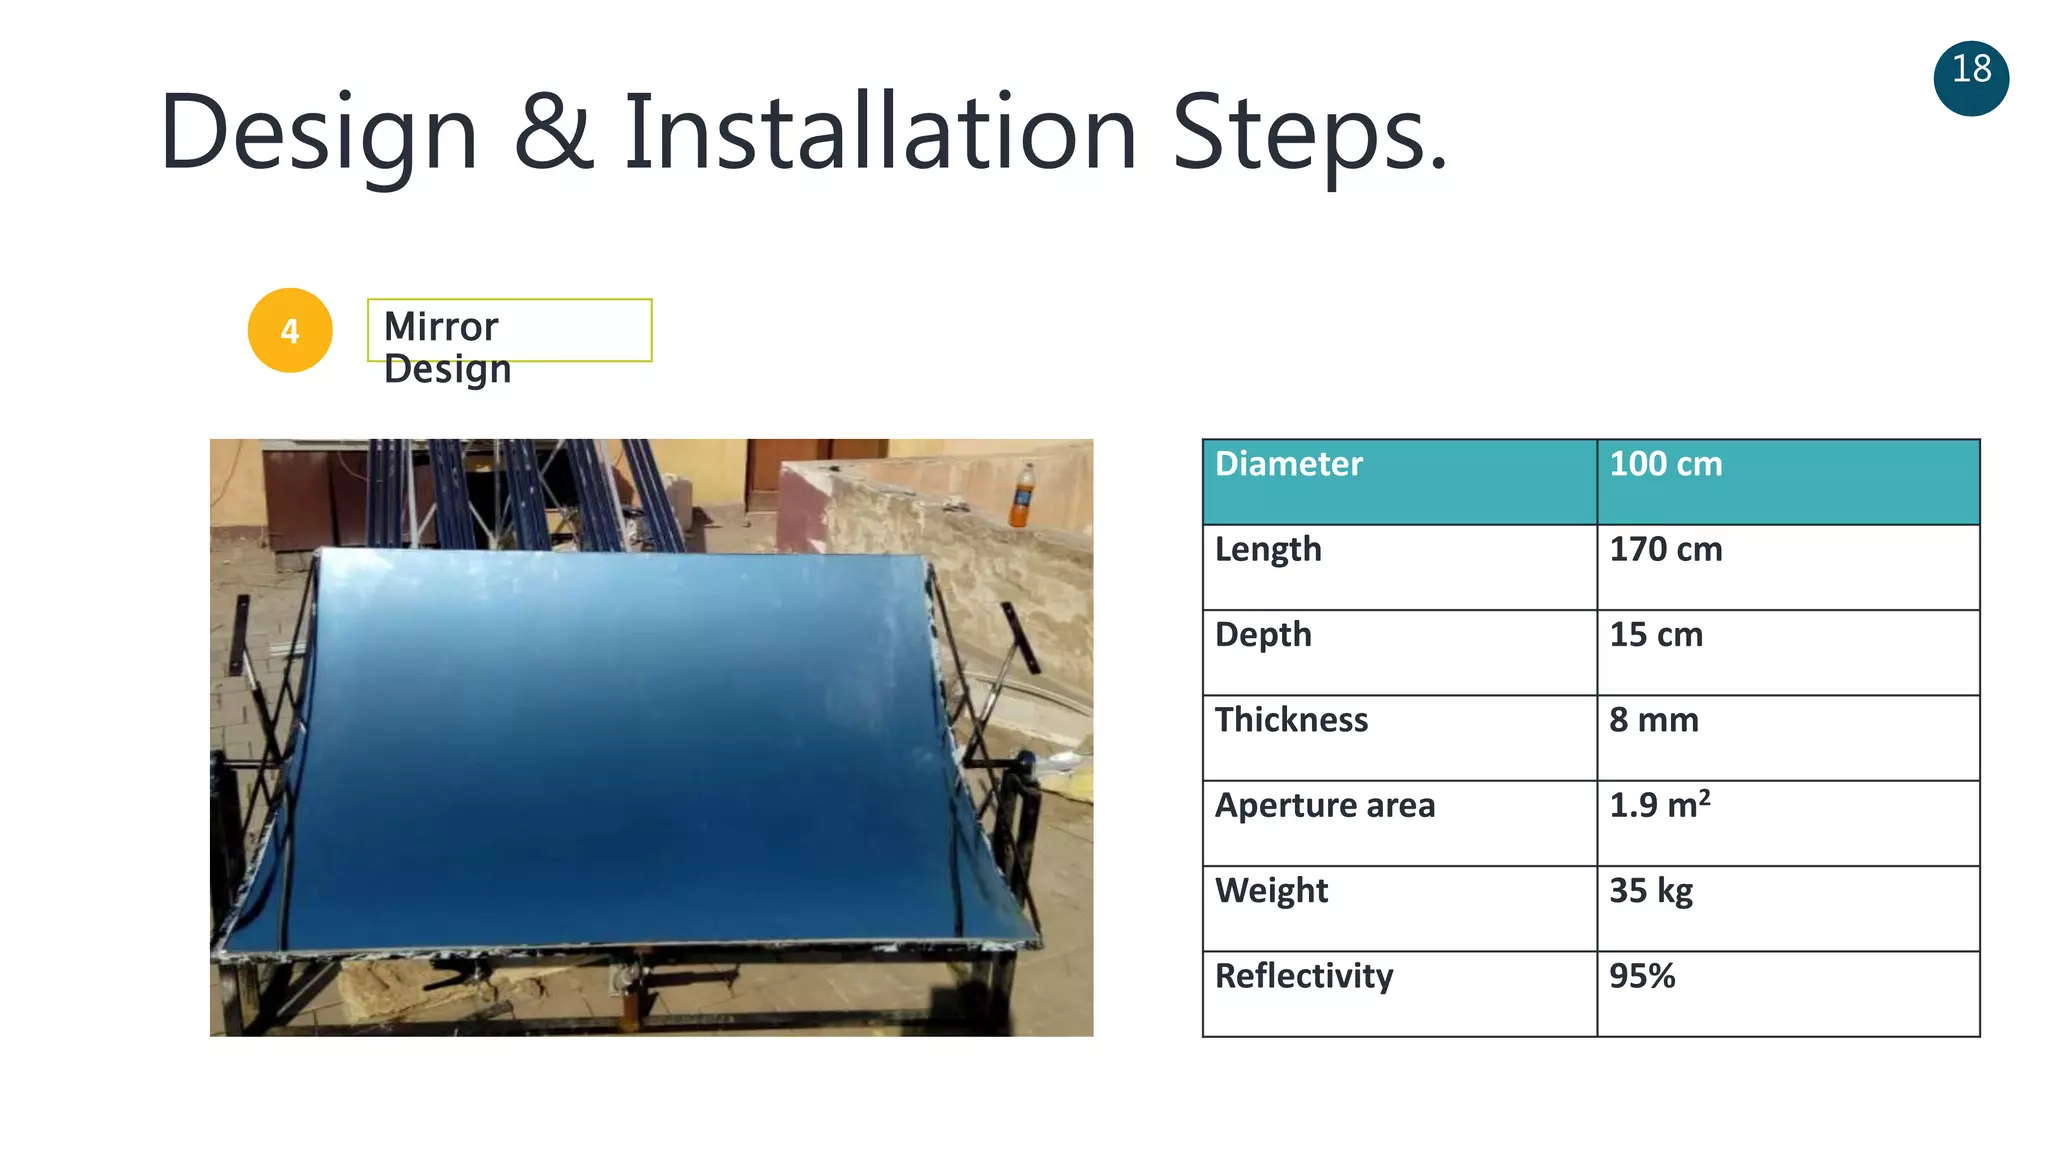
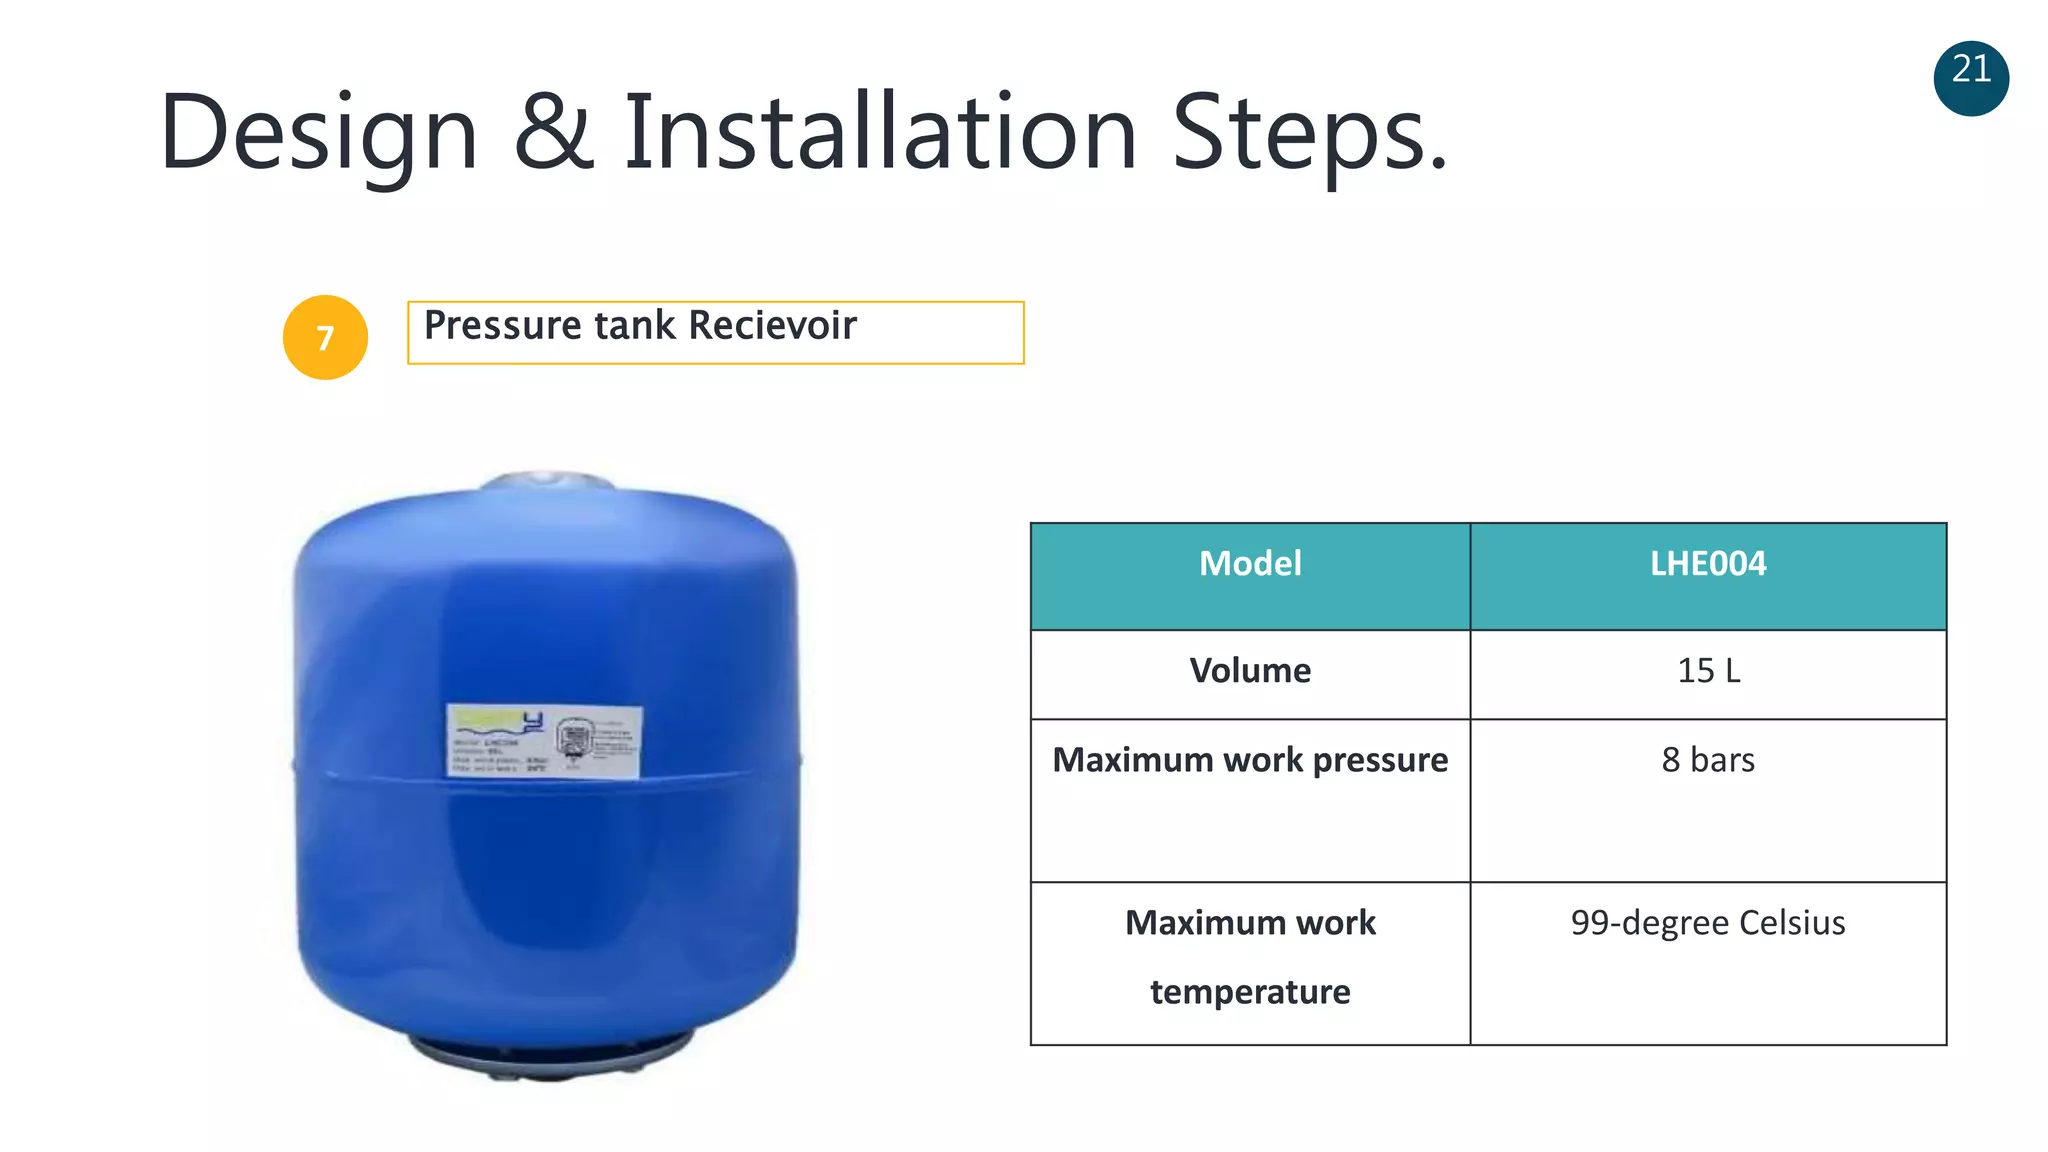
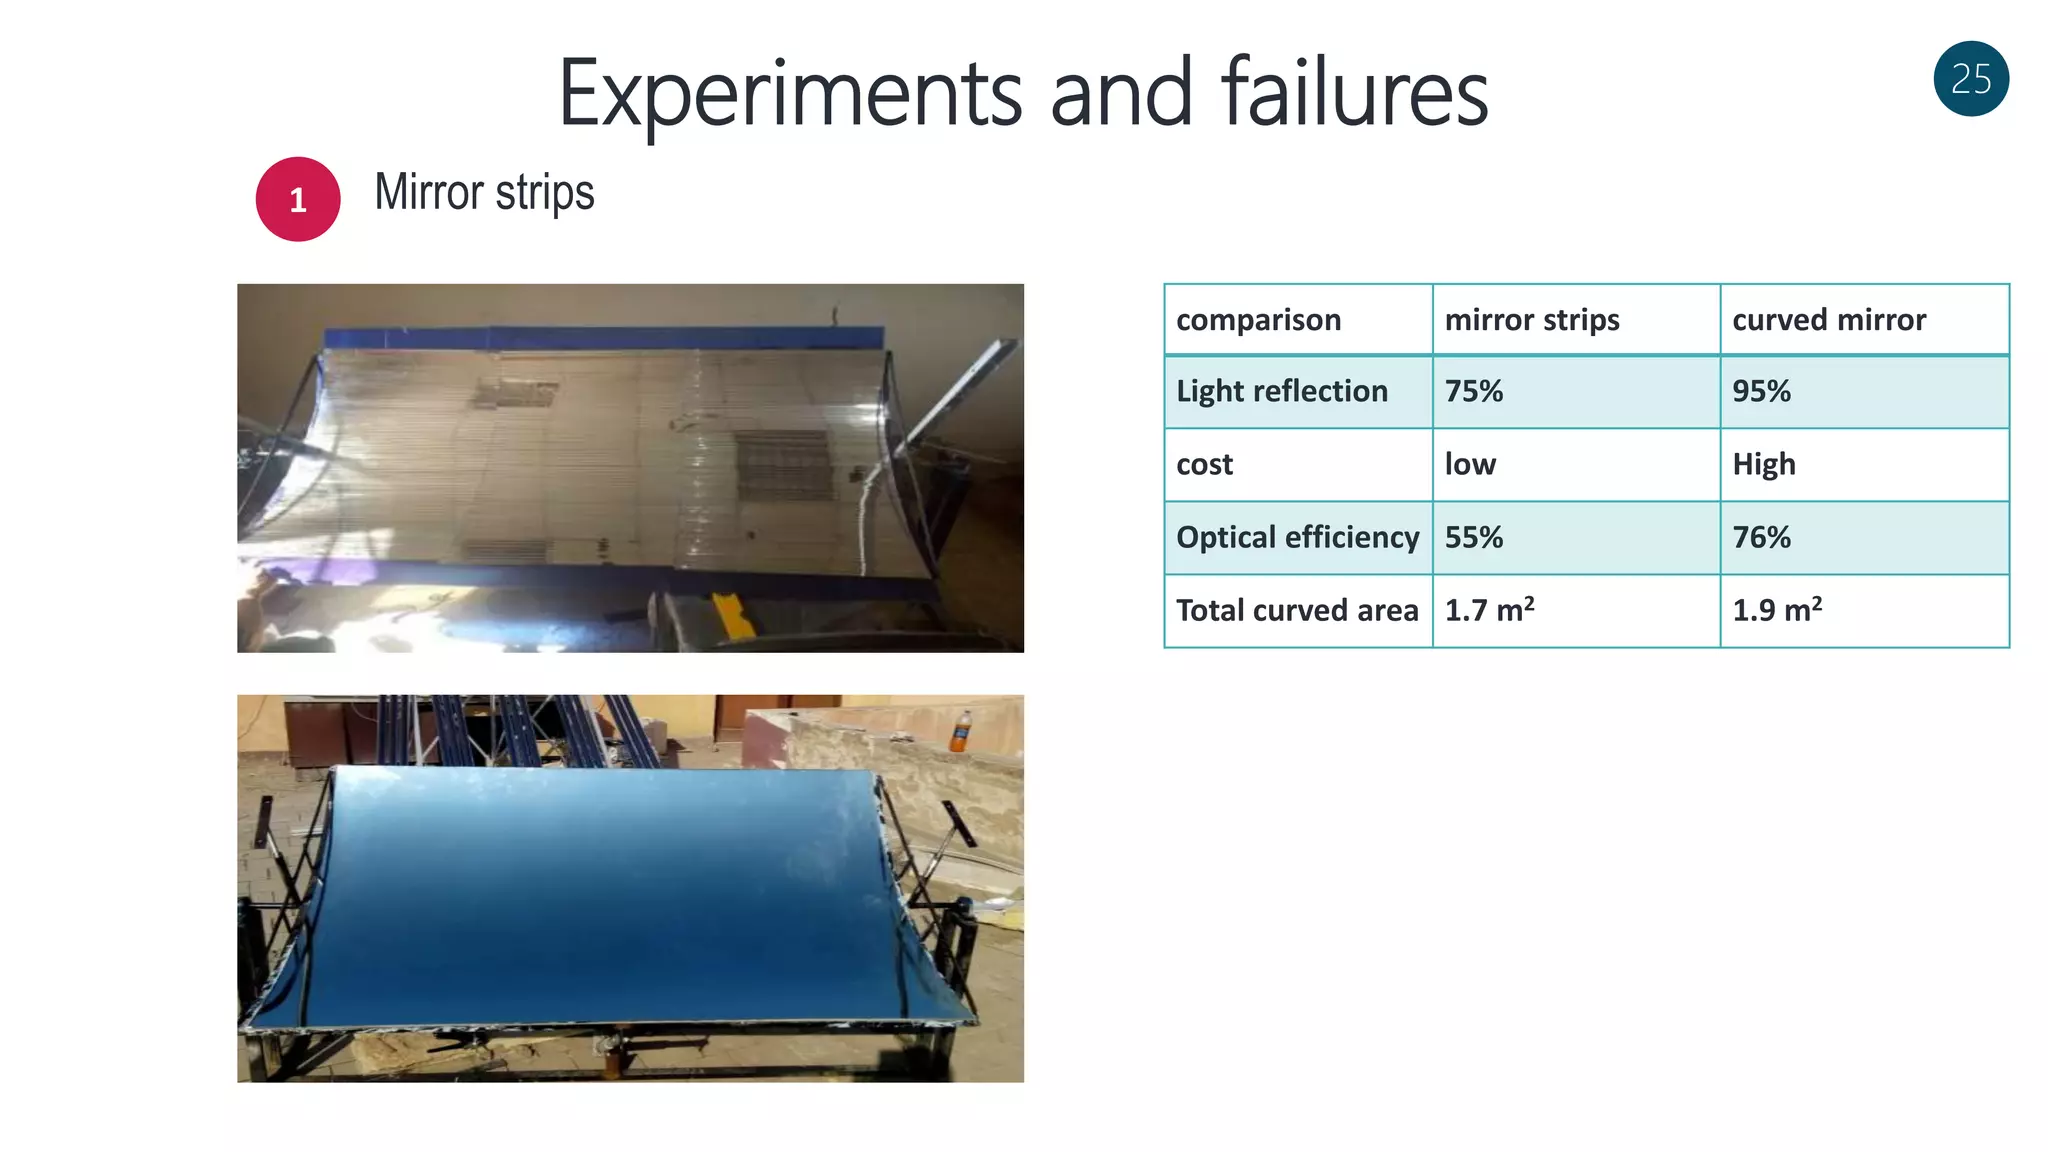
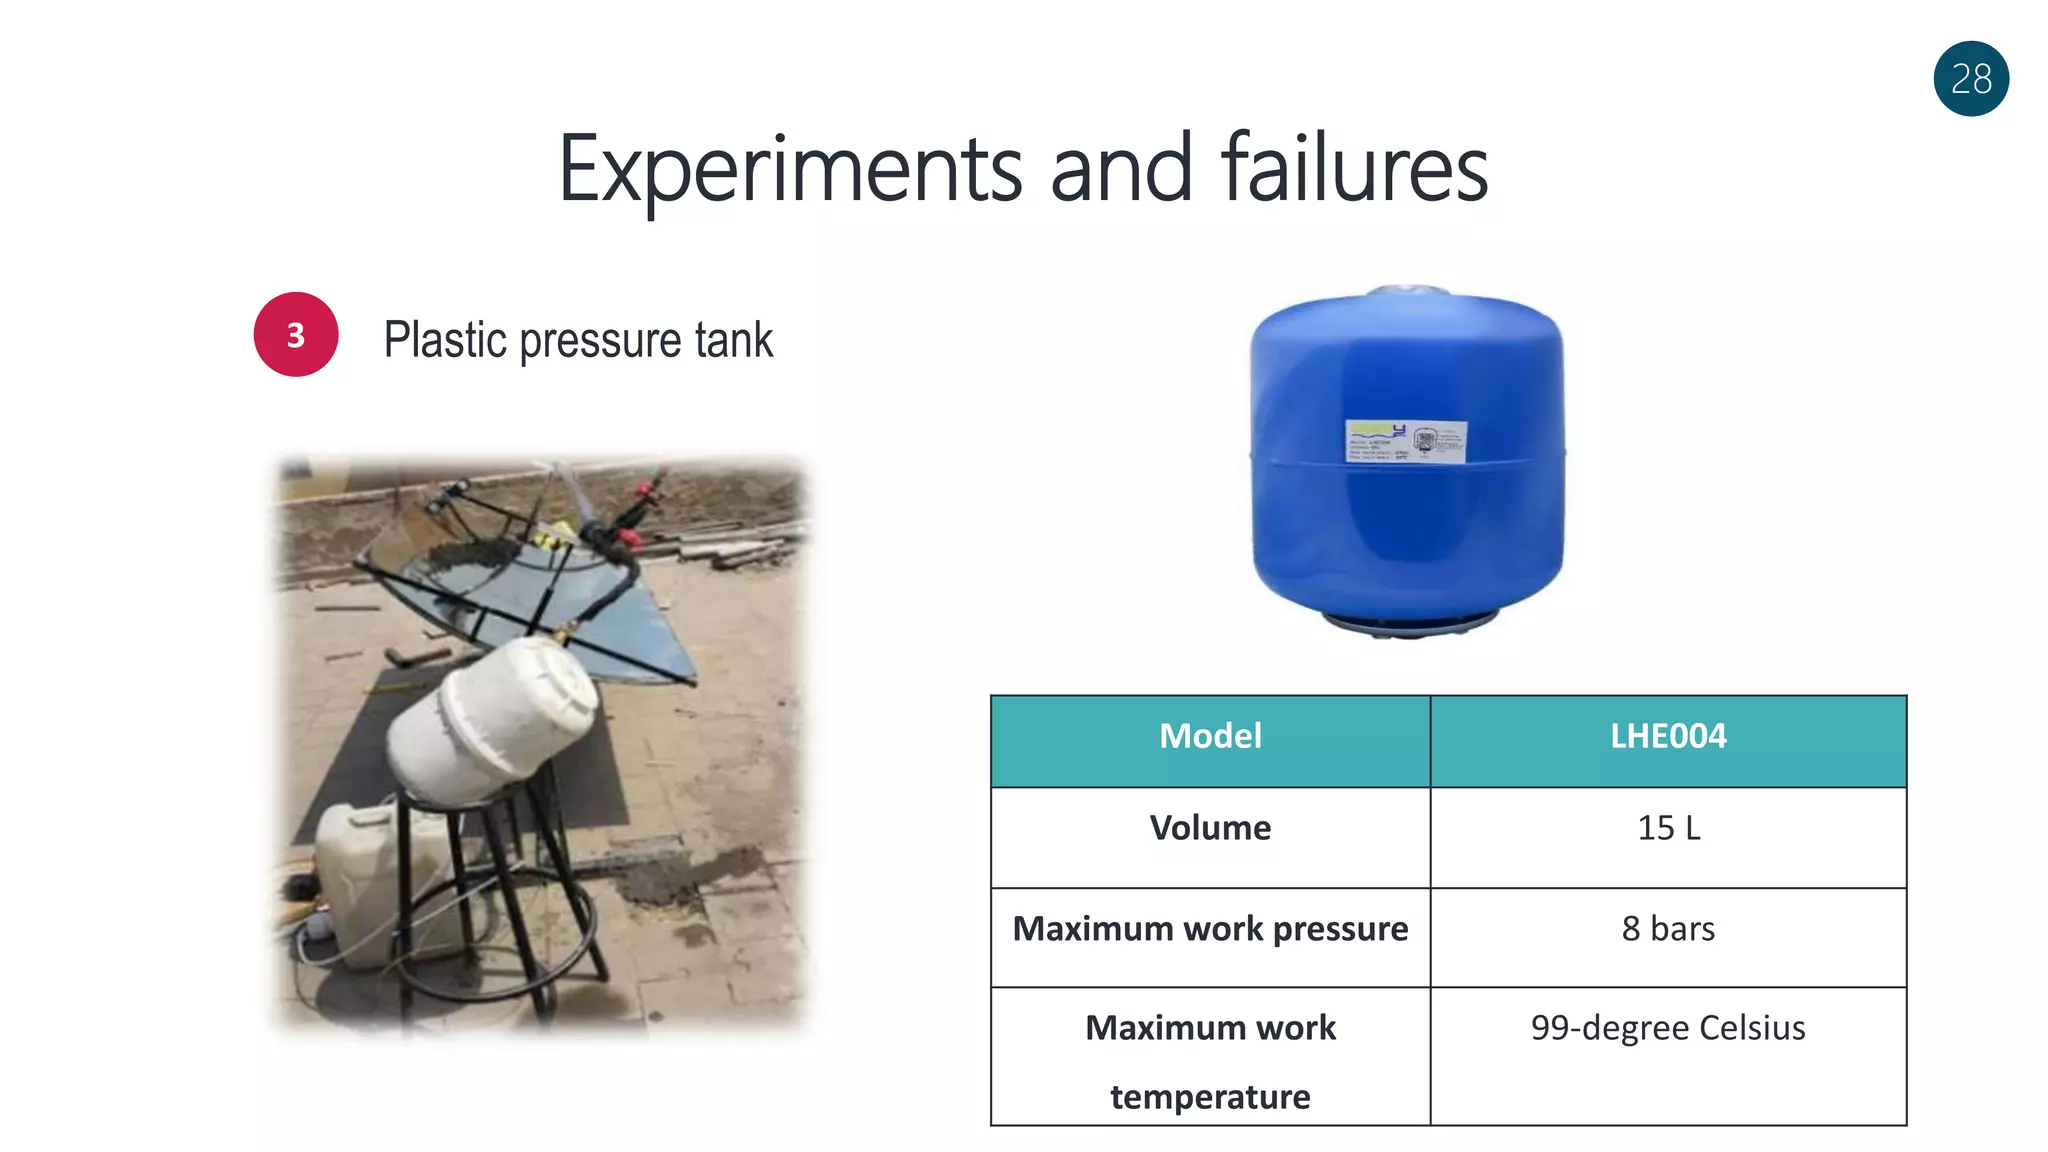
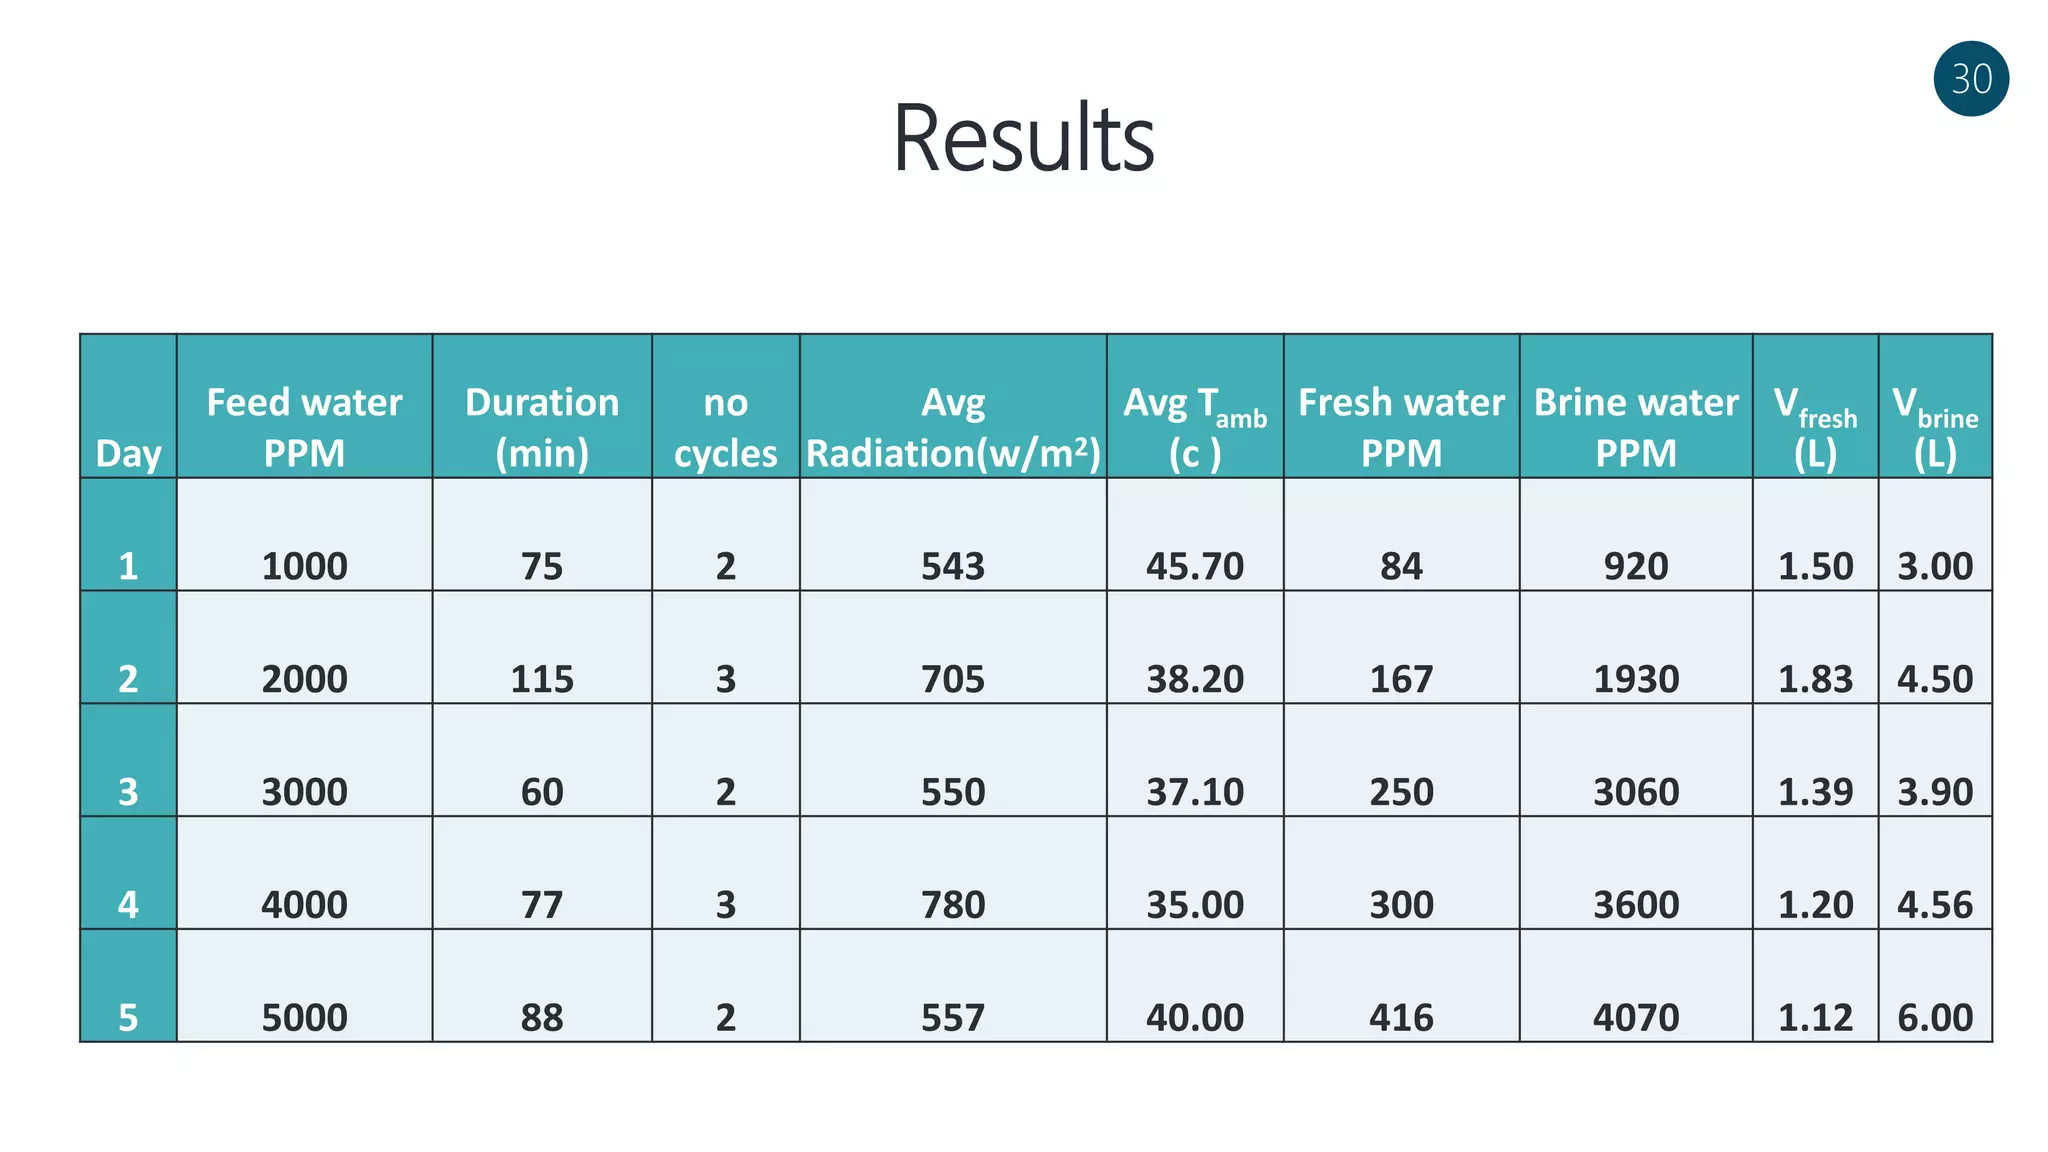
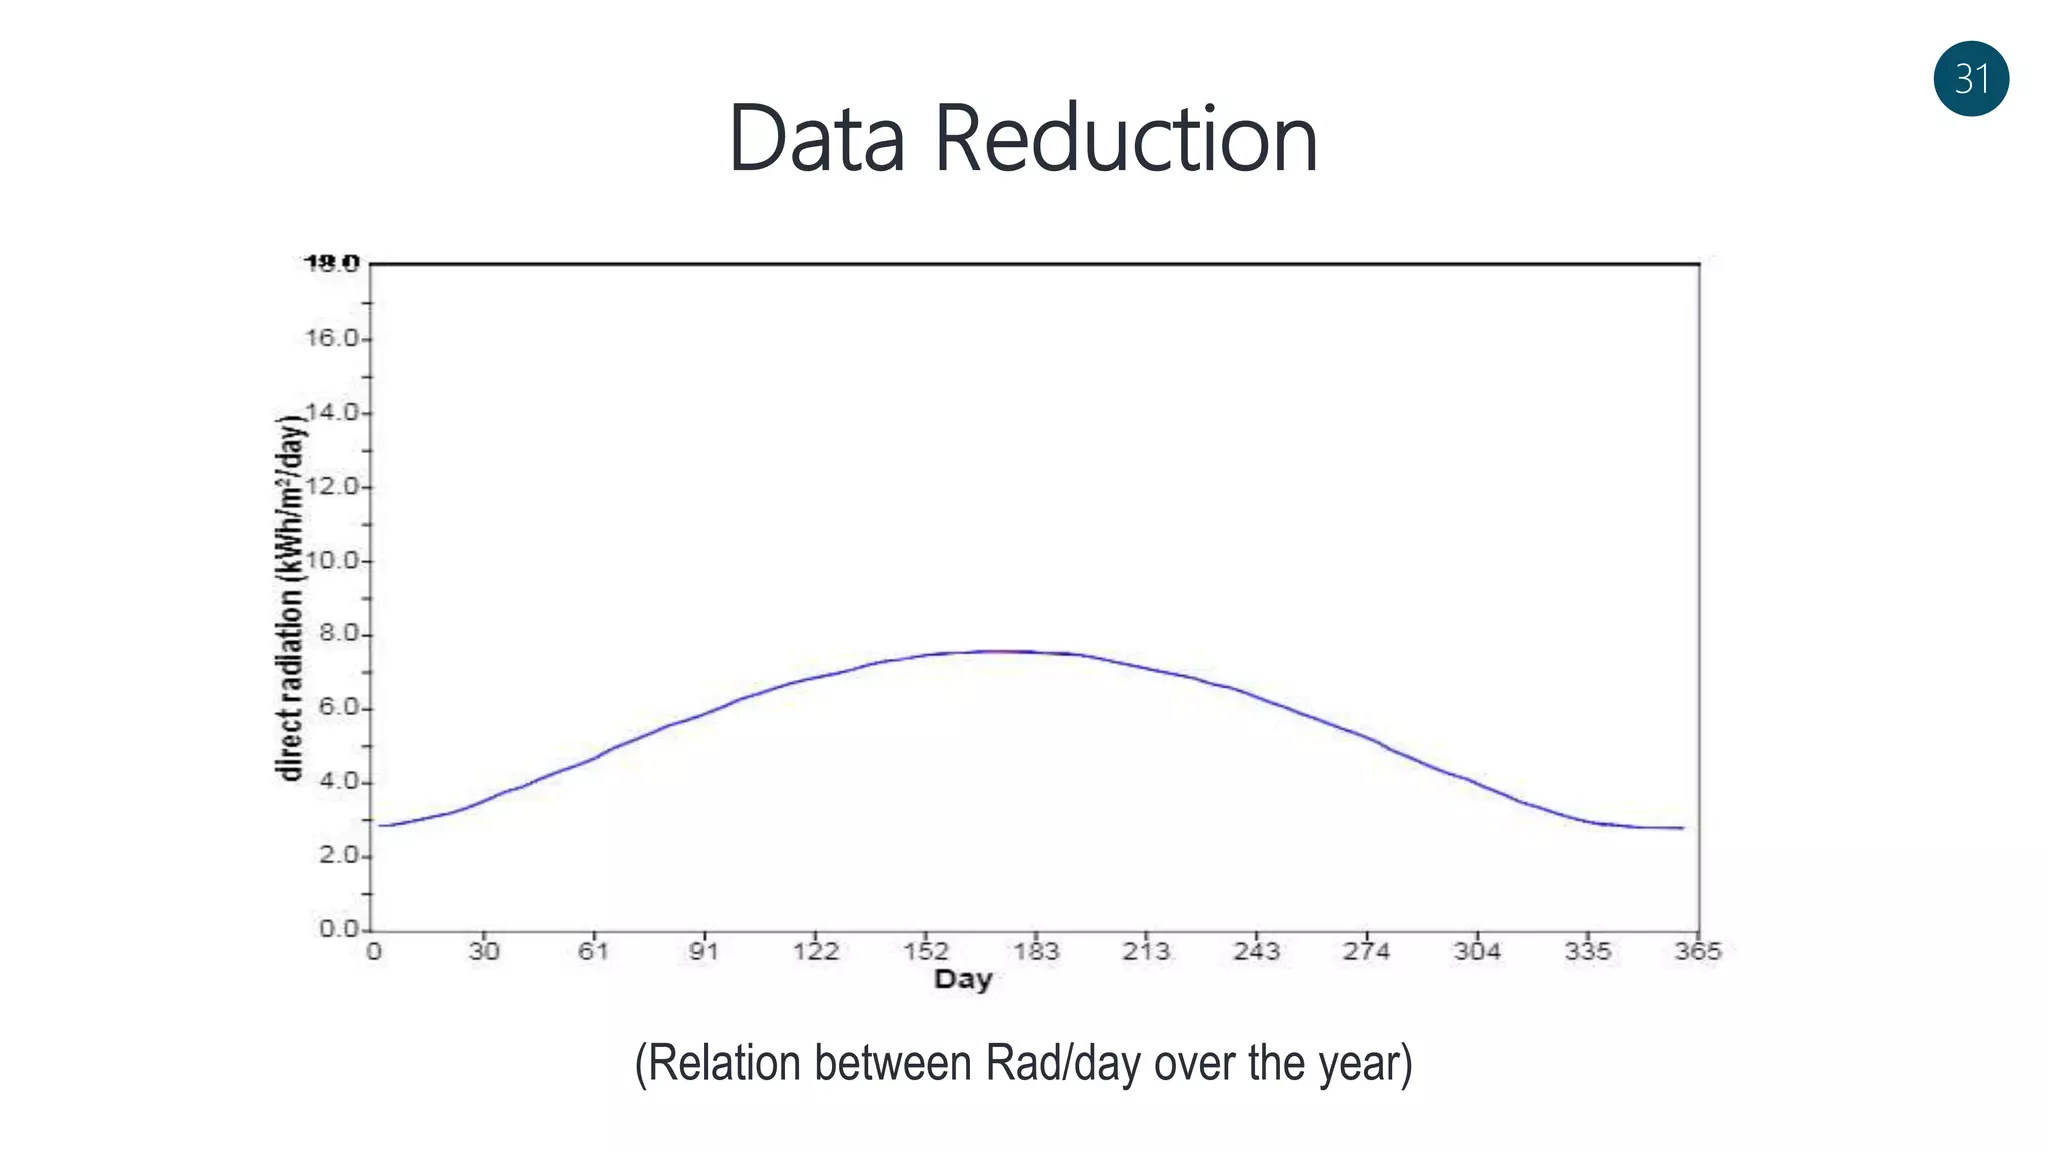
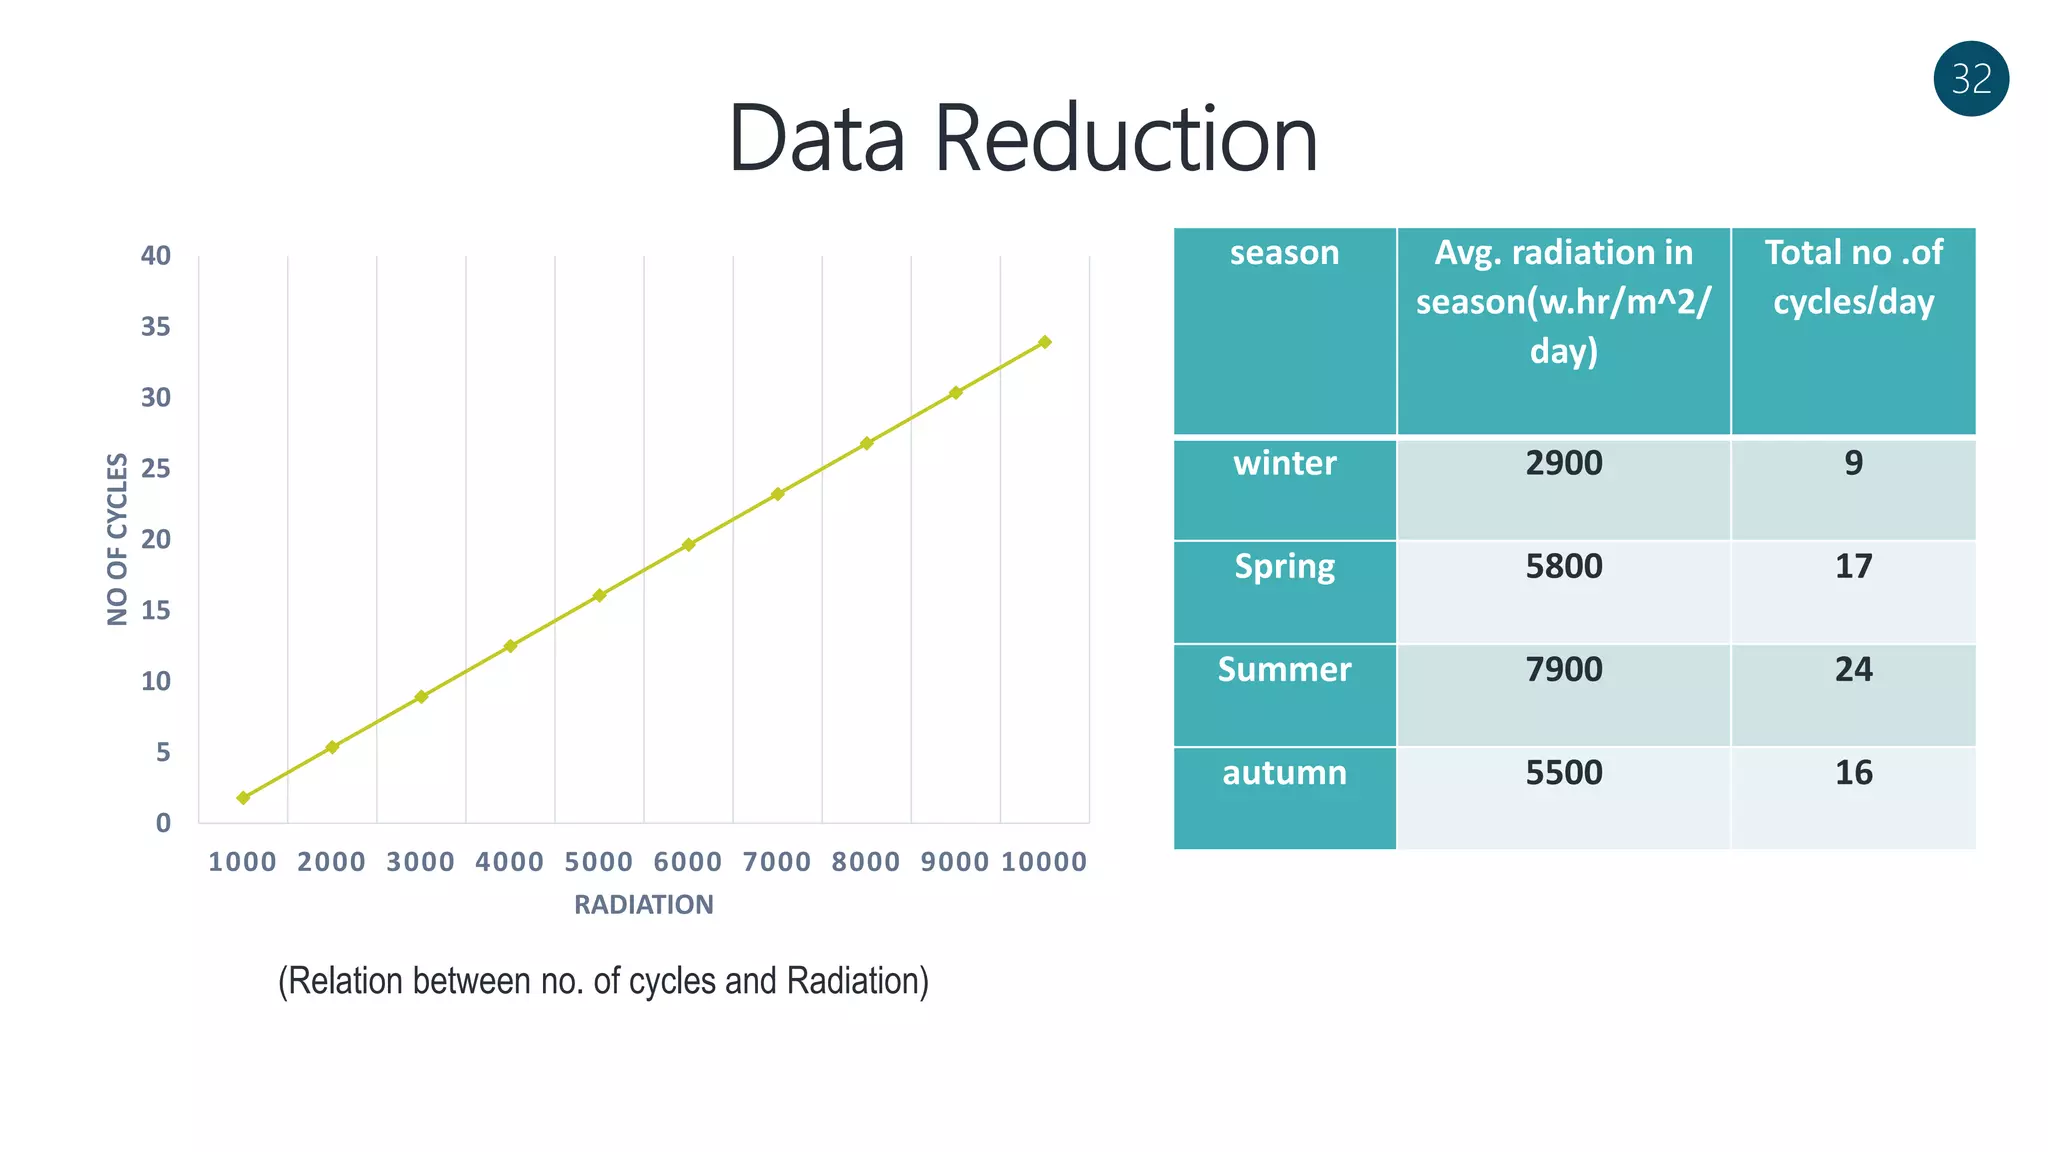
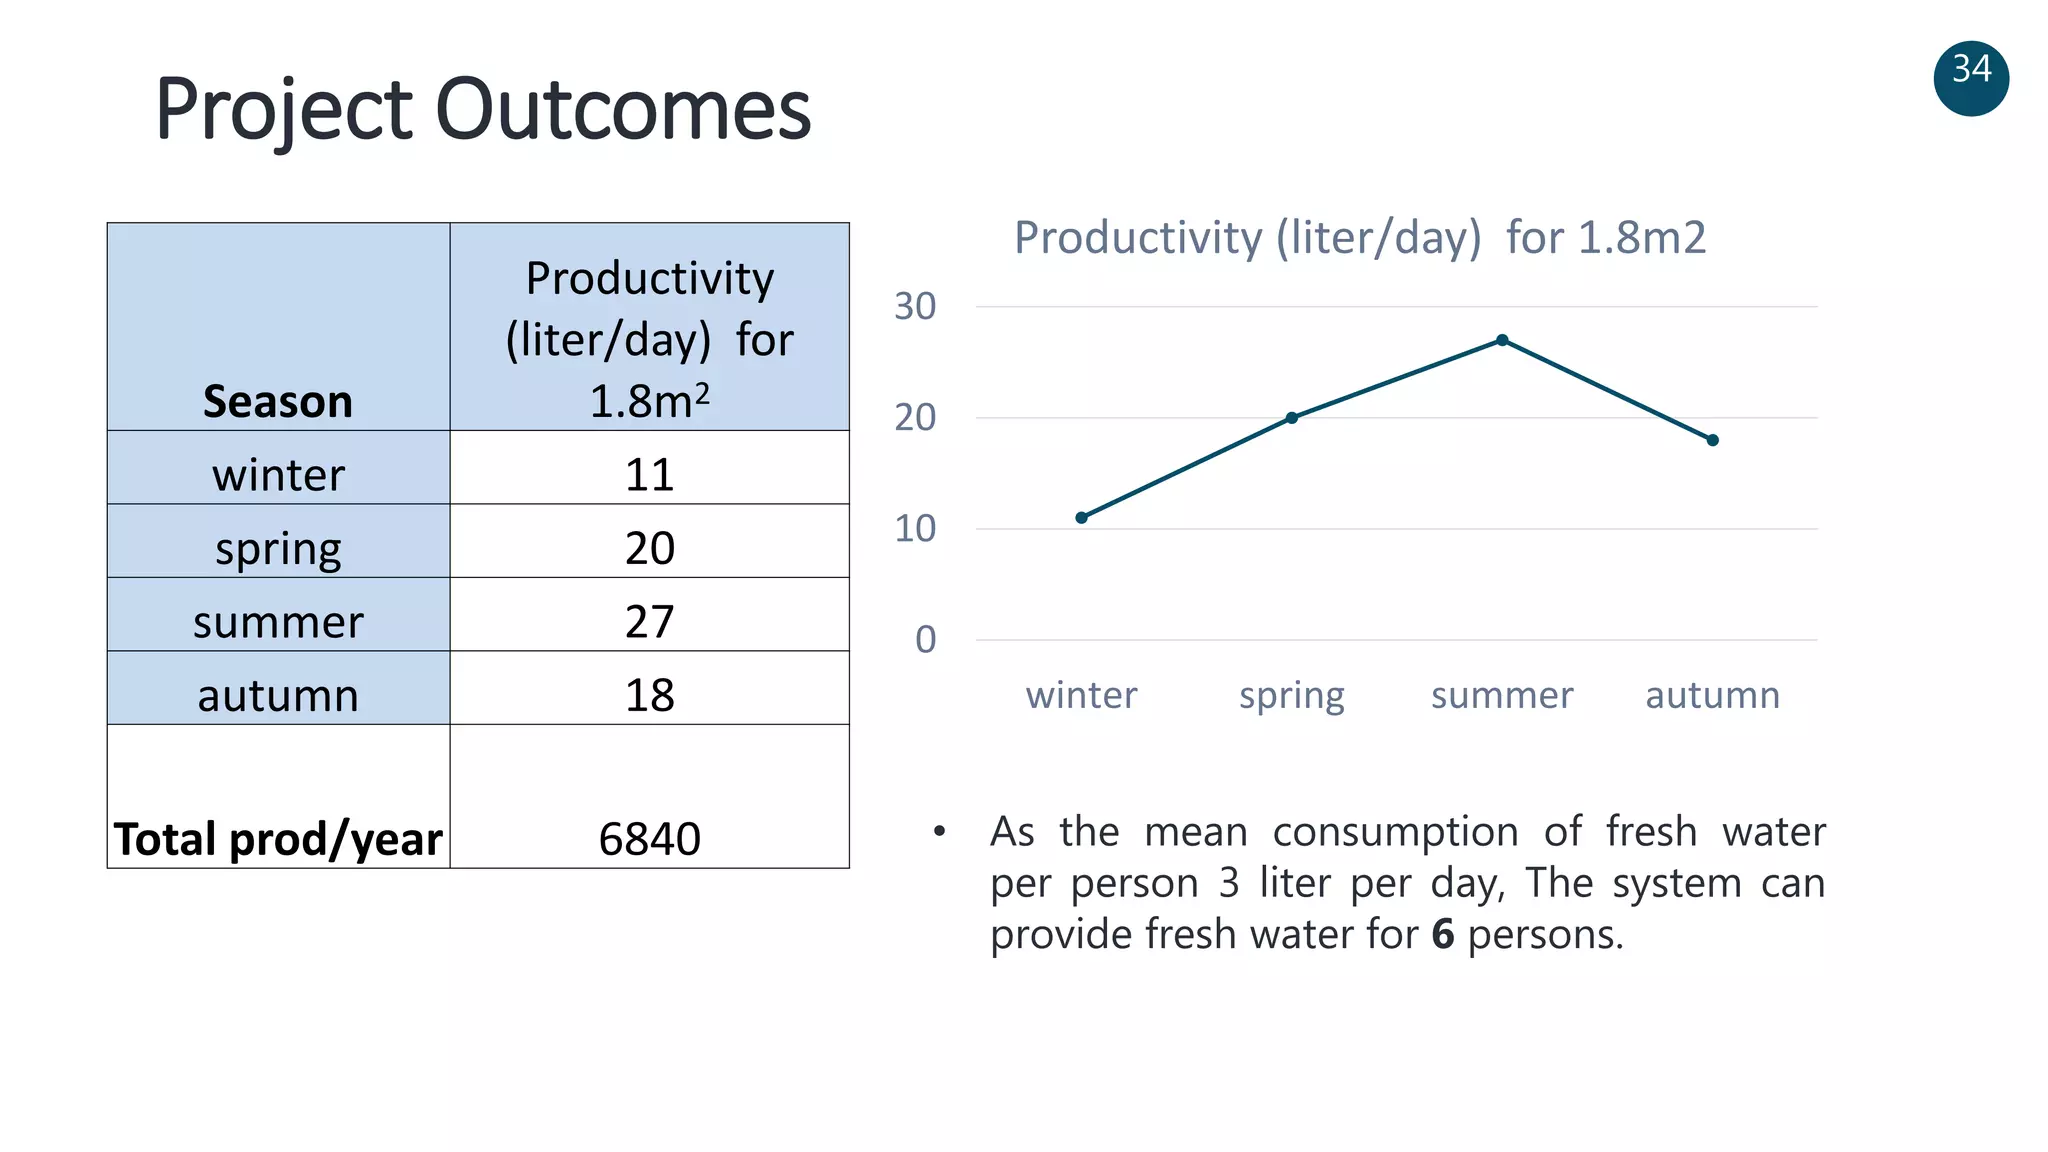
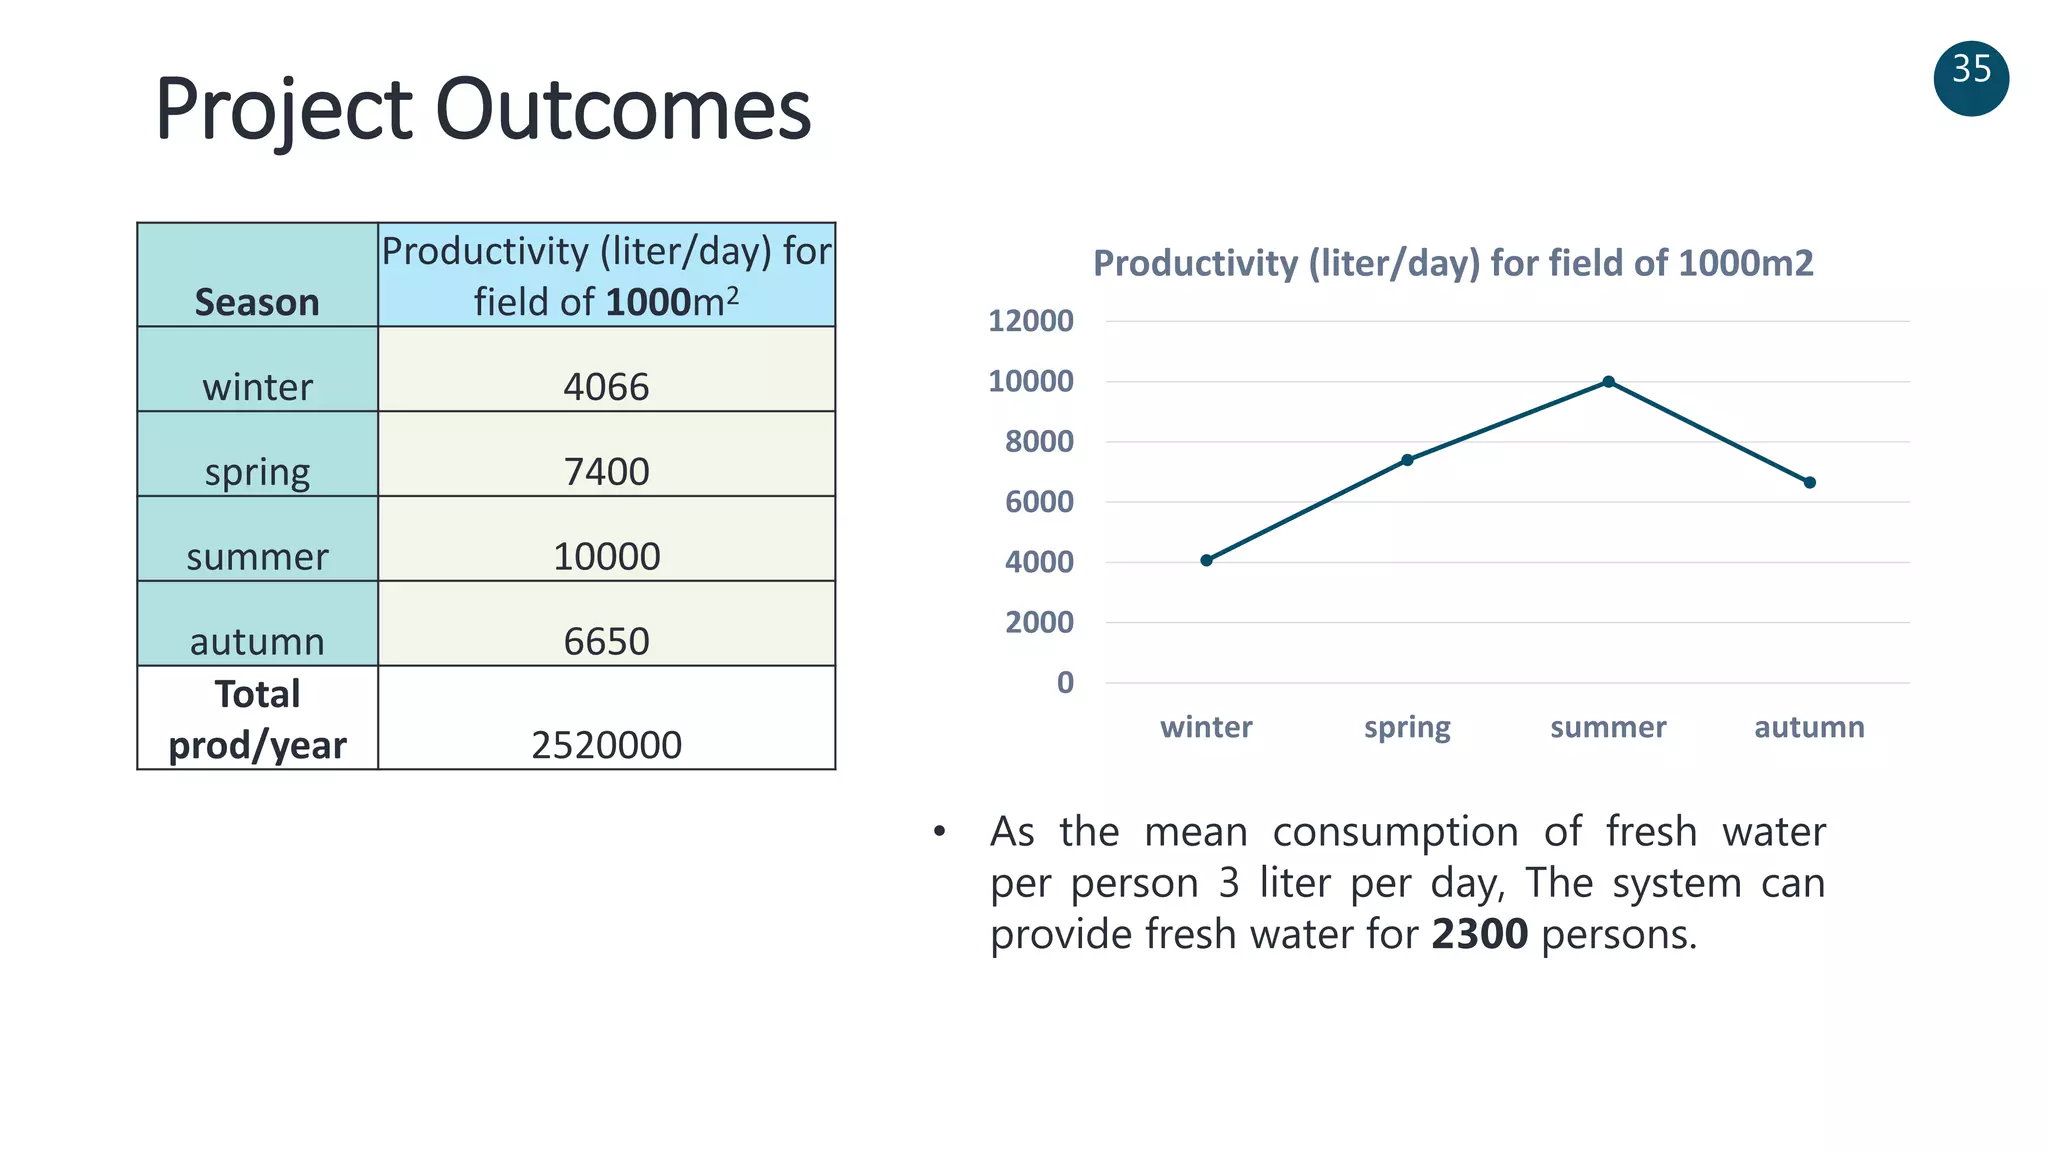
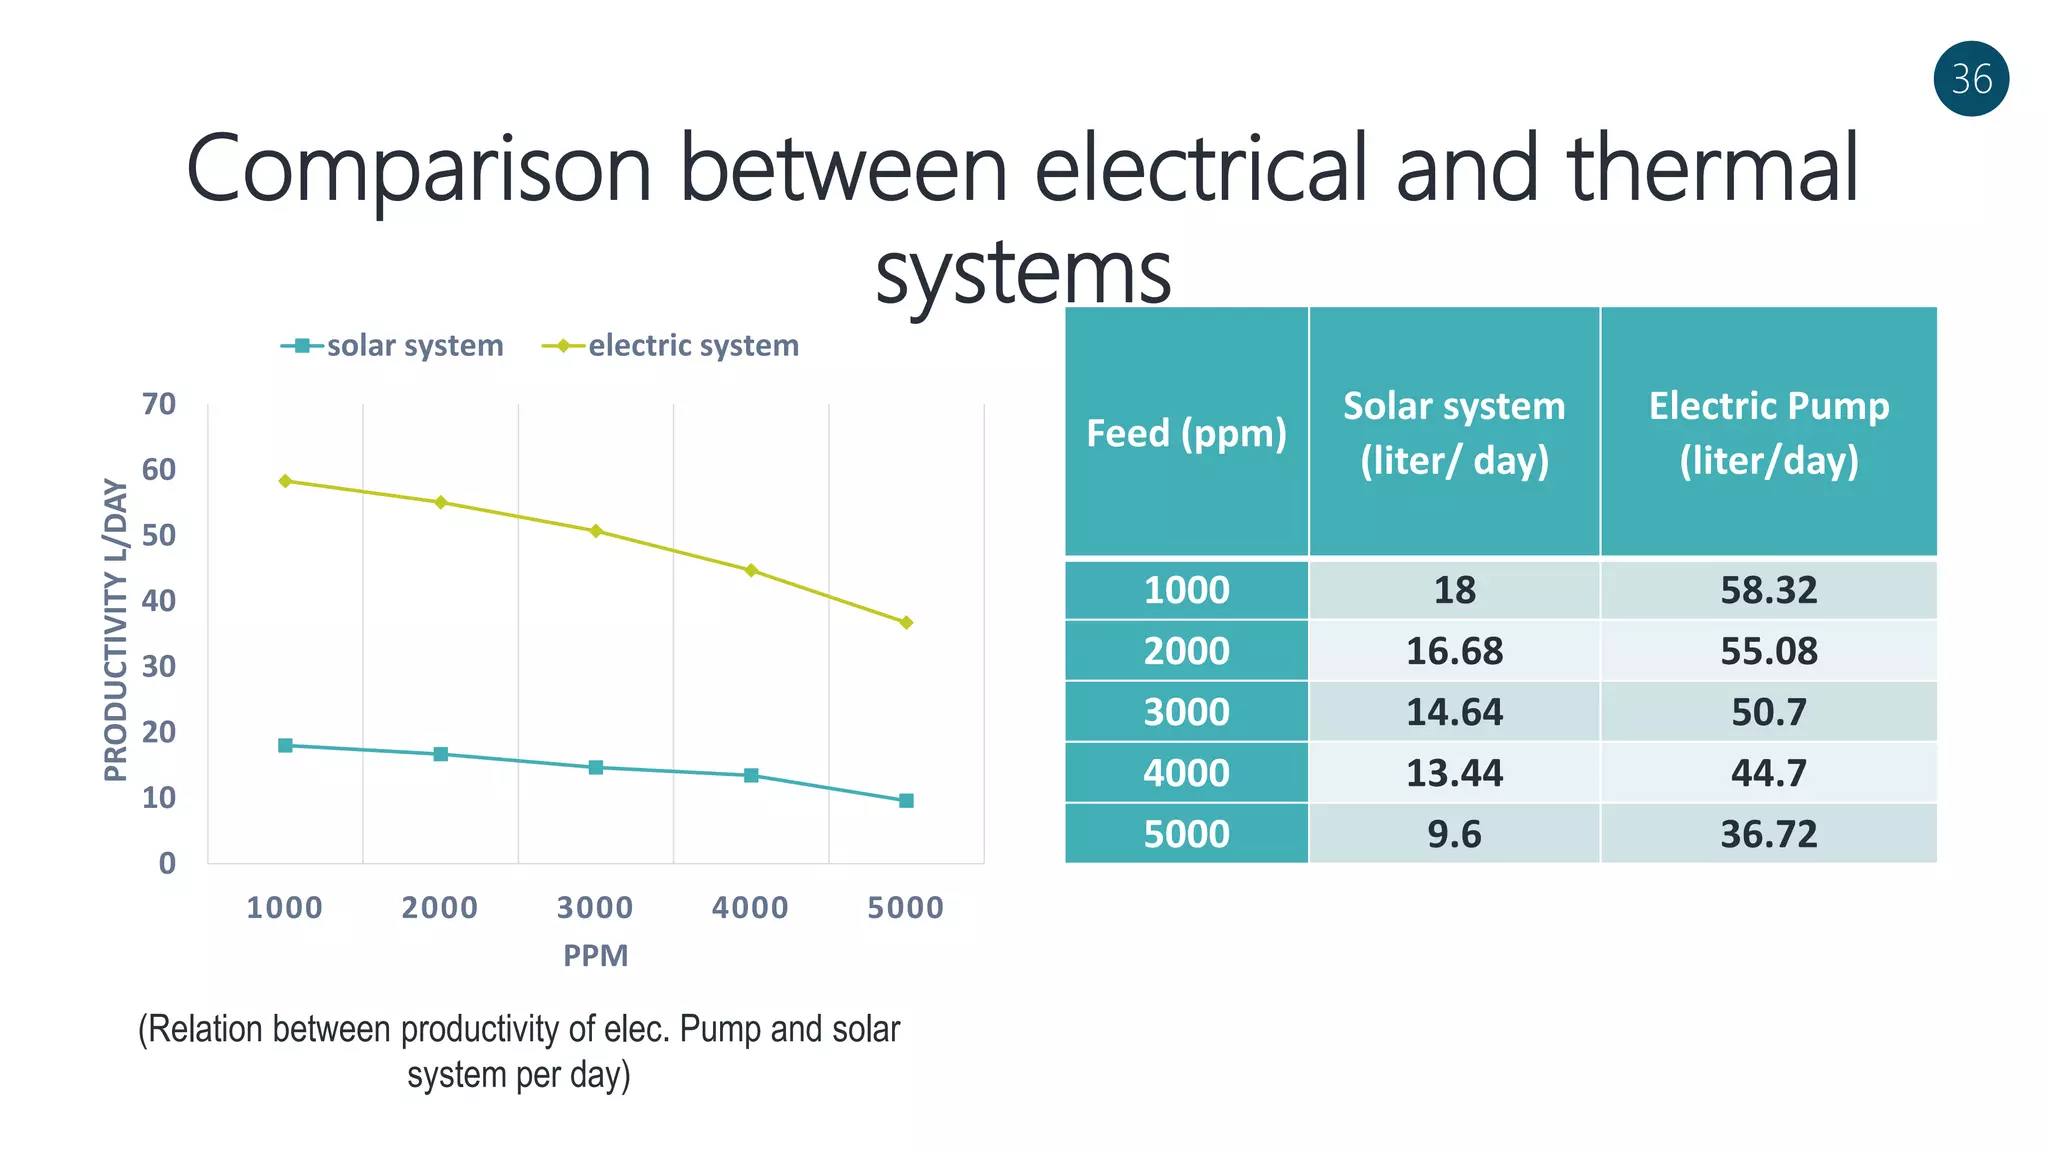
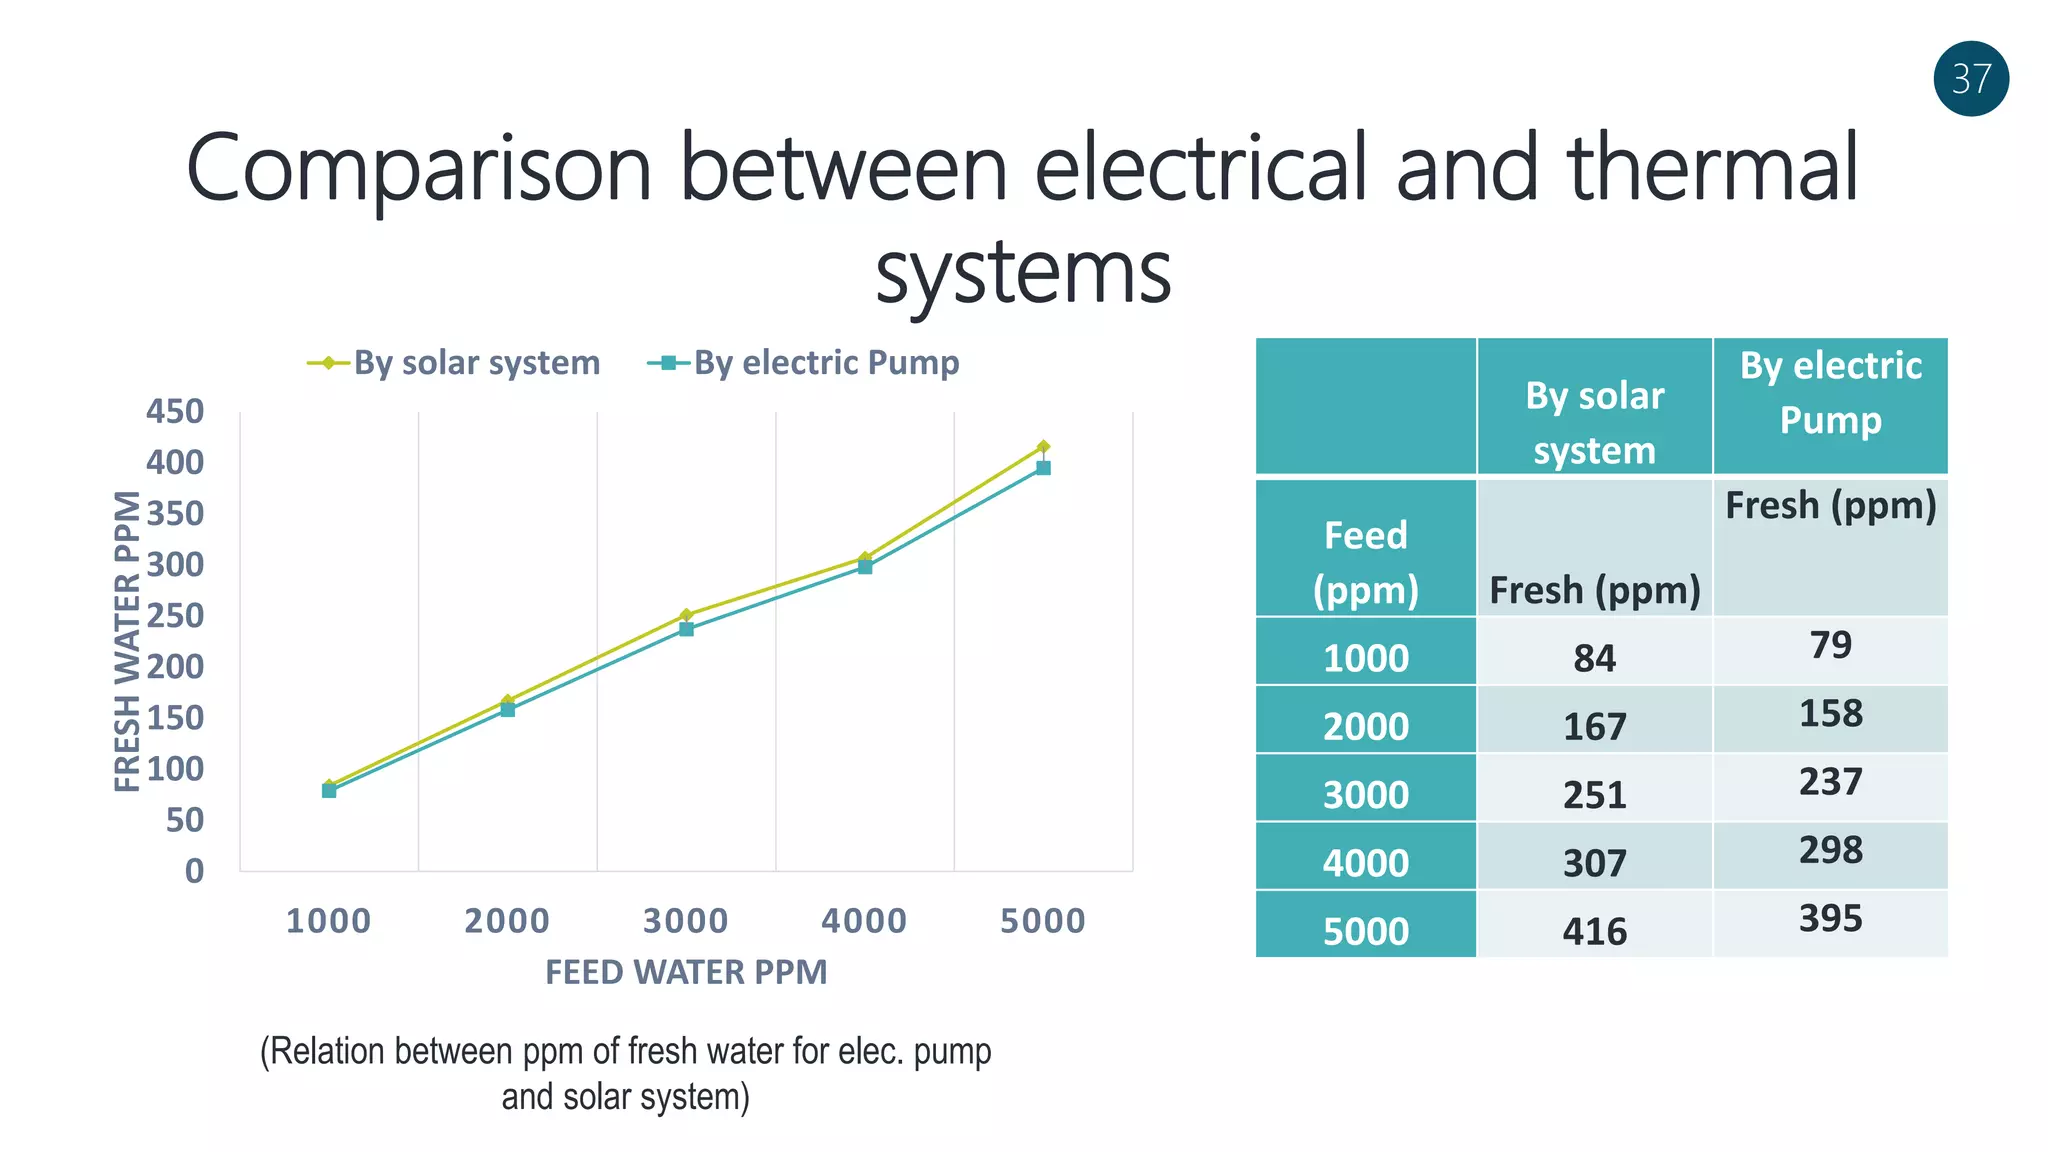
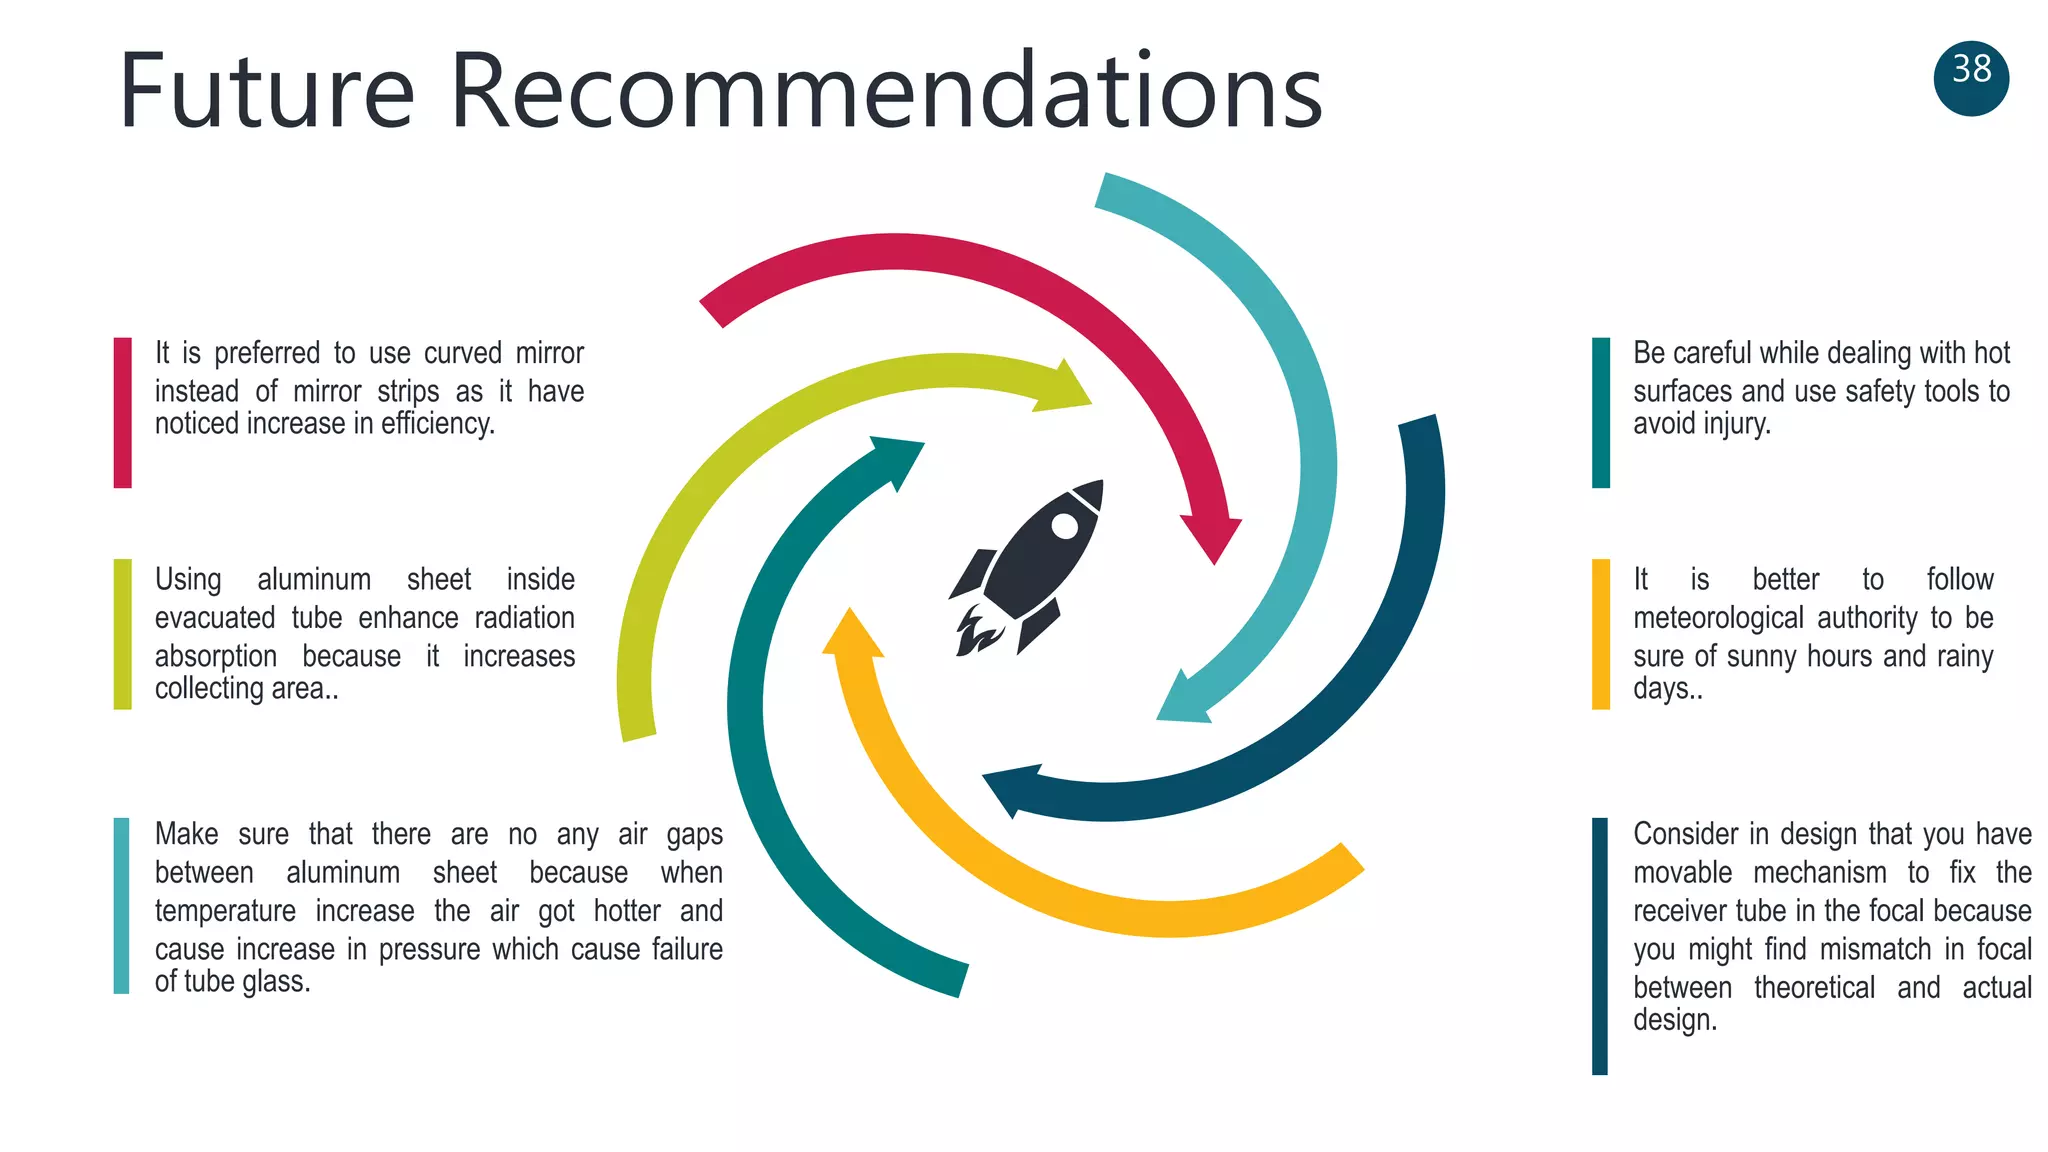
“RO” water desalination unit
using Solar energy as source
of Pressure energy
Supervisors
Prof Dr/ Ramdan Sakr
Prof Dr/ Ahmed Attia
Dr/ Mohamed Abdelrahman
Dr/ Mohamed Emam
Mechanical Engineering Dept.
2019
Presented by
Mahmoud Hesham Lotfy
Ahmed Mohamed Hanora
Yousry Tarek Mostafa
Ahmed Khaled Soliman
Kareem Mohamed Nassar
2
Table of content
I- Introduction
II- System description
III- Operation method
Iv- Results
3
Energy Problem
4
Main Problem
Water Problem
Water scarcity is the
lack of fresh water
resources to meet water
demand. It affects every
continent and was
listed in 2019 by the
World Economic Forum
as one of the largest
global risks in terms of
potential impact over
the next decade .
Most scientists now believe
that carbon dioxide
concentrations in the
atmosphere are rapidly
increasing, and that
emissions from the burning
of fossil fuels is a principal
cause. Thus, it is probable
that this will affect the
climate and lead to global
warming. Also Fossil fuels is
finite source of energy.
5
Brainstorming
Objective
s• Desalinating water to overcome fresh
water crisis.
• Using sustainable and
renewable energy instead of
fossil fuel.
6
• Reduce the production cost.
• Using clean energy to reduce
pollution.
Renewable
Energy
Energy obtained from natural
energy occurring in the
immediate
Environment.
Infinite source of energy, clean
and cheap.
Has a lot of types such as:
Solar, Wind, Hydropower,
Geothermal and Tidal energy.
C
B
A
6
Why Solar Energy? 8
Location of Egypt.1
2
3
4
A solar energy system has no moving
parts, which means less risk to damage
and less maintenance.
Solar energy systems provide more
predictable energy outputs.
Relatively silent in operation, fast
installation
Egypt received about 2400-2800 kWh/m2 per year
as direct normal irradiance.
Understanding
Osmosis.
Osmosis is the tendency of water to flow
from a hypotonic solution (low
substances) to hypertonic solution (higher
of dissolved substances) across a
membrane.
9
What is Reverse
Osmosis, “RO”?
Reverse Osmosis is a technology that is
used
to remove a large majority of
pushing the water under pressure through
semipermeable membrane.
10
Reverse Osmosis removes: More than 99%
of dissolved salts(ions), Dust Particles,
Colloids Organics, Bacteria, Pyrogens. And
many more.
Concentrating solar thermal (CST) systems
• CST technologies use different mirror configurations to
concentrate the sun’s light energy onto a receiver and convert it
steam with high pressure.
• In a CST system, the solar-generated heat replaces the burning of
11
Linear Fresnel
concentrators
Parabolic trough
concentrators
Dish-Engine
concentrators
Power Tower
concentrators
line-focus systems point-focus systems
Concentrating Solar Technologies
12
Description of the experimental
setup
13
System layout
Design & Installation Steps. 14
1 Base design
Design & Installation Steps.
15
Max stress is 1.2*10^6 N/m^2 The maximum Displacement is 0.31
mm
Factor of safety = 8
2 Stress analysis
Design & Installation Steps.
16
3 Parabola curve & installation
Design & Installation Steps.
17
Parabola curve & installation3
Design & Installation Steps.
18
Mirror
Design
Diameter 100 cm
Length 170 cm
Depth 15 cm
Thickness 8 mm
Aperture area 1.9 m2
Weight 35 kg
Reflectivity 95%
4
Design & Installation Steps. 19
Evacuated tube5
Design & Installation
Steps.
20
Copper tube Material Copper
Length 170cm
Inner diameter 3.3cm
Outer diameter 3.5cm
Thickness 2mm
Volume 1.9 Liter
Thermal conductivity 400 at 25c
Density 8960 kg/m^3
6
Design & Installation Steps.
21
Model LHE004
Volume 15 L
Maximum work pressure 8 bars
Maximum work
temperature
99-degree Celsius
7 Pressure tank Recievoir
Operation
22
Operation
23
Operation
24
Experiments and failures
1 Mirror strips
25
comparison mirror strips curved mirror
Light reflection 75% 95%
cost low High
Optical efficiency 55% 76%
Total curved area 1.7 m2 1.9 m2
Experiments and failures
2 Acrylic cylinder with moveable piston
26
Experiments and failures
27
Are
You
Ready!
?
Experiments and failures
3 Plastic pressure tank
28
Model LHE004
Volume 15 L
Maximum work pressure 8 bars
Maximum work
temperature
99-degree Celsius
Instruments
29
Solar Power Meter TDS Temp Read out
Results
30
Day
Feed water
PPM
Duration
(min)
no
cycles
Avg
Radiation(w/m2)
Avg Tamb
(c )
Fresh water
PPM
Brine water
PPM
Vfresh
(L)
Vbrine
(L)
1 1000 75 2 543 45.70 84 920 1.50 3.00
2 2000 115 3 705 38.20 167 1930 1.83 4.50
3 3000 60 2 550 37.10 250 3060 1.39 3.90
4 4000 77 3 780 35.00 300 3600 1.20 4.56
5 5000 88 2 557 40.00 416 4070 1.12 6.00
Data Reduction
31
(Relation between Rad/day over the year)
Data Reduction
32
0
5
10
15
20
25
30
35
40
1000 2000 3000 4000 5000 6000 7000 8000 9000 10000
NOOFCYCLES
RADIATION
season Avg. radiation in
season)w.hr/m^2/
day)
Total no .of
cycles/day
winter 2900 9
Spring 5800 17
Summer 7900 24
autumn 5500 16
(Relation between no. of cycles and Radiation)
Data Reduction
0
2
4
6
8
10
12
14
16
18
20
1000 2000 3000 4000 5000
PRODUCTIVITYL/DAY
PPM
ppm production L/d
1000 18
2000 16.68
3000 14.64
4000 13.44
5000 9.6
(Relation between PPM and Productivity)
33
Project Outcomes
34
Season
Productivity
(liter/day) for
1.8m2
winter 11
spring 20
summer 27
autumn 18
Total prod/year 6840
0
10
20
30
winter spring summer autumn
Productivity (liter/day) for 1.8m2
• As the mean consumption of fresh water
per person 3 liter per day, The system can
provide fresh water for 6 persons.
Project Outcomes
35
• As the mean consumption of fresh water
per person 3 liter per day, The system can
provide fresh water for 2300 persons.
Season
Productivity (liter/day) for
field of 1000m2
winter 4066
spring 7400
summer 10000
autumn 6650
Total
prod/year 2520000
0
2000
4000
6000
8000
10000
12000
winter spring summer autumn
Productivity (liter/day) for field of 1000m2
Comparison between electrical and thermal
systems
Feed (ppm)
Solar system
(liter/ day)
Electric Pump
(liter/day)
1000 18 58.32
2000 16.68 55.08
3000 14.64 50.7
4000 13.44 44.7
5000 9.6 36.72
0
10
20
30
40
50
60
70
1000 2000 3000 4000 5000
PRODUCTIVITYL/DAY
PPM
solar system electric system
(Relation between productivity of elec. Pump and solar
system per day)
36
0
50
100
150
200
250
300
350
400
450
1000 2000 3000 4000 5000
FRESHWATERPPM
FEED WATER PPM
By solar system By electric Pump
Comparison between electrical and thermal
systems
By solar
system
By electric
Pump
Feed
(ppm) Fresh (ppm)
Fresh (ppm)
1000 84 79
2000 167 158
3000 251 237
4000 307 298
5000 416 395
(Relation between ppm of fresh water for elec. pump
and solar system)
37
Future Recommendations 38
Make sure that there are no any air gaps
between aluminum sheet because when
temperature increase the air got hotter and
cause increase in pressure which cause failure
of tube glass.
Using aluminum sheet inside
evacuated tube enhance radiation
absorption because it increases
collecting area..
It is preferred to use curved mirror
instead of mirror strips as it have
noticed increase in efficiency.
Consider in design that you have
movable mechanism to fix the
receiver tube in the focal because
you might find mismatch in focal
between theoretical and actual
design.
It is better to follow
meteorological authority to be
sure of sunny hours and rainy
days..
Be careful while dealing with hot
surfaces and use safety tools to
avoid injury.
Thank
you
39

RO - Water Desalination Unit using parabolic trough collector

  • 1.
    “RO” water desalinationunit using Solar energy as source of Pressure energy Supervisors Prof Dr/ Ramdan Sakr Prof Dr/ Ahmed Attia Dr/ Mohamed Abdelrahman Dr/ Mohamed Emam Mechanical Engineering Dept. 2019
  • 2.
    Presented by Mahmoud HeshamLotfy Ahmed Mohamed Hanora Yousry Tarek Mostafa Ahmed Khaled Soliman Kareem Mohamed Nassar 2
  • 3.
    Table of content I-Introduction II- System description III- Operation method Iv- Results 3
  • 4.
    Energy Problem 4 Main Problem WaterProblem Water scarcity is the lack of fresh water resources to meet water demand. It affects every continent and was listed in 2019 by the World Economic Forum as one of the largest global risks in terms of potential impact over the next decade . Most scientists now believe that carbon dioxide concentrations in the atmosphere are rapidly increasing, and that emissions from the burning of fossil fuels is a principal cause. Thus, it is probable that this will affect the climate and lead to global warming. Also Fossil fuels is finite source of energy.
  • 5.
  • 6.
    Objective s• Desalinating waterto overcome fresh water crisis. • Using sustainable and renewable energy instead of fossil fuel. 6 • Reduce the production cost. • Using clean energy to reduce pollution.
  • 7.
    Renewable Energy Energy obtained fromnatural energy occurring in the immediate Environment. Infinite source of energy, clean and cheap. Has a lot of types such as: Solar, Wind, Hydropower, Geothermal and Tidal energy. C B A 6
  • 8.
    Why Solar Energy?8 Location of Egypt.1 2 3 4 A solar energy system has no moving parts, which means less risk to damage and less maintenance. Solar energy systems provide more predictable energy outputs. Relatively silent in operation, fast installation Egypt received about 2400-2800 kWh/m2 per year as direct normal irradiance.
  • 9.
    Understanding Osmosis. Osmosis is thetendency of water to flow from a hypotonic solution (low substances) to hypertonic solution (higher of dissolved substances) across a membrane. 9
  • 10.
    What is Reverse Osmosis,“RO”? Reverse Osmosis is a technology that is used to remove a large majority of pushing the water under pressure through semipermeable membrane. 10 Reverse Osmosis removes: More than 99% of dissolved salts(ions), Dust Particles, Colloids Organics, Bacteria, Pyrogens. And many more.
  • 11.
    Concentrating solar thermal(CST) systems • CST technologies use different mirror configurations to concentrate the sun’s light energy onto a receiver and convert it steam with high pressure. • In a CST system, the solar-generated heat replaces the burning of 11
  • 12.
    Linear Fresnel concentrators Parabolic trough concentrators Dish-Engine concentrators PowerTower concentrators line-focus systems point-focus systems Concentrating Solar Technologies 12
  • 13.
    Description of theexperimental setup 13 System layout
  • 14.
    Design & InstallationSteps. 14 1 Base design
  • 15.
    Design & InstallationSteps. 15 Max stress is 1.2*10^6 N/m^2 The maximum Displacement is 0.31 mm Factor of safety = 8 2 Stress analysis
  • 16.
    Design & InstallationSteps. 16 3 Parabola curve & installation
  • 17.
    Design & InstallationSteps. 17 Parabola curve & installation3
  • 18.
    Design & InstallationSteps. 18 Mirror Design Diameter 100 cm Length 170 cm Depth 15 cm Thickness 8 mm Aperture area 1.9 m2 Weight 35 kg Reflectivity 95% 4
  • 19.
    Design & InstallationSteps. 19 Evacuated tube5
  • 20.
    Design & Installation Steps. 20 Coppertube Material Copper Length 170cm Inner diameter 3.3cm Outer diameter 3.5cm Thickness 2mm Volume 1.9 Liter Thermal conductivity 400 at 25c Density 8960 kg/m^3 6
  • 21.
    Design & InstallationSteps. 21 Model LHE004 Volume 15 L Maximum work pressure 8 bars Maximum work temperature 99-degree Celsius 7 Pressure tank Recievoir
  • 22.
  • 23.
  • 24.
  • 25.
    Experiments and failures 1Mirror strips 25 comparison mirror strips curved mirror Light reflection 75% 95% cost low High Optical efficiency 55% 76% Total curved area 1.7 m2 1.9 m2
  • 26.
    Experiments and failures 2Acrylic cylinder with moveable piston 26
  • 27.
  • 28.
    Experiments and failures 3Plastic pressure tank 28 Model LHE004 Volume 15 L Maximum work pressure 8 bars Maximum work temperature 99-degree Celsius
  • 29.
  • 30.
    Results 30 Day Feed water PPM Duration (min) no cycles Avg Radiation(w/m2) Avg Tamb (c) Fresh water PPM Brine water PPM Vfresh (L) Vbrine (L) 1 1000 75 2 543 45.70 84 920 1.50 3.00 2 2000 115 3 705 38.20 167 1930 1.83 4.50 3 3000 60 2 550 37.10 250 3060 1.39 3.90 4 4000 77 3 780 35.00 300 3600 1.20 4.56 5 5000 88 2 557 40.00 416 4070 1.12 6.00
  • 31.
  • 32.
    Data Reduction 32 0 5 10 15 20 25 30 35 40 1000 20003000 4000 5000 6000 7000 8000 9000 10000 NOOFCYCLES RADIATION season Avg. radiation in season)w.hr/m^2/ day) Total no .of cycles/day winter 2900 9 Spring 5800 17 Summer 7900 24 autumn 5500 16 (Relation between no. of cycles and Radiation)
  • 33.
    Data Reduction 0 2 4 6 8 10 12 14 16 18 20 1000 20003000 4000 5000 PRODUCTIVITYL/DAY PPM ppm production L/d 1000 18 2000 16.68 3000 14.64 4000 13.44 5000 9.6 (Relation between PPM and Productivity) 33
  • 34.
    Project Outcomes 34 Season Productivity (liter/day) for 1.8m2 winter11 spring 20 summer 27 autumn 18 Total prod/year 6840 0 10 20 30 winter spring summer autumn Productivity (liter/day) for 1.8m2 • As the mean consumption of fresh water per person 3 liter per day, The system can provide fresh water for 6 persons.
  • 35.
    Project Outcomes 35 • Asthe mean consumption of fresh water per person 3 liter per day, The system can provide fresh water for 2300 persons. Season Productivity (liter/day) for field of 1000m2 winter 4066 spring 7400 summer 10000 autumn 6650 Total prod/year 2520000 0 2000 4000 6000 8000 10000 12000 winter spring summer autumn Productivity (liter/day) for field of 1000m2
  • 36.
    Comparison between electricaland thermal systems Feed (ppm) Solar system (liter/ day) Electric Pump (liter/day) 1000 18 58.32 2000 16.68 55.08 3000 14.64 50.7 4000 13.44 44.7 5000 9.6 36.72 0 10 20 30 40 50 60 70 1000 2000 3000 4000 5000 PRODUCTIVITYL/DAY PPM solar system electric system (Relation between productivity of elec. Pump and solar system per day) 36
  • 37.
    0 50 100 150 200 250 300 350 400 450 1000 2000 30004000 5000 FRESHWATERPPM FEED WATER PPM By solar system By electric Pump Comparison between electrical and thermal systems By solar system By electric Pump Feed (ppm) Fresh (ppm) Fresh (ppm) 1000 84 79 2000 167 158 3000 251 237 4000 307 298 5000 416 395 (Relation between ppm of fresh water for elec. pump and solar system) 37
  • 38.
    Future Recommendations 38 Makesure that there are no any air gaps between aluminum sheet because when temperature increase the air got hotter and cause increase in pressure which cause failure of tube glass. Using aluminum sheet inside evacuated tube enhance radiation absorption because it increases collecting area.. It is preferred to use curved mirror instead of mirror strips as it have noticed increase in efficiency. Consider in design that you have movable mechanism to fix the receiver tube in the focal because you might find mismatch in focal between theoretical and actual design. It is better to follow meteorological authority to be sure of sunny hours and rainy days.. Be careful while dealing with hot surfaces and use safety tools to avoid injury.
  • 39.