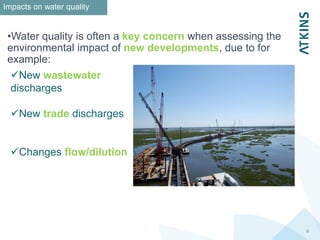
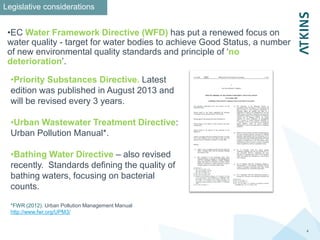
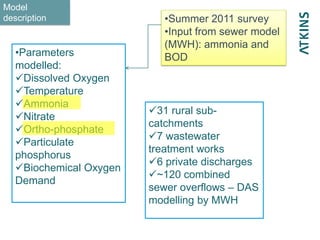
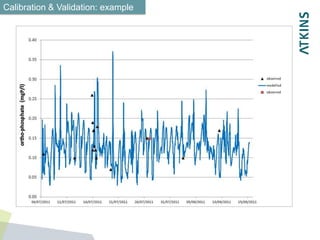
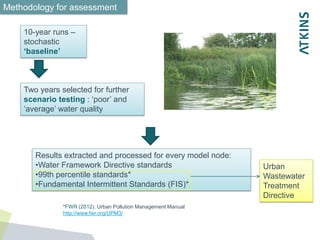
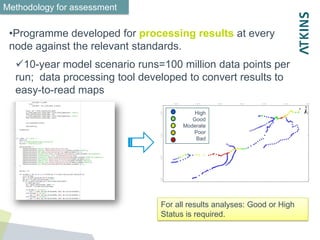
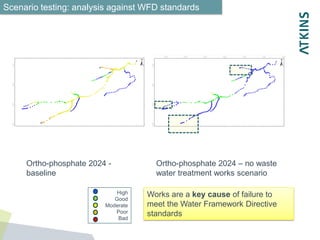
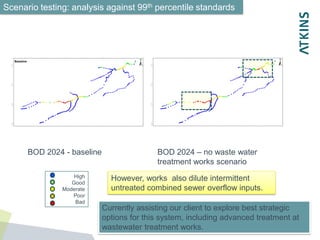
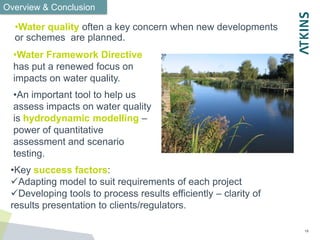
River water quality modelling using
Mike 11 Ecolab
DHI User Group meeting
13th May 2014
Presentation by:
Vera Jones
Introduction
2
3
Impacts on water quality
•Water quality is often a key concern when assessing the
environmental impact of new developments, due to for
example:
New wastewater
discharges
New trade discharges
Changes flow/dilution
4
•EC Water Framework Directive (WFD) has put a renewed focus on
water quality - target for water bodies to achieve Good Status, a number
of new environmental quality standards and principle of ‘no
deterioration’.
Legislative considerations
•Priority Substances Directive. Latest
edition was published in August 2013 and
will be revised every 3 years.
•Urban Wastewater Treatment Directive:
Urban Pollution Manual*.
•Bathing Water Directive – also revised
recently. Standards defining the quality of
bathing waters, focusing on bacterial
counts.
*FWR (2012). Urban Pollution Management Manual
http://www.fwr.org/UPM3/
Assessing water quality impacts
5
6
Range of options available:
Monitoring and visual
assessment of results
Simple mass balance
calculations
Assessing water quality impacts
Steady State models –
SIMCAT, QUAL-2K
Hydrodynamic models -
Mike 11 Ecolab.
Issues to
•Over the past years we have worked on several
hydrodynamic water quality models using Mike 11 Ecolab,
with a focus on dissolved oxygen and nutrient modelling.
Our hydrodynamic water quality modelling capability
•Hydrodynamic water quality models provide higher level of
detail on temporal and spatial resolution which is often
needed to assess the water quality impacts of:
oNew water resources schemes
oContinuous and intermittent discharges
Key tool to optimise water companies’ strategic
investments.
Effect of shading due to marginal vegetation
•Results in less light in the water column and less surface water cooling
Modification of standard equation to take into account localised
marginal vegetation
Variation in water clarity along a tidal river
•Significant variation in tidal rivers, both temporally and spatially.
Development of a series of equations to simulate variations in water
clarity based on changing water levels or salinity along the river
Taking into account the impacts of
periodic algal blooms
•Phytoplankton populations shrink and
expand during the year
Modification to the photosynthesis and
respiration equations to include a time-
varying chlorophyll determinand
Adapting models to fit each project requirements
Case study
9
Catchment understanding at the start of the project
Several wastewater treatment works
Storm discharges from
combined sewer
overflows
High nutrient load
Model
description
•Parameters
modelled:
Dissolved Oxygen
Temperature
Ammonia
Nitrate
Ortho-phosphate
Particulate
phosphorus
Biochemical Oxygen
Demand
•Summer 2011 survey
•Input from sewer model
(MWH): ammonia and
BOD
31 rural sub-
catchments
7 wastewater
treatment works
6 private discharges
~120 combined
sewer overflows – DAS
modelling by MWH
Calibration & Validation: example
10-year runs –
stochastic
‘baseline’
Methodology for assessment
Results extracted and processed for every model node:
•Water Framework Directive standards
•99th percentile standards*
•Fundamental Intermittent Standards (FIS)*
Two years selected for further
scenario testing : ‘poor’ and
‘average’ water quality
Urban
Wastewater
Treatment
Directive
*FWR (2012). Urban Pollution Management Manual
http://www.fwr.org/UPM3/
Methodology for assessment
•Programme developed for processing results at every
node against the relevant standards.
High
Good
Moderate
Poor
Bad
For all results analyses: Good or High
Status is required.
10-year model scenario runs=100 million data points per
run; data processing tool developed to convert results to
easy-to-read maps
Scenario testing: analysis against WFD standards
Ortho-phosphate 2024 -
baseline
Ortho-phosphate 2024 – no waste
water treatment works scenario
Works are a key cause of failure to
meet the Water Framework Directive
standards
High
Good
Moderate
Poor
Bad
Scenario testing: analysis against 99th percentile standards
BOD 2024 - baseline BOD 2024 – no waste water
treatment works scenario
However, works also dilute intermittent
untreated combined sewer overflow inputs.
High
Good
Moderate
Poor
Bad
Currently assisting our client to explore best strategic
options for this system, including advanced treatment at
wastewater treatment works.
Overview and Conclusion
17
18
•Water quality often a key concern when new developments
or schemes are planned.
•Water Framework Directive
has put a renewed focus on
impacts on water quality.
•An important tool to help us
assess impacts on water quality
is hydrodynamic modelling –
power of quantitative
assessment and scenario
testing.
Overview & Conclusion
•Key success factors:
Adapting model to suit requirements of each project
Developing tools to process results efficiently – clarity of
results presentation to clients/regulators.

River water quality modelling using MIKE 11 ECO Lab - Vera Jones (Atkins)

  • 1.
    River water qualitymodelling using Mike 11 Ecolab DHI User Group meeting 13th May 2014 Presentation by: Vera Jones
  • 2.
  • 3.
    3 Impacts on waterquality •Water quality is often a key concern when assessing the environmental impact of new developments, due to for example: New wastewater discharges New trade discharges Changes flow/dilution
  • 4.
    4 •EC Water FrameworkDirective (WFD) has put a renewed focus on water quality - target for water bodies to achieve Good Status, a number of new environmental quality standards and principle of ‘no deterioration’. Legislative considerations •Priority Substances Directive. Latest edition was published in August 2013 and will be revised every 3 years. •Urban Wastewater Treatment Directive: Urban Pollution Manual*. •Bathing Water Directive – also revised recently. Standards defining the quality of bathing waters, focusing on bacterial counts. *FWR (2012). Urban Pollution Management Manual http://www.fwr.org/UPM3/
  • 5.
  • 6.
    6 Range of optionsavailable: Monitoring and visual assessment of results Simple mass balance calculations Assessing water quality impacts Steady State models – SIMCAT, QUAL-2K Hydrodynamic models - Mike 11 Ecolab.
  • 7.
    Issues to •Over thepast years we have worked on several hydrodynamic water quality models using Mike 11 Ecolab, with a focus on dissolved oxygen and nutrient modelling. Our hydrodynamic water quality modelling capability •Hydrodynamic water quality models provide higher level of detail on temporal and spatial resolution which is often needed to assess the water quality impacts of: oNew water resources schemes oContinuous and intermittent discharges Key tool to optimise water companies’ strategic investments.
  • 8.
    Effect of shadingdue to marginal vegetation •Results in less light in the water column and less surface water cooling Modification of standard equation to take into account localised marginal vegetation Variation in water clarity along a tidal river •Significant variation in tidal rivers, both temporally and spatially. Development of a series of equations to simulate variations in water clarity based on changing water levels or salinity along the river Taking into account the impacts of periodic algal blooms •Phytoplankton populations shrink and expand during the year Modification to the photosynthesis and respiration equations to include a time- varying chlorophyll determinand Adapting models to fit each project requirements
  • 9.
  • 10.
    Catchment understanding atthe start of the project Several wastewater treatment works Storm discharges from combined sewer overflows High nutrient load
  • 11.
    Model description •Parameters modelled: Dissolved Oxygen Temperature Ammonia Nitrate Ortho-phosphate Particulate phosphorus Biochemical Oxygen Demand •Summer2011 survey •Input from sewer model (MWH): ammonia and BOD 31 rural sub- catchments 7 wastewater treatment works 6 private discharges ~120 combined sewer overflows – DAS modelling by MWH
  • 12.
  • 13.
    10-year runs – stochastic ‘baseline’ Methodologyfor assessment Results extracted and processed for every model node: •Water Framework Directive standards •99th percentile standards* •Fundamental Intermittent Standards (FIS)* Two years selected for further scenario testing : ‘poor’ and ‘average’ water quality Urban Wastewater Treatment Directive *FWR (2012). Urban Pollution Management Manual http://www.fwr.org/UPM3/
  • 14.
    Methodology for assessment •Programmedeveloped for processing results at every node against the relevant standards. High Good Moderate Poor Bad For all results analyses: Good or High Status is required. 10-year model scenario runs=100 million data points per run; data processing tool developed to convert results to easy-to-read maps
  • 15.
    Scenario testing: analysisagainst WFD standards Ortho-phosphate 2024 - baseline Ortho-phosphate 2024 – no waste water treatment works scenario Works are a key cause of failure to meet the Water Framework Directive standards High Good Moderate Poor Bad
  • 16.
    Scenario testing: analysisagainst 99th percentile standards BOD 2024 - baseline BOD 2024 – no waste water treatment works scenario However, works also dilute intermittent untreated combined sewer overflow inputs. High Good Moderate Poor Bad Currently assisting our client to explore best strategic options for this system, including advanced treatment at wastewater treatment works.
  • 17.
  • 18.
    18 •Water quality oftena key concern when new developments or schemes are planned. •Water Framework Directive has put a renewed focus on impacts on water quality. •An important tool to help us assess impacts on water quality is hydrodynamic modelling – power of quantitative assessment and scenario testing. Overview & Conclusion •Key success factors: Adapting model to suit requirements of each project Developing tools to process results efficiently – clarity of results presentation to clients/regulators.