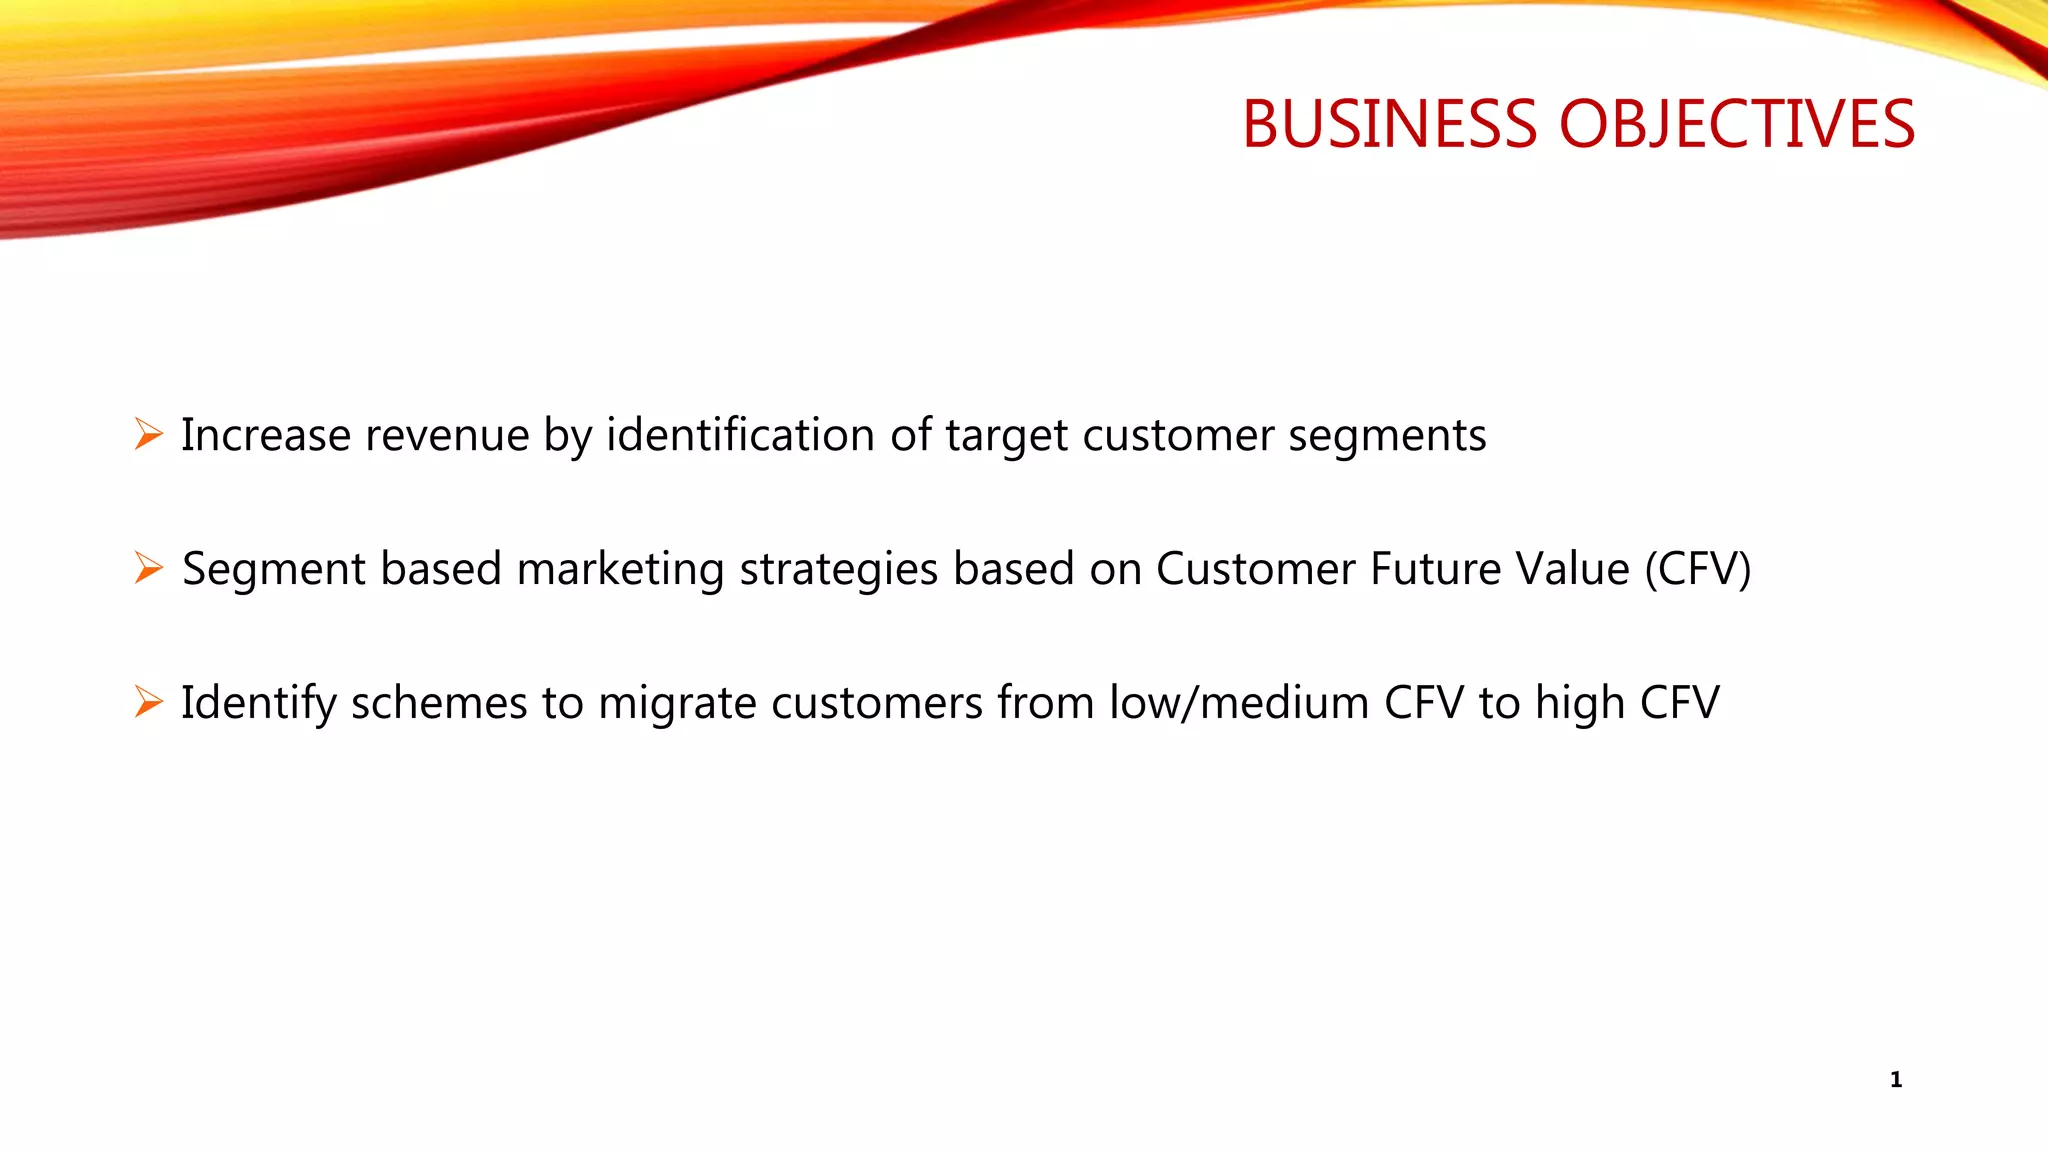
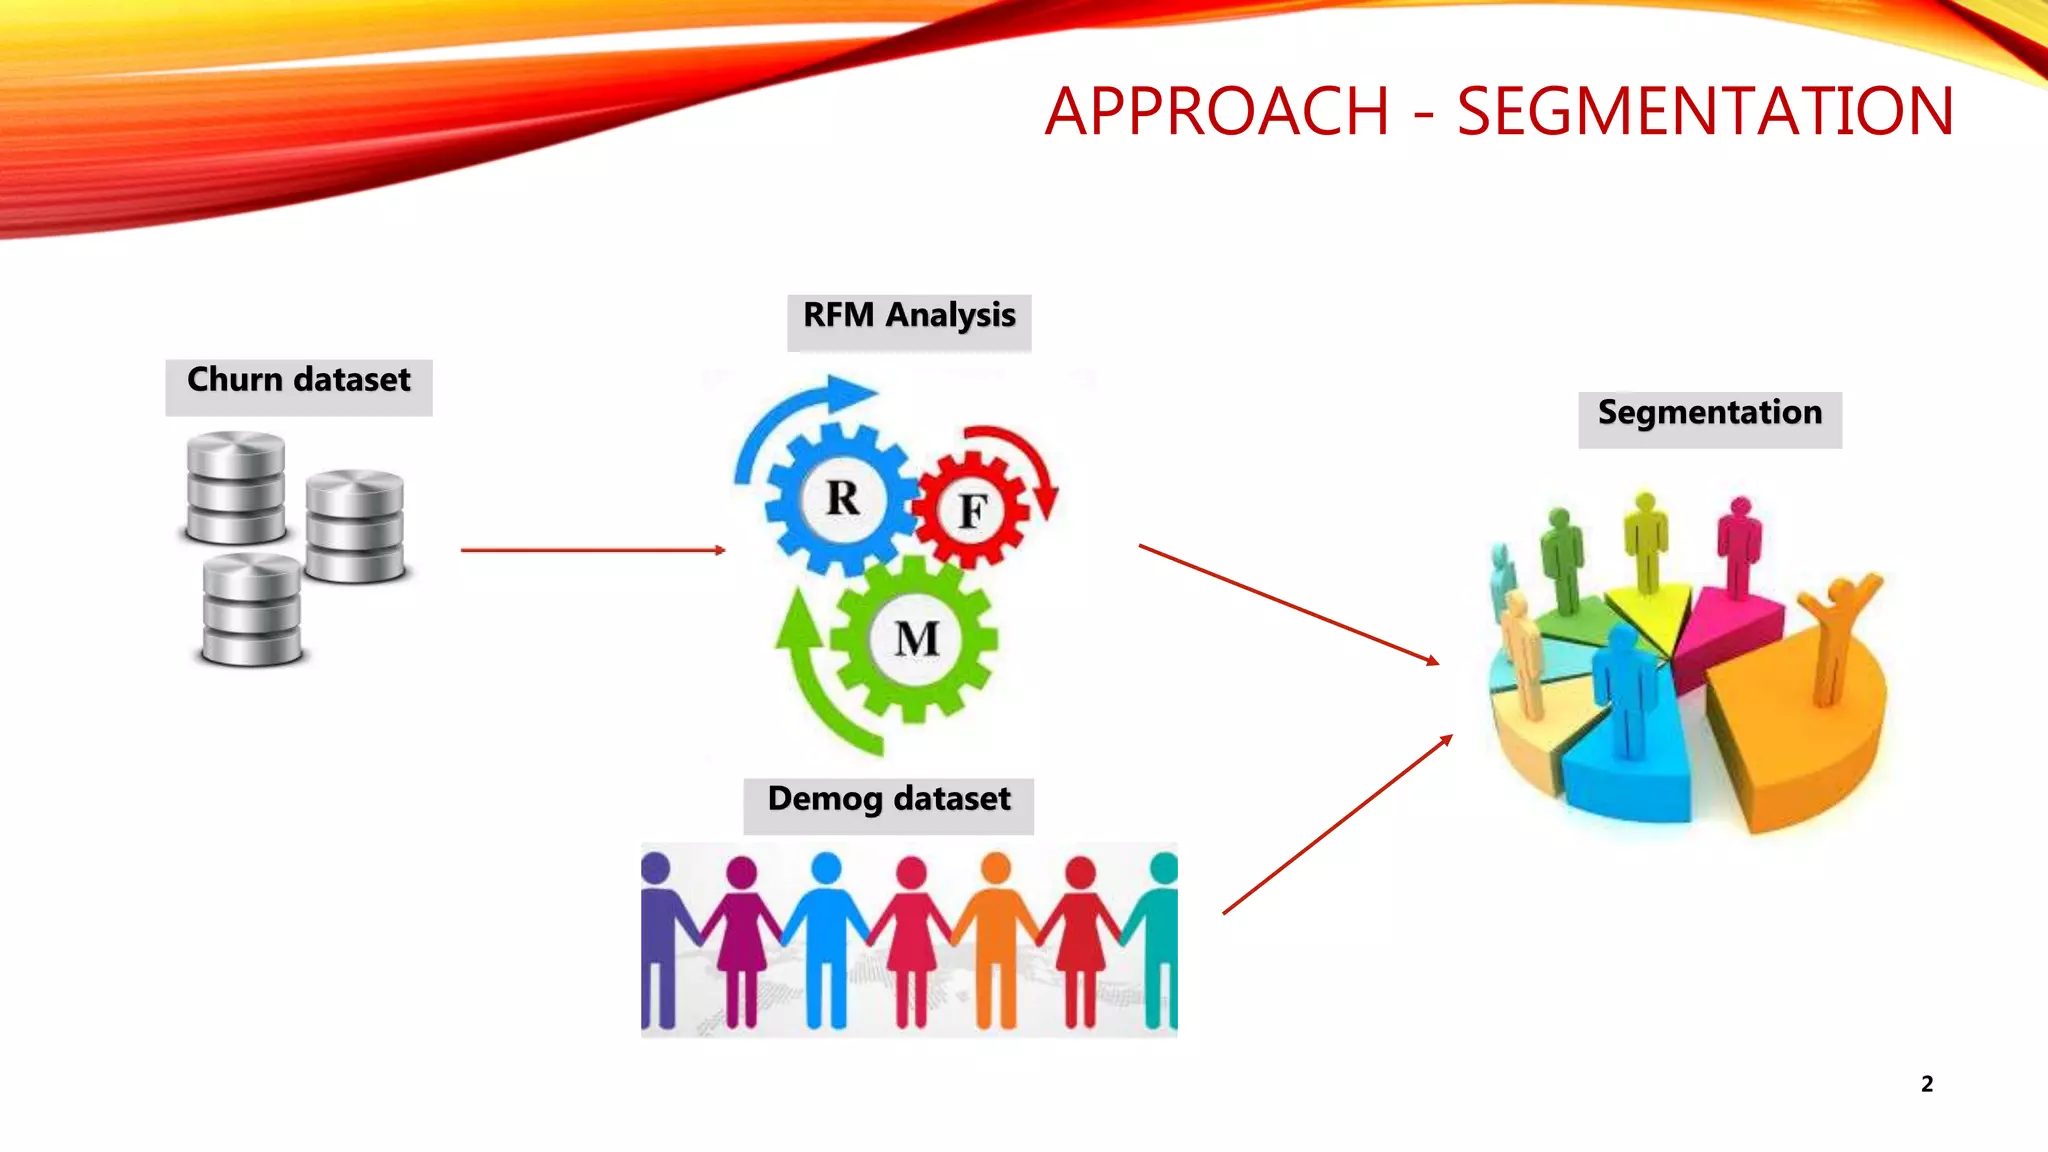
CUSTOMER LIFETIME VALUE
Team 3
Segmentation – Bhoir, Sapna; Singhi, Mohit; Siyoum, Admas
Modeling – Chowdavarapu, Indra; D Vivek; Musuku, Prashanth Reddy
Presentation – Bhargava, Juhi; Kawitkar, Nachiket; Varadarajan, Kisorkumar
If we don’t sell it, you won’t need itWebsite http://customer-ltv.weebly.com
BUSINESS OBJECTIVES
 Increase revenue by identification of target customer segments
 Segment based marketing strategies based on Customer Future Value (CFV)
 Identify schemes to migrate customers from low/medium CFV to high CFV
1
APPROACH - SEGMENTATION
Churn dataset
Segmentation
Demog dataset
RFM Analysis
2
RESULTS – SEGMENTATION USING BASE VARIABLES
Legend Variable with baseline value > 100 Variable with baseline value < 100 3
RESULTS – PROFILING USING DESCRIPTOR VARIABLES
4
INSIGHTS FROM SEGMENTATION
 Happy segments
 Segments 1 and 5 have the lowest churn rate
 Other variables like home value income, purchase, purchase count, RFM are above baseline
 Unhappy segments
 Segments 2 and 7 have the highest churn rate
 Other variables like home value income, purchase amount & count, RFM are below baseline
 Availability of email address in segment 2 high with low average number of marketing emails
 High Call in count with low Call out count
 Important findings
 Segments 3 and 9 have a very high churn rate
 Other variables like home value income, purchase, purchase count, RFM are above baseline
 Relook at strategy adopted with these segments due to which churn rate is high
5
INSIGHTS FROM SEGMENTATION
6
Legend 102 < Value < 120 Value >= 120
…INSIGHTS FROM SEGMENTATION RESULTS
Segment 2 has disproportionately larger share of customers with Bronze Tier
Segments 1, 3 and 5 have disproportionately larger share of customers with Gold, Platinum and
Diamond Tiers
Segment 5 also has disproportionately larger share of customers with Silver Tier
Customers with Bronze Tier represent over 64 percent of the total number of customers Appendix-
table analysis
Customers with Silver Tier represent over 20 percent of the total number of customers
☼Focusing marketing resources to migrate bronze and silver tier customers to the next
tiers can improve the bottom line
7
APPROACH - MODELING
Churn dataset
Margin dataset
Modeling
Score on
Holdout dataset
Customer Future
Value
Profiling
8
Demog
dataset
Data prep on
Holdout dataset
Customer
Future
Value
RESULTS - MODELING
High
High
Low Margin $
RetentionLikelihood
Q3 - Med CFV
• CFV - $ (1,174) to $ 478
• No. of Accounts – 9,112
Q4 - High CFV
• CFV - $ 416 to $ 8,290
• No. of Accounts – 18,609
Q1 - Low CFV
• CFV - $ (981) to $ 403
• No. of Accounts – 18,455
Q2 - Med CFV
• CFV - $ 5 to $ 6,977
• No. of Accounts – 9,258
9
Future Margin Value Split Point $195
Probability of Retention Split 0.91
CFV DISTRIBUTION ANALYSIS
10
Total Negative CFV $ (237,599)
Total Positive CFV $ 37,884,709
Net CFV $ 37,647,109
INSIGHTS & FINDINGS-MODELING
CFV Value State wise Top 5 CFV
11
INSIGHTS & FINDINGS-MODELING
Average CFV Value State wise Top 5 Avg. CFV
12
INSIGHTS & FINDINGS
13
RECOMMENDATIONS
Quadrant 1
 Low Response count(response to mailers)
 Low Length of Residence, Home value
 Low RFM score
 Low Call out compared to high Call in
Quadrant 1 Recommendations
 Identify & focus on customers with high Length of residence
 Better handling of Call in from customers
14
RECOMMENDATIONS
Quadrant 2
 Low Length of residence
 High Average purchases count compared to Q4
 Home value and Household income (course & fine) higher than
the values in Q4
 Assets value are nearly equal to home value in Q4
Quadrant 2 Recommendations
 Cross-sell to increase retention and thereby revenues
 Customers characteristics similar to Q4, appropriate schemes will
retain customers
15
RECOMMENDATIONS
Quadrant 3
 Low - High Call in count with low Call out count
 Assets, Home value, Household Income (course & fine) similar to
Q1
 Customers response rate is high
Quadrant 3 Recommendations
 Leverage Call in from customers
 Upsell to increase margins
16
RECOMMENDATIONS
Quadrant 4
 Significantly higher Mail count with high Response count
 Low order count compared to Q3
 Purchase amount high with a slightly lower avg purchase count
Quadrant 4 Recommendations
 Target customers with high Length of Residence and high Purchase
amount life
 Retain loyal customers with sustained quality customer service
 Marketing scheme to increase revenues and incurring less cost
17
RECOMMENDATIONS
18
 Target customers with high Length of Residence and high Purchase amount life
 Cross-sell to customers in Quadrant 2 to increase retention and thereby revenues
 Upsell to customers in Quadrant 3 to increase margins
 Retain loyal customers with sustained high quality customer service
 Marketing scheme to increase revenues and incurring less cost
 Leverage Call in from customers
FUTURE APPROACH - MODELING
Churn
dataset
Margin
dataset
Modeling
Score on
Holdout
dataset
Customer
Future
Value
Segmentation
Demog dataset
RFM Analysis
Churn dataset
Predict the segment to
which each customer
belong to
19
Thank You
20
APPENDIX-FREQUENCY OF STATES
21
APPENDIX-SEGMENT PROFILING
Segment Profiling
22
APPENDIX-TABLE ANALYSIS
1-Bronze 2-Silver 3-Gold 4-Platinum 5-Diamond
Segment Id
Frequency
Percent 5.64 2.57 1.76 0.42 0.48 10.88
Row Pct 51.86 23.59 16.21 3.9 4.43
Col Pct 8.78 12.71 15.69 18.73 24.17
Frequency 28520 6007 2590 460 285 37862
Percent 11.87 2.5 1.08 0.19 0.12 15.75
Row Pct 75.33 15.87 6.84 1.21 0.75
Col Pct 18.45 12.37 9.58 8.44 5.94
Frequency 8999 2799 2023 507 685 15013
Percent 3.74 1.16 0.84 0.21 0.28 6.25
Row Pct 59.94 18.64 13.47 3.38 4.56
Col Pct 5.82 5.76 7.49 9.3 14.29
Frequency 23970 7045 3330 664 354 35363
Percent 9.97 2.93 1.39 0.28 0.15 14.71
Row Pct 67.78 19.92 9.42 1.88 1
Col Pct 15.51 14.51 12.32 12.18 7.38
Frequency 16349 7425 4664 966 836 30240
Percent 6.8 3.09 1.94 0.4 0.35 12.58
Row Pct 54.06 24.55 15.42 3.19 2.76
Col Pct 10.58 15.29 17.26 17.72 17.43
Frequency 12407 4428 2123 375 245 19578
Percent 5.16 1.84 0.88 0.16 0.1 8.15
Row Pct 63.37 22.62 10.84 1.92 1.25
Col Pct 8.03 9.12 7.86 6.88 5.11
Frequency 18712 4163 2147 379 284 25685
Percent 7.78 1.73 0.89 0.16 0.12 10.69
Row Pct 72.85 16.21 8.36 1.48 1.11
Col Pct 12.11 8.57 7.95 6.95 5.92
Frequency 18702 6730 3483 605 402 29922
Percent 7.78 2.8 1.45 0.25 0.17 12.45
Row Pct 62.5 22.49 11.64 2.02 1.34
Col Pct 12.1 13.86 12.89 11.1 8.38
Frequency 13320 3787 2424 475 545 20551
Percent 5.54 1.58 1.01 0.2 0.23 8.55
Row Pct 64.81 18.43 11.8 2.31 2.65
Col Pct 8.62 7.8 8.97 8.71 11.37
Frequency
Percent 64.29 20.2 11.24 2.27 1.99 100
48555 27023 5452 4795 240368Total
5
6
7
8
9
154543
1
2
3
4
tier
Total
13564 6171 4239 1021 1159 26154
Table of Segment Id by tier
Table Analysis - The Frequency Procedure
23
Back
APPENDIX-CHURN MODELING OUTPUT
24
APPENDIX-MARGIN MODELING OUTPUT
25

Presentation on Customer Lifetime Value

  • 1.
    CUSTOMER LIFETIME VALUE Team3 Segmentation – Bhoir, Sapna; Singhi, Mohit; Siyoum, Admas Modeling – Chowdavarapu, Indra; D Vivek; Musuku, Prashanth Reddy Presentation – Bhargava, Juhi; Kawitkar, Nachiket; Varadarajan, Kisorkumar If we don’t sell it, you won’t need itWebsite http://customer-ltv.weebly.com
  • 2.
    BUSINESS OBJECTIVES  Increaserevenue by identification of target customer segments  Segment based marketing strategies based on Customer Future Value (CFV)  Identify schemes to migrate customers from low/medium CFV to high CFV 1
  • 3.
    APPROACH - SEGMENTATION Churndataset Segmentation Demog dataset RFM Analysis 2
  • 4.
    RESULTS – SEGMENTATIONUSING BASE VARIABLES Legend Variable with baseline value > 100 Variable with baseline value < 100 3
  • 5.
    RESULTS – PROFILINGUSING DESCRIPTOR VARIABLES 4
  • 6.
    INSIGHTS FROM SEGMENTATION Happy segments  Segments 1 and 5 have the lowest churn rate  Other variables like home value income, purchase, purchase count, RFM are above baseline  Unhappy segments  Segments 2 and 7 have the highest churn rate  Other variables like home value income, purchase amount & count, RFM are below baseline  Availability of email address in segment 2 high with low average number of marketing emails  High Call in count with low Call out count  Important findings  Segments 3 and 9 have a very high churn rate  Other variables like home value income, purchase, purchase count, RFM are above baseline  Relook at strategy adopted with these segments due to which churn rate is high 5
  • 7.
    INSIGHTS FROM SEGMENTATION 6 Legend102 < Value < 120 Value >= 120
  • 8.
    …INSIGHTS FROM SEGMENTATIONRESULTS Segment 2 has disproportionately larger share of customers with Bronze Tier Segments 1, 3 and 5 have disproportionately larger share of customers with Gold, Platinum and Diamond Tiers Segment 5 also has disproportionately larger share of customers with Silver Tier Customers with Bronze Tier represent over 64 percent of the total number of customers Appendix- table analysis Customers with Silver Tier represent over 20 percent of the total number of customers ☼Focusing marketing resources to migrate bronze and silver tier customers to the next tiers can improve the bottom line 7
  • 9.
    APPROACH - MODELING Churndataset Margin dataset Modeling Score on Holdout dataset Customer Future Value Profiling 8 Demog dataset Data prep on Holdout dataset Customer Future Value
  • 10.
    RESULTS - MODELING High High LowMargin $ RetentionLikelihood Q3 - Med CFV • CFV - $ (1,174) to $ 478 • No. of Accounts – 9,112 Q4 - High CFV • CFV - $ 416 to $ 8,290 • No. of Accounts – 18,609 Q1 - Low CFV • CFV - $ (981) to $ 403 • No. of Accounts – 18,455 Q2 - Med CFV • CFV - $ 5 to $ 6,977 • No. of Accounts – 9,258 9 Future Margin Value Split Point $195 Probability of Retention Split 0.91
  • 11.
    CFV DISTRIBUTION ANALYSIS 10 TotalNegative CFV $ (237,599) Total Positive CFV $ 37,884,709 Net CFV $ 37,647,109
  • 12.
    INSIGHTS & FINDINGS-MODELING CFVValue State wise Top 5 CFV 11
  • 13.
    INSIGHTS & FINDINGS-MODELING AverageCFV Value State wise Top 5 Avg. CFV 12
  • 14.
  • 15.
    RECOMMENDATIONS Quadrant 1  LowResponse count(response to mailers)  Low Length of Residence, Home value  Low RFM score  Low Call out compared to high Call in Quadrant 1 Recommendations  Identify & focus on customers with high Length of residence  Better handling of Call in from customers 14
  • 16.
    RECOMMENDATIONS Quadrant 2  LowLength of residence  High Average purchases count compared to Q4  Home value and Household income (course & fine) higher than the values in Q4  Assets value are nearly equal to home value in Q4 Quadrant 2 Recommendations  Cross-sell to increase retention and thereby revenues  Customers characteristics similar to Q4, appropriate schemes will retain customers 15
  • 17.
    RECOMMENDATIONS Quadrant 3  Low- High Call in count with low Call out count  Assets, Home value, Household Income (course & fine) similar to Q1  Customers response rate is high Quadrant 3 Recommendations  Leverage Call in from customers  Upsell to increase margins 16
  • 18.
    RECOMMENDATIONS Quadrant 4  Significantlyhigher Mail count with high Response count  Low order count compared to Q3  Purchase amount high with a slightly lower avg purchase count Quadrant 4 Recommendations  Target customers with high Length of Residence and high Purchase amount life  Retain loyal customers with sustained quality customer service  Marketing scheme to increase revenues and incurring less cost 17
  • 19.
    RECOMMENDATIONS 18  Target customerswith high Length of Residence and high Purchase amount life  Cross-sell to customers in Quadrant 2 to increase retention and thereby revenues  Upsell to customers in Quadrant 3 to increase margins  Retain loyal customers with sustained high quality customer service  Marketing scheme to increase revenues and incurring less cost  Leverage Call in from customers
  • 20.
    FUTURE APPROACH -MODELING Churn dataset Margin dataset Modeling Score on Holdout dataset Customer Future Value Segmentation Demog dataset RFM Analysis Churn dataset Predict the segment to which each customer belong to 19
  • 21.
  • 22.
  • 23.
  • 24.
    APPENDIX-TABLE ANALYSIS 1-Bronze 2-Silver3-Gold 4-Platinum 5-Diamond Segment Id Frequency Percent 5.64 2.57 1.76 0.42 0.48 10.88 Row Pct 51.86 23.59 16.21 3.9 4.43 Col Pct 8.78 12.71 15.69 18.73 24.17 Frequency 28520 6007 2590 460 285 37862 Percent 11.87 2.5 1.08 0.19 0.12 15.75 Row Pct 75.33 15.87 6.84 1.21 0.75 Col Pct 18.45 12.37 9.58 8.44 5.94 Frequency 8999 2799 2023 507 685 15013 Percent 3.74 1.16 0.84 0.21 0.28 6.25 Row Pct 59.94 18.64 13.47 3.38 4.56 Col Pct 5.82 5.76 7.49 9.3 14.29 Frequency 23970 7045 3330 664 354 35363 Percent 9.97 2.93 1.39 0.28 0.15 14.71 Row Pct 67.78 19.92 9.42 1.88 1 Col Pct 15.51 14.51 12.32 12.18 7.38 Frequency 16349 7425 4664 966 836 30240 Percent 6.8 3.09 1.94 0.4 0.35 12.58 Row Pct 54.06 24.55 15.42 3.19 2.76 Col Pct 10.58 15.29 17.26 17.72 17.43 Frequency 12407 4428 2123 375 245 19578 Percent 5.16 1.84 0.88 0.16 0.1 8.15 Row Pct 63.37 22.62 10.84 1.92 1.25 Col Pct 8.03 9.12 7.86 6.88 5.11 Frequency 18712 4163 2147 379 284 25685 Percent 7.78 1.73 0.89 0.16 0.12 10.69 Row Pct 72.85 16.21 8.36 1.48 1.11 Col Pct 12.11 8.57 7.95 6.95 5.92 Frequency 18702 6730 3483 605 402 29922 Percent 7.78 2.8 1.45 0.25 0.17 12.45 Row Pct 62.5 22.49 11.64 2.02 1.34 Col Pct 12.1 13.86 12.89 11.1 8.38 Frequency 13320 3787 2424 475 545 20551 Percent 5.54 1.58 1.01 0.2 0.23 8.55 Row Pct 64.81 18.43 11.8 2.31 2.65 Col Pct 8.62 7.8 8.97 8.71 11.37 Frequency Percent 64.29 20.2 11.24 2.27 1.99 100 48555 27023 5452 4795 240368Total 5 6 7 8 9 154543 1 2 3 4 tier Total 13564 6171 4239 1021 1159 26154 Table of Segment Id by tier Table Analysis - The Frequency Procedure 23 Back
  • 25.
  • 26.