forts to retain customers represent a crucial customer relationship management (CRM) strategy in every business, offering the potential to enhance profits, particularly for small and medium enterprises (SMEs). In the context of this study, which focuses on the transaction dataset of retailers in a developing market, Indonesia, the emphasis has predominantly been on customer attraction rather than the implementation of customer retention strategies. The primary objective of this research was to scrutinize customer transaction data within the dataset. The K-Means clustering (KMC) method, integrated with recency, frequency, and monetary (RFM) attributes, was employed to classify customers and formulate effective strategies for customer retention. Conducted through a descriptive research method with a quantitative approach, the study involved sequential stages of data preprocessing and RFM analysis for comprehensive data analysis. The outcomes revealed the identification of 5 distinct clusters with associated strategies based on the RFM scores obtained. These strategies, tailored to each cluster, serve as valuable insights in industrial and innovation for marketing and business strategic teams, offering practical approaches to customer retention that can lead to increased benefits for SMEs.
![TELKOMNIKA Telecommunication Computing Electronics and Control
Vol. 23, No. 2, April 2025, pp. 435~446
ISSN: 1693-6930, DOI: 10.12928/TELKOMNIKA.v23i2.26044 435
Journal homepage: http://telkomnika.uad.ac.id
K-Means clustering interpretation using recency, frequency,
and monetary factor for retail customers segmentation
Agung Nugraha1
, Yutika Amelia Effendi2
, Nicholas1
, Zejin Tao1
, Mokh Afifuddin3
, Nania Nuzulita4
1
Department of Industrial and Data Engineering, College of Engineering, Pukyong National University, Busan, South Korea
2
Robotics and Artificial Intelligence Engineering, Faculty of Advanced Technology and Multidiscipline, Universitas Airlangga,
Surabaya, Indonesia
3
Akademi Komunitas Industri Tekstil dan Produk Tekstil Surakarta, Surakarta, Indonesia
4
Information Systems, Faculty of Science and Technology, Universitas Airlangga, Surabaya, Indonesia
Article Info ABSTRACT
Article history:
Received Feb 2, 2024
Revised Jan 10, 2025
Accepted Jan 23, 2025
Efforts to retain customers represent a crucial customer relationship
management (CRM) strategy in every business, offering the potential to
enhance profits, particularly for small and medium enterprises (SMEs). In
the context of this study, which focuses on the transaction dataset of retailers
in a developing market, Indonesia, the emphasis has predominantly been on
customer attraction rather than the implementation of customer retention
strategies. The primary objective of this research was to scrutinize customer
transaction data within the dataset. The K-Means clustering (KMC) method,
integrated with recency, frequency, and monetary (RFM) attributes, was
employed to classify customers and formulate effective strategies for
customer retention. Conducted through a descriptive research method with a
quantitative approach, the study involved sequential stages of data
preprocessing and RFM analysis for comprehensive data analysis. The
outcomes revealed the identification of 5 distinct clusters with associated
strategies based on the RFM scores obtained. These strategies, tailored to
each cluster, serve as valuable insights in industrial and innovation for
marketing and business strategic teams, offering practical approaches to
customer retention that can lead to increased benefits for SMEs.
Keywords:
Customer segmentation
Industrial and innovation
K-Means algorithm
Machine learning
Recency, frequency, and
monetary analysis
Small and medium enterprises
This is an open access article under the CC BY-SA license.
Corresponding Author:
Yutika Amelia Effendi
Robotics and Artificial Intelligence Engineering, Faculty of Advanced Technology and Multidiscipline
Universitas Airlangga
St. Dr. Ir. H. Soekarno UNAIR Kampus C, Mulyorejo, Surabaya, East Java 60115, Indonesia
Email: yutika.effendi@ftmm.unair.ac.id
1. INTRODUCTION
In today’s competitive business landscape, small and medium enterprises (SMEs) find themselves
navigating a complex terrain, where the pursuit of sustainable growth is intricately tied to the twin challenges
of customer acquisition and revenue expansion [1]. Amidst intense competition and ever-evolving consumer
preferences, SMEs must not only strive to attract new customers but also strategically secure the ongoing
loyalty and engagement of their existing customer base [2]. This duality of challenges underscores the critical
importance of customer-centric approaches in shaping the trajectory of SMEs.
Following the Pareto principle, it’s noteworthy that 20% of customers significantly contribute more
to the company’s revenue than the remaining 80% [3]. This phenomenon is explained by the fact that
obtaining a new customer can incur expenses five times higher than maintaining an existing one [4]. A mere
5% increase in customer retention can lead to profit boosts ranging from 25% to 95%. Selling to an existing](https://image.slidesharecdn.com/16id26044-250625065127-9cb64b2c/85/K-Means-clustering-interpretation-using-recency-frequency-and-monetary-factor-for-retail-customers-segmentation-1-320.jpg)
![TELKOMNIKA Telecommunication Computing Electronics and Control
Vol. 23, No. 2, April 2025, pp. 435~446
ISSN: 1693-6930, DOI: 10.12928/TELKOMNIKA.v23i2.26044 435
Journal homepage: http://telkomnika.uad.ac.id
K-Means clustering interpretation using recency, frequency,
and monetary factor for retail customers segmentation
Agung Nugraha1
, Yutika Amelia Effendi2
, Nicholas1
, Zejin Tao1
, Mokh Afifuddin3
, Nania Nuzulita4
1
Department of Industrial and Data Engineering, College of Engineering, Pukyong National University, Busan, South Korea
2
Robotics and Artificial Intelligence Engineering, Faculty of Advanced Technology and Multidiscipline, Universitas Airlangga,
Surabaya, Indonesia
3
Akademi Komunitas Industri Tekstil dan Produk Tekstil Surakarta, Surakarta, Indonesia
4
Information Systems, Faculty of Science and Technology, Universitas Airlangga, Surabaya, Indonesia
Article Info ABSTRACT
Article history:
Received Feb 2, 2024
Revised Jan 10, 2025
Accepted Jan 23, 2025
Efforts to retain customers represent a crucial customer relationship
management (CRM) strategy in every business, offering the potential to
enhance profits, particularly for small and medium enterprises (SMEs). In
the context of this study, which focuses on the transaction dataset of retailers
in a developing market, Indonesia, the emphasis has predominantly been on
customer attraction rather than the implementation of customer retention
strategies. The primary objective of this research was to scrutinize customer
transaction data within the dataset. The K-Means clustering (KMC) method,
integrated with recency, frequency, and monetary (RFM) attributes, was
employed to classify customers and formulate effective strategies for
customer retention. Conducted through a descriptive research method with a
quantitative approach, the study involved sequential stages of data
preprocessing and RFM analysis for comprehensive data analysis. The
outcomes revealed the identification of 5 distinct clusters with associated
strategies based on the RFM scores obtained. These strategies, tailored to
each cluster, serve as valuable insights in industrial and innovation for
marketing and business strategic teams, offering practical approaches to
customer retention that can lead to increased benefits for SMEs.
Keywords:
Customer segmentation
Industrial and innovation
K-Means algorithm
Machine learning
Recency, frequency, and
monetary analysis
Small and medium enterprises
This is an open access article under the CC BY-SA license.
Corresponding Author:
Yutika Amelia Effendi
Robotics and Artificial Intelligence Engineering, Faculty of Advanced Technology and Multidiscipline
Universitas Airlangga
St. Dr. Ir. H. Soekarno UNAIR Kampus C, Mulyorejo, Surabaya, East Java 60115, Indonesia
Email: yutika.effendi@ftmm.unair.ac.id
1. INTRODUCTION
In today’s competitive business landscape, small and medium enterprises (SMEs) find themselves
navigating a complex terrain, where the pursuit of sustainable growth is intricately tied to the twin challenges
of customer acquisition and revenue expansion [1]. Amidst intense competition and ever-evolving consumer
preferences, SMEs must not only strive to attract new customers but also strategically secure the ongoing
loyalty and engagement of their existing customer base [2]. This duality of challenges underscores the critical
importance of customer-centric approaches in shaping the trajectory of SMEs.
Following the Pareto principle, it’s noteworthy that 20% of customers significantly contribute more
to the company’s revenue than the remaining 80% [3]. This phenomenon is explained by the fact that
obtaining a new customer can incur expenses five times higher than maintaining an existing one [4]. A mere
5% increase in customer retention can lead to profit boosts ranging from 25% to 95%. Selling to an existing](https://image.slidesharecdn.com/16id26044-250625065127-9cb64b2c/75/K-Means-clustering-interpretation-using-recency-frequency-and-monetary-factor-for-retail-customers-segmentation-1-2048.jpg)
![ ISSN: 1693-6930
TELKOMNIKA Telecommun Comput El Control, Vol. 23, No. 2, April 2025: 435-446
436
customer has a success rate of 60-70%, while with new customers, it is only 5-20% [5]. Moreover, customers
who are loyal demonstrate a probability five times greater of making repeat purchases, four times more
inclined to recommend to others, and seven times more prone to trying a new product or service [6].
Given the significance of prioritizing customer retention over acquiring new customers to enhance
company profits, the implementation of a customer segmentation model becomes imperative [7]. Customer
segmentation involves utilizing various distinctive customer characteristics to assist business professionals in
tailoring marketing strategies, recognizing trends, planning product development, advertising campaigns, and
delivering relevant products [8]. This approach enables personalized messaging to individuals, facilitating
more effective communication with targeted groups. The typical attributes employed in customer
segmentation include location, age, gender, income, lifestyle, and past purchase behavior [9].
This study aims to focus on a pivotal question on how SMEs can increase revenue by deepening
their relationships with customers. The objectives of this study are twofold. Firstly, we aim to determine
customer segmentation within the transaction dataset of retailers in a developing market, Indonesia by
implementing the recency, frequency, and monetary (RFM) method in conjunction with K-Means clustering
(KMC). Secondly, we seek to provide insights into the interpretation of customer clustering assignments by
leveraging the RFM factor.
In this study, segmentation is carried out using behavioral data, which is easily accessible and
consistently evolves, providing insights into the ongoing changes in customer purchase history. The widely
recognized RFM analysis is utilized as a methodology for assessing customers based on their purchasing
behavior [10]. A scoring system is devised to assess individual RFM scores, enabling the anticipation of
future patterns by examining the customer’s present and past histories [11]. Importantly, it has been observed
that the scores for the three RFM factors exhibit a direct correlation with the customer’s lifetime and
retention [12]. After computing the values for RFM, the K-Means algorithm is employed on these variables
to generate clusters within the customer base. Analyzing the behavior of each cluster aids in identifying
groups of customers that contribute more profits to the company. With the identification of customer clusters,
understanding the distinctions between these groups becomes essential. A comprehensive analysis of the
clusters is conducted to facilitate the identification of target customers and tailor appropriate promotions and
offers to them. The resultant outcome of this proposed approach is a meaningful customer segmentation that
proves beneficial for the marketing and business strategic teams in SMEs. The structure of the document is
outlined as follows: section 2 explores the literature review, sections 3 and 4 present the methodologies,
experimental results, and discussion, respectively, while section 5 provides the conclusion of this research.
2. RELATED WORKS
In this section, we will conduct a literature review examining previous research on customer
segmentation. The discussion will emphasize significant discoveries and perspectives gleaned from prior
studies in this domain.
2.1. Customer segmentation
Segmentation remains a crucial marketing concept, particularly within the framework of relationship
marketing. Enhancing customer relationships becomes more compelling, yielding a deeper understanding of
customer needs. Segmentation involves categorizing customers into clusters with loyalty distinctions,
forming the basis for a tailored marketing strategy. Customer segmentation stands out as an initial step in
shaping a business model [13]. This customer segmentation aligns with the principles of customer
relationship management (CRM), a strategic approach that seeks to optimize profits and customer
satisfaction, ultimately elevating the value of customer loyalty [14]. The objective of CRM is for businesses
to comprehend customer needs, fostering close, positive, and transparent business relationships and
communication, thereby mitigating the risk of customers shifting to competing companies [15].
2.2. Recency, frequency, and monetary analysis
RFM analysis emerge as a powerful and established method within the field of database marketing.
Widely utilized, it involves the ranking of customers based on their historical purchasing patterns, proving to
be invaluable in diverse domains like online purchases and retailing. This approach adeptly classifies
customers by considering three crucial dimensions: recency (R), frequency (F), and monetary (M), providing
a comprehensive means of comprehending and segmenting customer behavior. RFM analysis is particularly
useful in scenarios with a large customer base, providing businesses with actionable insights for targeted
strategies and personalized marketing approaches [16], [17].
Recency (R), referring to the timing of the customer’s most recent purchase, is quantified by the
number of days between two transactions. A lower recency value indicates frequent visits from the customer](https://image.slidesharecdn.com/16id26044-250625065127-9cb64b2c/85/K-Means-clustering-interpretation-using-recency-frequency-and-monetary-factor-for-retail-customers-segmentation-2-320.jpg)
![TELKOMNIKA Telecommun Comput El Control
K-Means clustering interpretation using recency, frequency, and monetary factor for … (Agung Nugraha)
437
within a brief timeframe, while a higher value suggests a reduced likelihood of the customer returning to the
company in the near future. In essence, recency serves as a metric that reflects the customer’s visiting
patterns, influencing the company’s understanding of their engagement over time [16].
Frequency (F), inquiring about the number of times a customer has made a purchase, is
characterized by the quantity of transactions within a designated timeframe. A heightened frequency value
signifies a greater degree of customer loyalty to the company. In essence, the more frequently a customer
engages in purchases within a specified period, the stronger their allegiance to the company is perceived.
This metric serves as a valuable indicator of customer commitment and the extent to which they consistently
choose the company for their purchasing needs [17].
Monetary (M), assessing the financial expenditure of a customer, is characterized by the sum of
money spent during a specific timeframe. A greater monetary value indicates a higher contribution to the
company’s revenue. Essentially, the more money a customer spends within a designated period, the more
substantial their financial impact on the company [16]. This metric is a key indicator of a customer’s
economic value and underscores their financial significance to the overall success and profitability of the
business [17].
2.3. Clustering and K-Means algorithm
Clustering is a technique employed to identify and categorize data sharing similarities with one
another [18]. It is a data analysis method commonly integrated into data mining, aiming to group data
exhibiting similar characteristics [19]. K-Means is a widely utilized algorithm that necessitates input
parameters, including the specified number of clusters, to partition the data with the objective of ensuring
high intra-cluster similarity. The algorithm operates iteratively, involving the calculation of centroid values
before each iteration. Subsequently, data points are reassigned among different clusters based on the
centroids computed during each iteration. This iterative process continues until further reduction in the sum
becomes unattainable. Algorithm 1 offers a detailed explanation of the K-Means algorithm. The
computational complexity of the K-Means algorithm is expressed as O(n+k+i), where ‘n’ signifies the
number of instances, ‘k’ denotes the number of clusters, and ‘i’ represents the number of iterations [20].
Algorithm 1. K-Means clustering algorithm
Input: Dataset containing ‘n’ instances
‘k’ represents the number of clusters
Output: Data divided into k clusters
Algorithm:
1. Initially, k random points are selected as initial centroids based on the value of
k.
2. The Euclidean distance is calculated for each data point from the previously
selected centroids.
3. The distances are compared, and each data point is assigned to the centroid with the
shortest Euclidean distance value.
4. The preceding steps are iterated. The process concludes when the obtained clusters
match those from the previous step.
2.4. Related research
Customer segmentation problems are prevalent in industry and innovation marketing concepts.
Numerous studies have explored customer segmentation using various approaches. The study described in
reference [21] centered around the implementation of explainable customer segmentation through KMC. This
research aimed to merge explainability with clustering, an unsupervised method. To enhance interpretability,
this study introduced a decision tree-based approach for explainability in customer segmentation, applicable
to both small and large datasets. Through the utilization of the elbow method and silhouette score, the
research determined an optimal number of clusters, subsequently implementing the explainable KMC
(ExKMC) algorithm for both datasets.
The study presented by [22] concentrated on customer segmentation and personalized marketing
through the utilization of K-Means and APRIORI algorithms. This paper employs RFM and KMC for
customer segmentation. Additionally, it introduces a combo offer recommendation feature that can be
integrated into any commercial website using the ECLAT and APRIORI algorithms. This feature aids in
analyzing product performance and identifying customers who can be targeted more effectively for product
sales.
Research conducted by [23]-[27] delved into elucidating the process of visualizing customer clusters
through graph plotting and studying data using the KMC algorithm. The ultimate data-driven decision-
making, derived from examining the final clusters, provides businesses with valuable insights. In the
meantime, [16] provided a comparison of three algorithms in the realm of customer segmentation, namely
KMC, fuzzy C-Means, and repetitive median K-Means. Additionally, in their work [28], introduced three](https://image.slidesharecdn.com/16id26044-250625065127-9cb64b2c/85/K-Means-clustering-interpretation-using-recency-frequency-and-monetary-factor-for-retail-customers-segmentation-3-320.jpg)
![TELKOMNIKA Telecommun Comput El Control
K-Means clustering interpretation using recency, frequency, and monetary factor for … (Agung Nugraha)
439
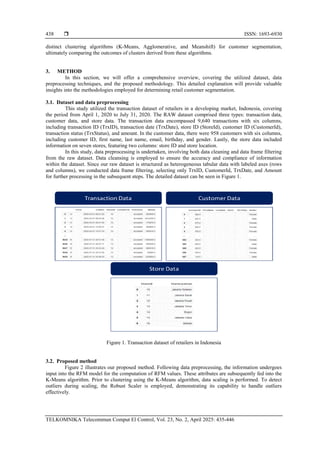
Figure 2. Proposed method
The RFM model is comprised of three components: R (recency), which reflects the customer’s most
recent transaction date. Determining the R value involves assessing the range of the customer’s last
transaction date. F (frequency) indicates the number of purchases a customer makes within a specific
timeframe. Calculating the F value entails summing the totals across all columns from April 1, 2020, to July
31, 2020. Meanwhile, M (monetary) corresponds to the amount of money spent by the customer during a
specified period. The calculation of the M value involves summing the total amount of customer data from
April 1 to July 31, 2020.
In the subsequent phase, Algorithm 1, the K-Means algorithm explained in subsection 2.3, is
applied. The determination of the optimal number of clusters is not arbitrary. Two primary methods are
employed for this purpose: the elbow method and silhouette analysis [18], [20]. The elbow method,
frequently employed, entails applying KMC to the dataset with a range of K values. For each K value, an
average score for all clusters is calculated, using the sum of square distances, also known as Euclidean
distance, from each point to its assigned center as the default score. Simultaneously, the silhouette method is
utilized to gauge the quality of clustering, where a high silhouette score indicates effective clustering. This
study incorporates both the elbow method and silhouette analysis for cluster determination.
After identifying the optimal number of clusters, this algorithm segments customers and assigns a
ranking from best to low based on the RFM model. Subsequently, post-analysis is conducted for each
customer cluster in connection with the RFM model. Furthermore, specific business strategies are proposed
for deepening relationships with customers within each cluster.
4. RESULTS AND DISCUSSION
This section delivers an elaborate presentation of the research findings, providing insights into the
achieved results. It also engages in an extensive discussion to further clarify the significance of the outcomes.
4.1. Experimental results
Our experimental results were obtained using the Python programming language and the Matplotlib
library. We extracted data from Figure 1 and processed it into an RFM model. Each variable of RFM was
calculated as detailed in subsection 3.2 and the results were combined, as illustrated in Figure 3. These
attributes were then input into the K-Means algorithm. Before clustering using K-Means, it was necessary to
scale the data, taking into consideration the presence of outliers. The seaborn.distplot() function was
employed to visualize the distribution of the RFM analysis formed earlier, specifically, the univariate
distribution of a variable against the density distribution. Following this, the Robust Scaler was utilized to
identify outliers during the scaling process. The Robust Scaler is effective in reducing the influence of
outliers by standardizing features, removing the median, and dividing each feature by the interquartile range
[29]. After scaling, the data preprocessing is complete, resulting in 954 rows with 4 columns: RecencyNew,
Frequency, Monetary, and CustomerId, as presented in Figure 4.](https://image.slidesharecdn.com/16id26044-250625065127-9cb64b2c/85/K-Means-clustering-interpretation-using-recency-frequency-and-monetary-factor-for-retail-customers-segmentation-5-320.jpg)
![ ISSN: 1693-6930
TELKOMNIKA Telecommun Comput El Control, Vol. 23, No. 2, April 2025: 435-446
440
Figure 3. RFM analysis for each customer
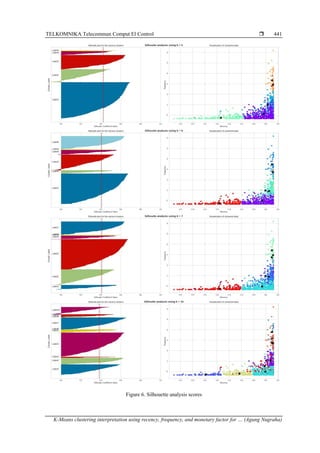
To initiate clustering with the K-Means algorithm, determining the appropriate value for K is
essential. This determination can be achieved through the utilization of both the elbow method and silhouette
analysis. The elbow method provides an initial estimate of a suitable range for K, and the subsequent
application of silhouette analysis refines the selection within that range. Employing this dual approach
ensures that the chosen K yields clusters that are not only statistically meaningful but also well-defined [30].
In the implementation phase, we utilize a dataframe containing attributes acquired in the previous
stage, as illustrated in Figure 4. These three attributes undergo clustering through the K-Means algorithm
with K values ranging from 1 to 50. The results of the elbow method visualization in Figure 5 lead to the
conclusion that the optimal K value, according to the elbow method, falls within the range of 5 to 10.
Subsequently, silhouette analysis is performed. Experimental findings reveal that the average silhouette score
for K(5) is 0.4245, for K(6) it is 0.4060, for K(7) it is 0.4084, for K(8) it is 0.3808, for K(9) it is 0.3823, and
for K(10) it is 0.3850, as shown in Figure 6. Thus, it is deduced that the optimal value of K, or the number of
clusters formed, is 5.
Figure 4. Scaled data Figure 5. Elbow analysis
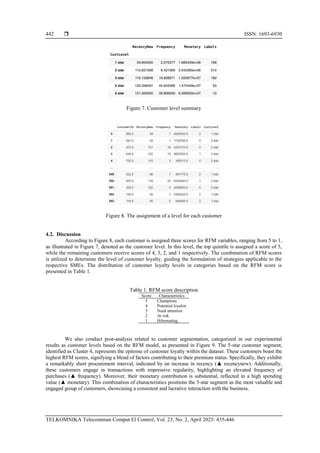
Following the clustering process, we now have five clusters, representing distinct customer
segments or, as referred to, customer levels. The RFM model is employed to interpret the outcomes of KMC
and analyze the unique characteristics of customers within each identified level. As depicted in Figure 7, each
customer level is characterized by specific RFM values. Customers displaying the highest values in all three
variables—RFM—are categorized as ‘5-star’ in the customer level, and vice versa. Accordingly, for all
customers identified by CustomerId, their respective customer level is determined based on their RFM
attributes, grouped into labels, as illustrated in Figure 8. We utilize a mapping mechanism to assign star ratings
to customers based on their clustering labels. If a customer’s label is 2, they are categorized as ‘1-star.’
Similarly, a label of 0 corresponds to ‘2-star’, a label of 1 is assigned ‘3-star,’ and if the label is 3, the
customer is labeled as ‘4-star.’ In cases where none of the specified conditions are met, the default
assignment is ‘5-star.’](https://image.slidesharecdn.com/16id26044-250625065127-9cb64b2c/85/K-Means-clustering-interpretation-using-recency-frequency-and-monetary-factor-for-retail-customers-segmentation-6-320.jpg)
![ ISSN: 1693-6930
TELKOMNIKA Telecommun Comput El Control, Vol. 23, No. 2, April 2025: 435-446
444
5. CONCLUSION
Segmenting customers proves instrumental in fostering stronger customer relationships in industrial
and innovation. While acquiring new customers is crucial for business growth, retaining existing clients holds
even greater significance. The main findings of this study center around the analysis of customer
consumption behavior, employing an improved RFM model through the utilization of the KMC algorithm.
The application of the KMC algorithm facilitates the classification of customer behavior indicators, with a
thorough examination of the results. Given that segmentation relies on RFM values, SMEs now can tailor
their marketing strategies to align with customer buying behavior. Future work will involve assessing the
performance of customers within each segment, focusing on frequently purchased products by segment
members. This approach enables more targeted and effective promotional offers for specific products,
contributing to a more nuanced and strategic customer engagement.
ACKNOWLEDGEMENTS
Authors express their appreciation to the Department of Industrial and Data Engineering, Pukyong
National University and the Robotics, Mechatronics, and Intelligent System Research Group at the Faculty of
Advanced Technology and Multidiscipline, Airlangga University, for their valuable support throughout the
research process.
REFERENCES
[1] R. Martínez-Peláez et al., “Role of Digital Transformation for Achieving Sustainability: Mediated Role of Stakeholders, Key
Capabilities, and Technology,” Sustainability, vol. 15, no. 14, pp. 1-2, 2023, doi: 10.3390/su151411221.
[2] K. N. Lemon and P. C. Verhoef, “Understanding Customer Experience Throughout the Customer Journey,” Journal of Marketing,
vol. 80, no. 6, pp. 69-96, 2016, doi: 10.1509/jm.15.0420.
[3] R. Srivastava, “Identification of customer clusters using RFM model: a case of diverse purchaser classification,” International
Journal of Business Analytics and Intelligence, vol. 4, no. 2, pp. 45–50, 2016.
[4] P. Pfeifer, “The optimal ratio of acquisition and retention costs,” Journal of Targeting, Measurement and Analysis for Marketing,
vol. 13, pp. 179–188, 2005, doi: 10.1057/palgrave.jt.5740142.
[5] V. Bali, V. Bhatnagar, S. Sinha, and P. Johri, “Disruptive Technologies for Society 5.0: Exploration of New Ideas, Techniques,
and Tools,” CRC Press, 2022, doi : 10.1201/9781003154686.
[6] O. Koll and A. Plank, “Do shoppers choose the same brand on the next trip when facing the same context? An empirical
investigation in FMCG retailing,” Journal of Retailing, vol. 98, no. 4, pp. 576-592, 2022, doi: 10.1016/j.jretai.2022.01.003.
[7] N. L. Rane, A. Achari, and S. P. Choudhary, “Enhancing customer loyalty through quality of service: Effective strategies to
improve customer satisfaction, experience, relationship, and engagement,” International Research Journal of Modernization in
Engineering Technology and Science, vol. 5, no. 5, pp. 38104, May 2023, doi: 10.56726/IRJMETS38104.
[8] M. A. Camilleri, “Market Segmentation, Targeting and Positioning,” in Travel Marketing, Tourism Economics and the Airline
Product, Springer, Cham, Switzerland, 2018, pp. 69-83, doi: 10.1007/978-3-319-49849-2_4.
[9] T. Tavor, L. D. Gonen, and U. Spiegel, “Customer Segmentation as a Revenue Generator for Profit Purposes,” Mathematics, vol.
11, no. 21, pp. 1-20, 2023, doi: 10.3390/math11214425.
[10] M. A. Rahim, M. Mushaf, S. Khan, and Z. A. Arain, “RFM-based repurchase behavior for customer classification and
segmentation,” Journal of Retailing and Consumer Services, vol. 61, pp. 1-9, Jul. 2021, doi: 10.1016/j.jretconser.2021.102566.
[11] M. Y. Smaili and H. Hachimi, “New RFM-D classification model for improving customer analysis and response prediction,” Ain
Shams Engineering Journal, vol. 14, no. 12, pp. 1-9, 2023, doi: 10.1016/j.asej.2023.102254.
[12] S. Nguyen, H. Nguyen, N. Nguyen, D.-S. Man, and T.-G. Le, “An Extended RFM Model for Customer Behaviour and
Demographic Analysis in Retail Industry,” Business Systems Research, vol. 14, no. 1, pp. 26-53, 2023, doi: 10.2478/bsrj-2023-
0002.
[13] L. Abednego, C. E. Nugraheni, and A. Salsabina, “Customer segmentation: Transformation from data to marketing strategy,” in IAIC
International Conference Series, 2023, vol. 4, no. 1, pp. 139–152, doi: 10.34306/conferenceseries.v4i1.645.
[14] V. Guerola-Navarro, H. Gil-Gomez, R. Oltra-Badenes, and P. Soto-Acosta, “Customer relationship management and its impact on
entrepreneurial marketing: a literature review,” International Entrepreneurship and Management Journal, vol. 20, no. 2, pp. 507-
547, 2022, doi: 10.1007/s11365-022-00800-x.
[15] C. Ledro, A. Nosella, and I. D. Pozza, “Integration of AI in CRM: Challenges and guidelines,” Journal of Open Innovation:
Technology, Market, and Complexity, vol. 9, no. 4, pp. 1-13, 2023, doi: 10.1016/j.joitmc.2023.100151.
[16] A. J. Christy, A. Umamakeswari, L. Priyatharsini, and A. Neyaa, “RFM ranking–An effective approach to customer
segmentation,” Journal of King Saud University-Computer and Information Sciences, vol. 33, no. 10, pp. 1251-1257, 2021, doi:
10.1016/j.jksuci.2018.09.004.
[17] D. S. Rachmahwati, R. Andreswari, and F. Hamami, “Customer Segmentation of Cellular Telecommunication Company Using
K-Means Algorithm (Case Study of PT Indosat),” in 2022 International Conference of Science and Information Technology in
Smart Administration (ICSINTESA), Denpasar, Bali, Indonesia, 2022, pp. 45-50, doi: 10.1109/ICSINTESA56431.2022.10041532.
[18] M. C. Untoro, N. Triawati, Y. A. Effendi, H. Natalia, and M. S. Wisnubroto, “Comparison of K-means and K-medoids algorithm
in grouping dengue fever patient data (Case study: Kaliasin health center),” AIP Conference Proceedings, vol. 2536, no. 1, p.
020009, May 19, 2023, doi: 10.1063/5.0119165.
[19] Y. A. Effendi and N. Nuzulita, “Implementation of fuzzy multi-criteria decision making for determining student rank (Case study:
Bimbel plus IKA),” AIP Conference Proceedings, vol. 2536, no. 1, p. 060004, 2023, doi: 10.1063/5.0123479.
[20] X. Jin and J. Han, “K-Means Clustering,” in Encyclopedia of machine learning, Eds. Springer, Boston, MA, 2011, pp. 525-532,
doi: 10.1007/978-0-387-30164-8_425.
[21] R. H. Khan, D. F. Dofadar, and M. G. R. Alam, “Explainable Customer Segmentation Using K-means Clustering,” in 2021 IEEE](https://image.slidesharecdn.com/16id26044-250625065127-9cb64b2c/85/K-Means-clustering-interpretation-using-recency-frequency-and-monetary-factor-for-retail-customers-segmentation-10-320.jpg)
![TELKOMNIKA Telecommun Comput El Control
K-Means clustering interpretation using recency, frequency, and monetary factor for … (Agung Nugraha)
445
12th Annual Ubiquitous Computing, Electronics & Mobile Communication Conference (UEMCON), New York, NY, USA, 2021,
pp. 0639-0643, doi: 10.1109/UEMCON53757.2021.9666609.
[22] K. Gayathri and R. Arunodhaya, “Customer Segmentation and Personalized Marketing Using K-Means and APRIORI
Algorithm,” in Proceedings of the 7th EAI International Conference on Applied Cryptography and Network Security (ICCAP),
EAI, 2021, doi: 10.4108/eai.7-12-2021.2314561.
[23] D. P and S. Sudha, “Exploratory Data Analysis and Data Segmentation using K means Clustering,” in 2023 3rd International
Conference on Advance Computing and Innovative Technologies in Engineering (ICACITE), Greater Noida, India, 2023, pp. 145-
147, doi: 10.1109/ICACITE57410.2023.10183143.
[24] N. Saini, K. Sharma, P. K. Sarangi, G. Singh, and L. Rani, “Customer Segmentation using K-Means Clustering,” in 2022 10th
International Conference on Reliability, Infocom Technologies and Optimization (Trends and Future Directions) (ICRITO),
Noida, India, 2022, pp. 1-5, doi: 10.1109/ICRITO56286.2022.9965147.
[25] L. Rajput and S. N. Singh, “Customer Segmentation of E-commerce data using K-means Clustering Algorithm,” in 2023 13th
International Conference on Cloud Computing, Data Science & Engineering (Confluence), Noida, India, 2023, pp. 658-664, doi:
10.1109/Confluence56041.2023.10048834.
[26] H. Kilari, S. Edara, G. R. S. Yarra, and D. V. Gadhiraju, “Customer Segmentation using K-Means Clustering,” International
Journal of Engineering Research & Technology (IJERT), vol. 11, no. 03, pp. 303-308, Mar. 2022, doi:
10.17577/IJERTV11IS030152.
[27] A. Agrawal, P. Kaur, and M. Singh, “Customer Segmentation Model using K-means Clustering on E-commerce,” in 2023
International Conference on Sustainable Computing and Data Communication Systems (ICSCDS), Erode, India, 2023, pp. 1-6,
doi: 10.1109/ICSCDS56580.2023.10105070.
[28] T. Kansal, S. Bahuguna, V. Singh, and T. Choudhury, “Customer Segmentation using K-means Clustering,” in 2018 International
Conference on Computational Techniques, Electronics and Mechanical Systems (CTEMS), Belgaum, India, 2018, pp. 135-139,
doi: 10.1109/CTEMS.2018.8769171.
[29] K. Wada, “Outliers in official statistics,” Japanese Journal of Statistics and Data Science, vol. 3, pp. 669–691, 2020, doi:
10.1007/s42081-020-00091-y.
[30] D. M. Saputra, D. Saputra, and L. D. Oswari, “Effect of Distance Metrics in Determining K-Value in KMeans Clustering Using
Elbow and Silhouette Method,” in Advances in Intelligent Systems Research, vol. 172, Sriwijaya International Conference on
Information Technology and Its Applications (SICONIAN 2019), May 2020, pp. 341-346, doi: 10.2991/aisr.k.200424.051.
BIOGRAPHIES OF AUTHORS
Agung Nugraha earned his Bachelor of Engineering from the University of
Indonesia and a Master’s in Industrial and Data Science Engineering from Pukyong and Pusan
National Universities in South Korea. He is now pursuing a Ph.D. in the same field at these
institutions. Professionally, he is an Executive Data Scientist at PT. Metra-Net (Telkom
Indonesia) and a Research Assistant at Pukyong National University’s Business Analytics
Laboratory. His research focuses on applying machine learning to business processes, data-
driven insights, and advanced analytical models. He can be contacted at email:
agung@pukyong.ac.kr.
Yutika Amelia Effendi received her B.Comp.Sc. and M.Comp.Sc. degrees in
Informatics from Institut Teknologi Sepuluh Nopember, Indonesia, and a Ph.D. in Industrial
and Data Engineering from a joint degree program at Pukyong National University and Pusan
National University, Busan, South Korea. She is currently a lecturer in the Robotics and
Artificial Intelligence Engineering program at Universitas Airlangga. Her research interests
include process mining, artificial intelligence, industrial data analytics, health informatics, and
knowledge engineering. She can be contacted at email: yutika.effendi@ftmm.unair.ac.id.
Nicholas earned his MS in Industrial and Data Engineering from Pukyong
National University (PKNU) and Pusan National University (PNU), South Korea, and his S.T.
(Bachelor of Engineering) in Industrial Engineering from Universitas Indonesia. He has
worked in procurement and supply chain roles at Procter & Gamble, Shell, Asia Pulp & Paper,
Kalbe Digital Healthcare, and Boston Consulting Group in Jakarta, Indonesia. Additionally, he
holds a Diploma in Sourcing in Procurement and Supply from the Chartered Institute of
Procurement & Supply (CIPS), UK. Currently, he is a Procurement Manager at a cosmetics
brand management company in Seoul, South Korea. His research interests include scheduling,
operations research, AI, data science, and supply chain management. He can be contacted at
email: nicholas@pukyong.ac.kr.](https://image.slidesharecdn.com/16id26044-250625065127-9cb64b2c/85/K-Means-clustering-interpretation-using-recency-frequency-and-monetary-factor-for-retail-customers-segmentation-11-320.jpg)


![Cdac -Project Presentation [Autosaved].pptx](https://cdn.slidesharecdn.com/ss_thumbnails/cdac-projectpresentationautosaved-231029063336-13e0f780-thumbnail.jpg?width=640&height=640&fit=bounds)


