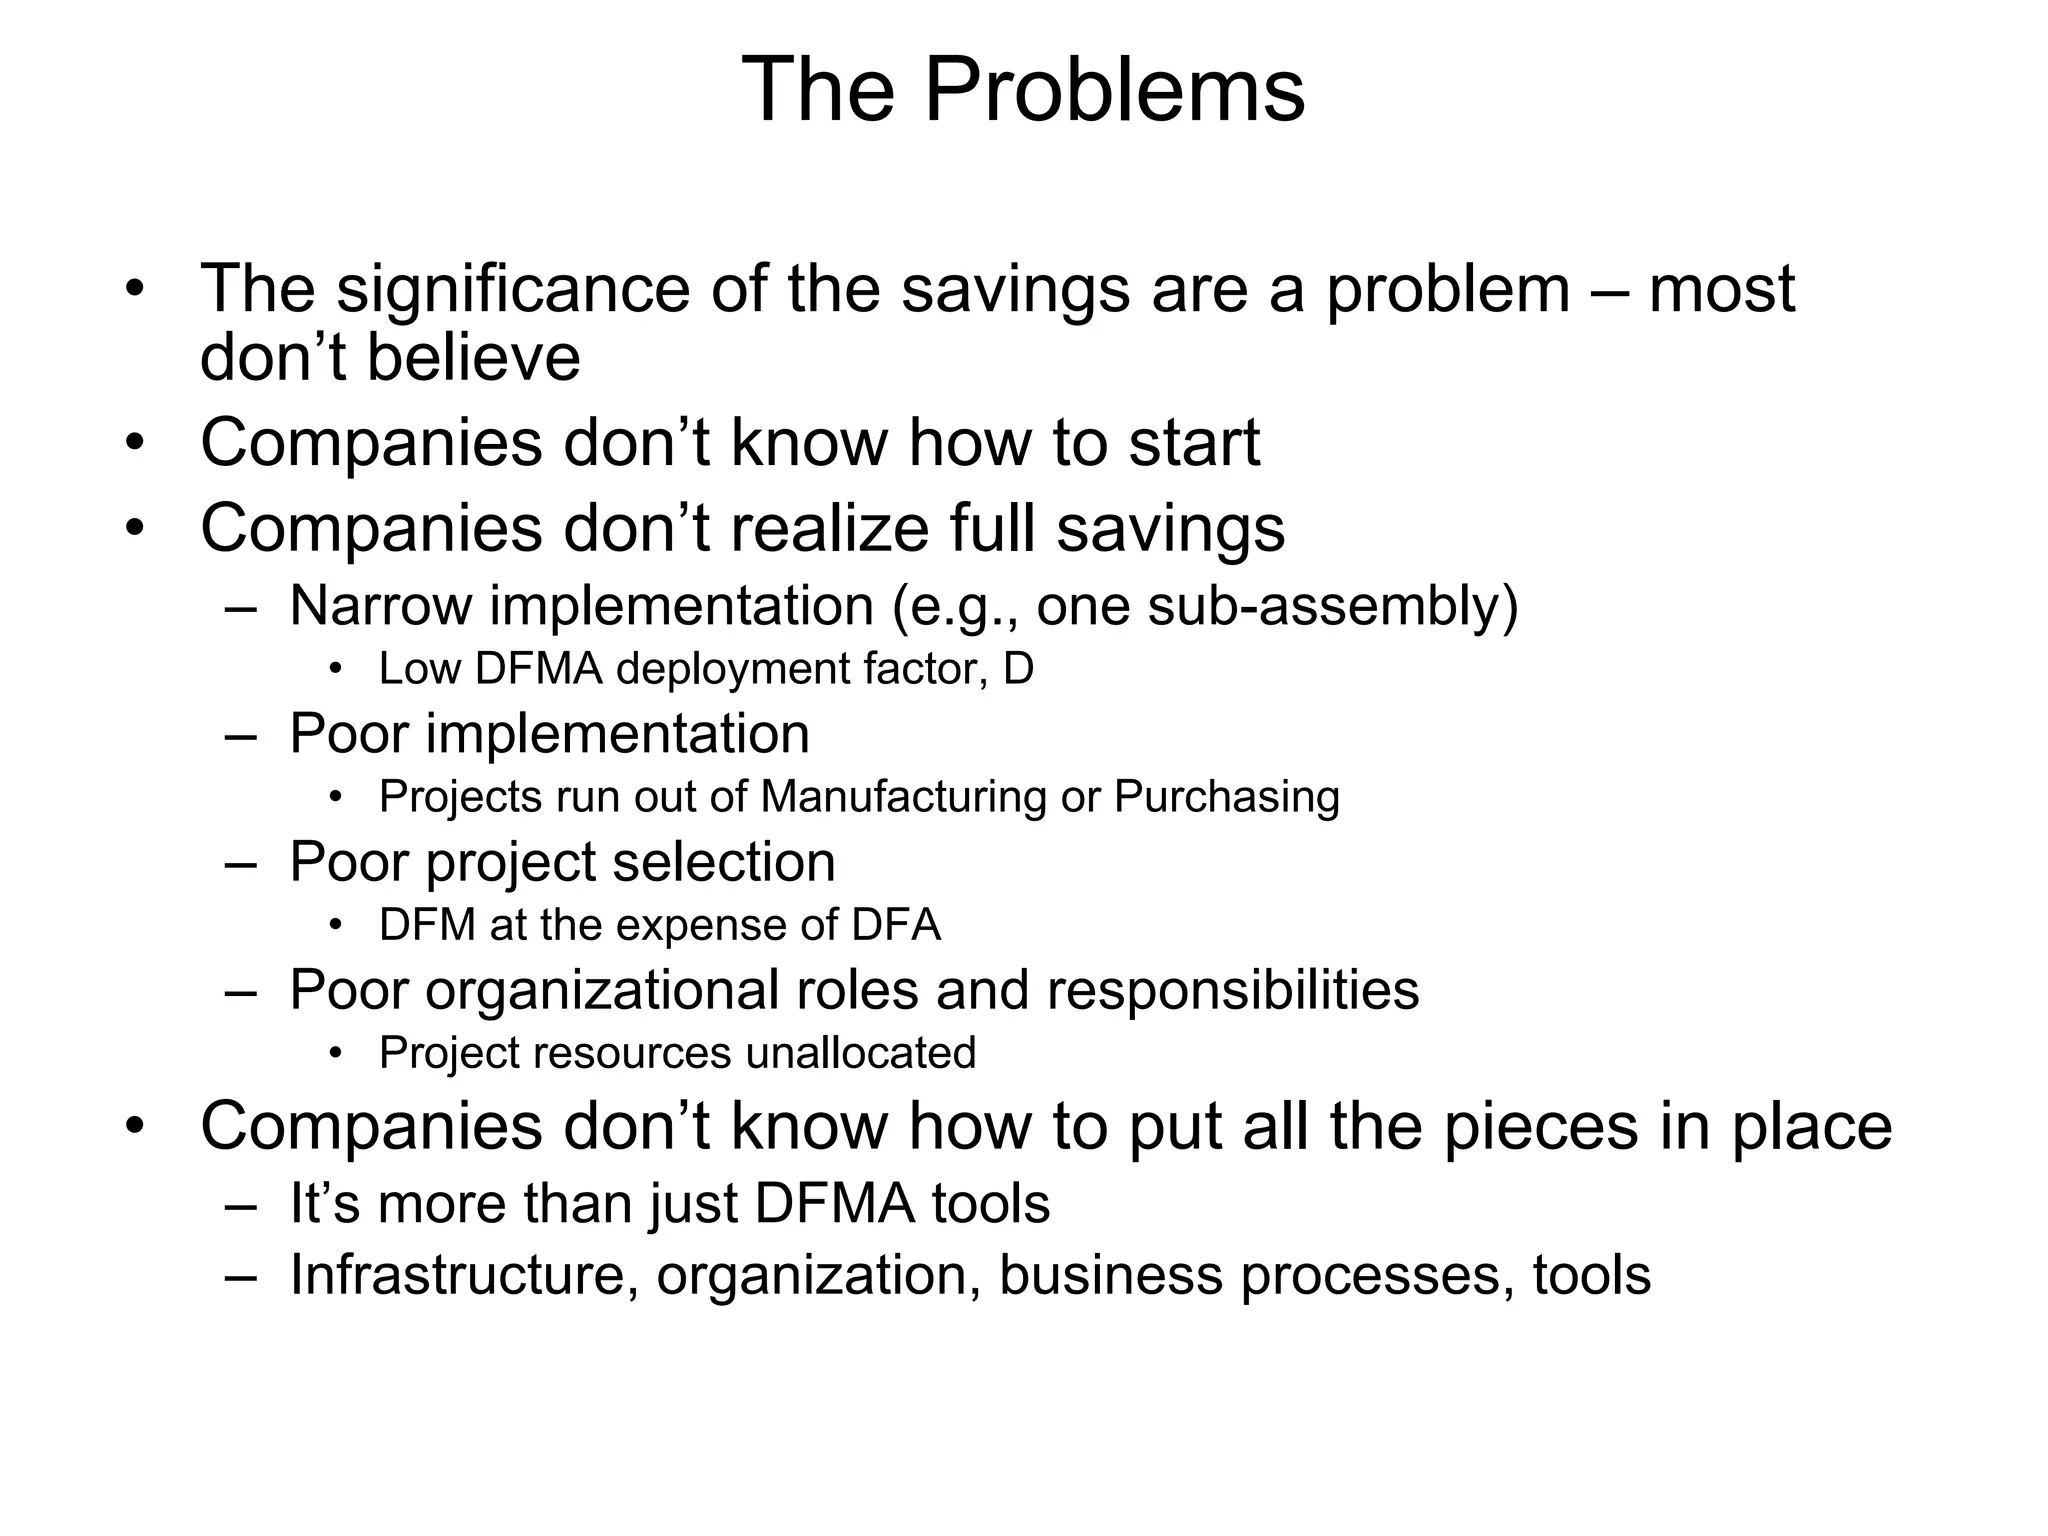
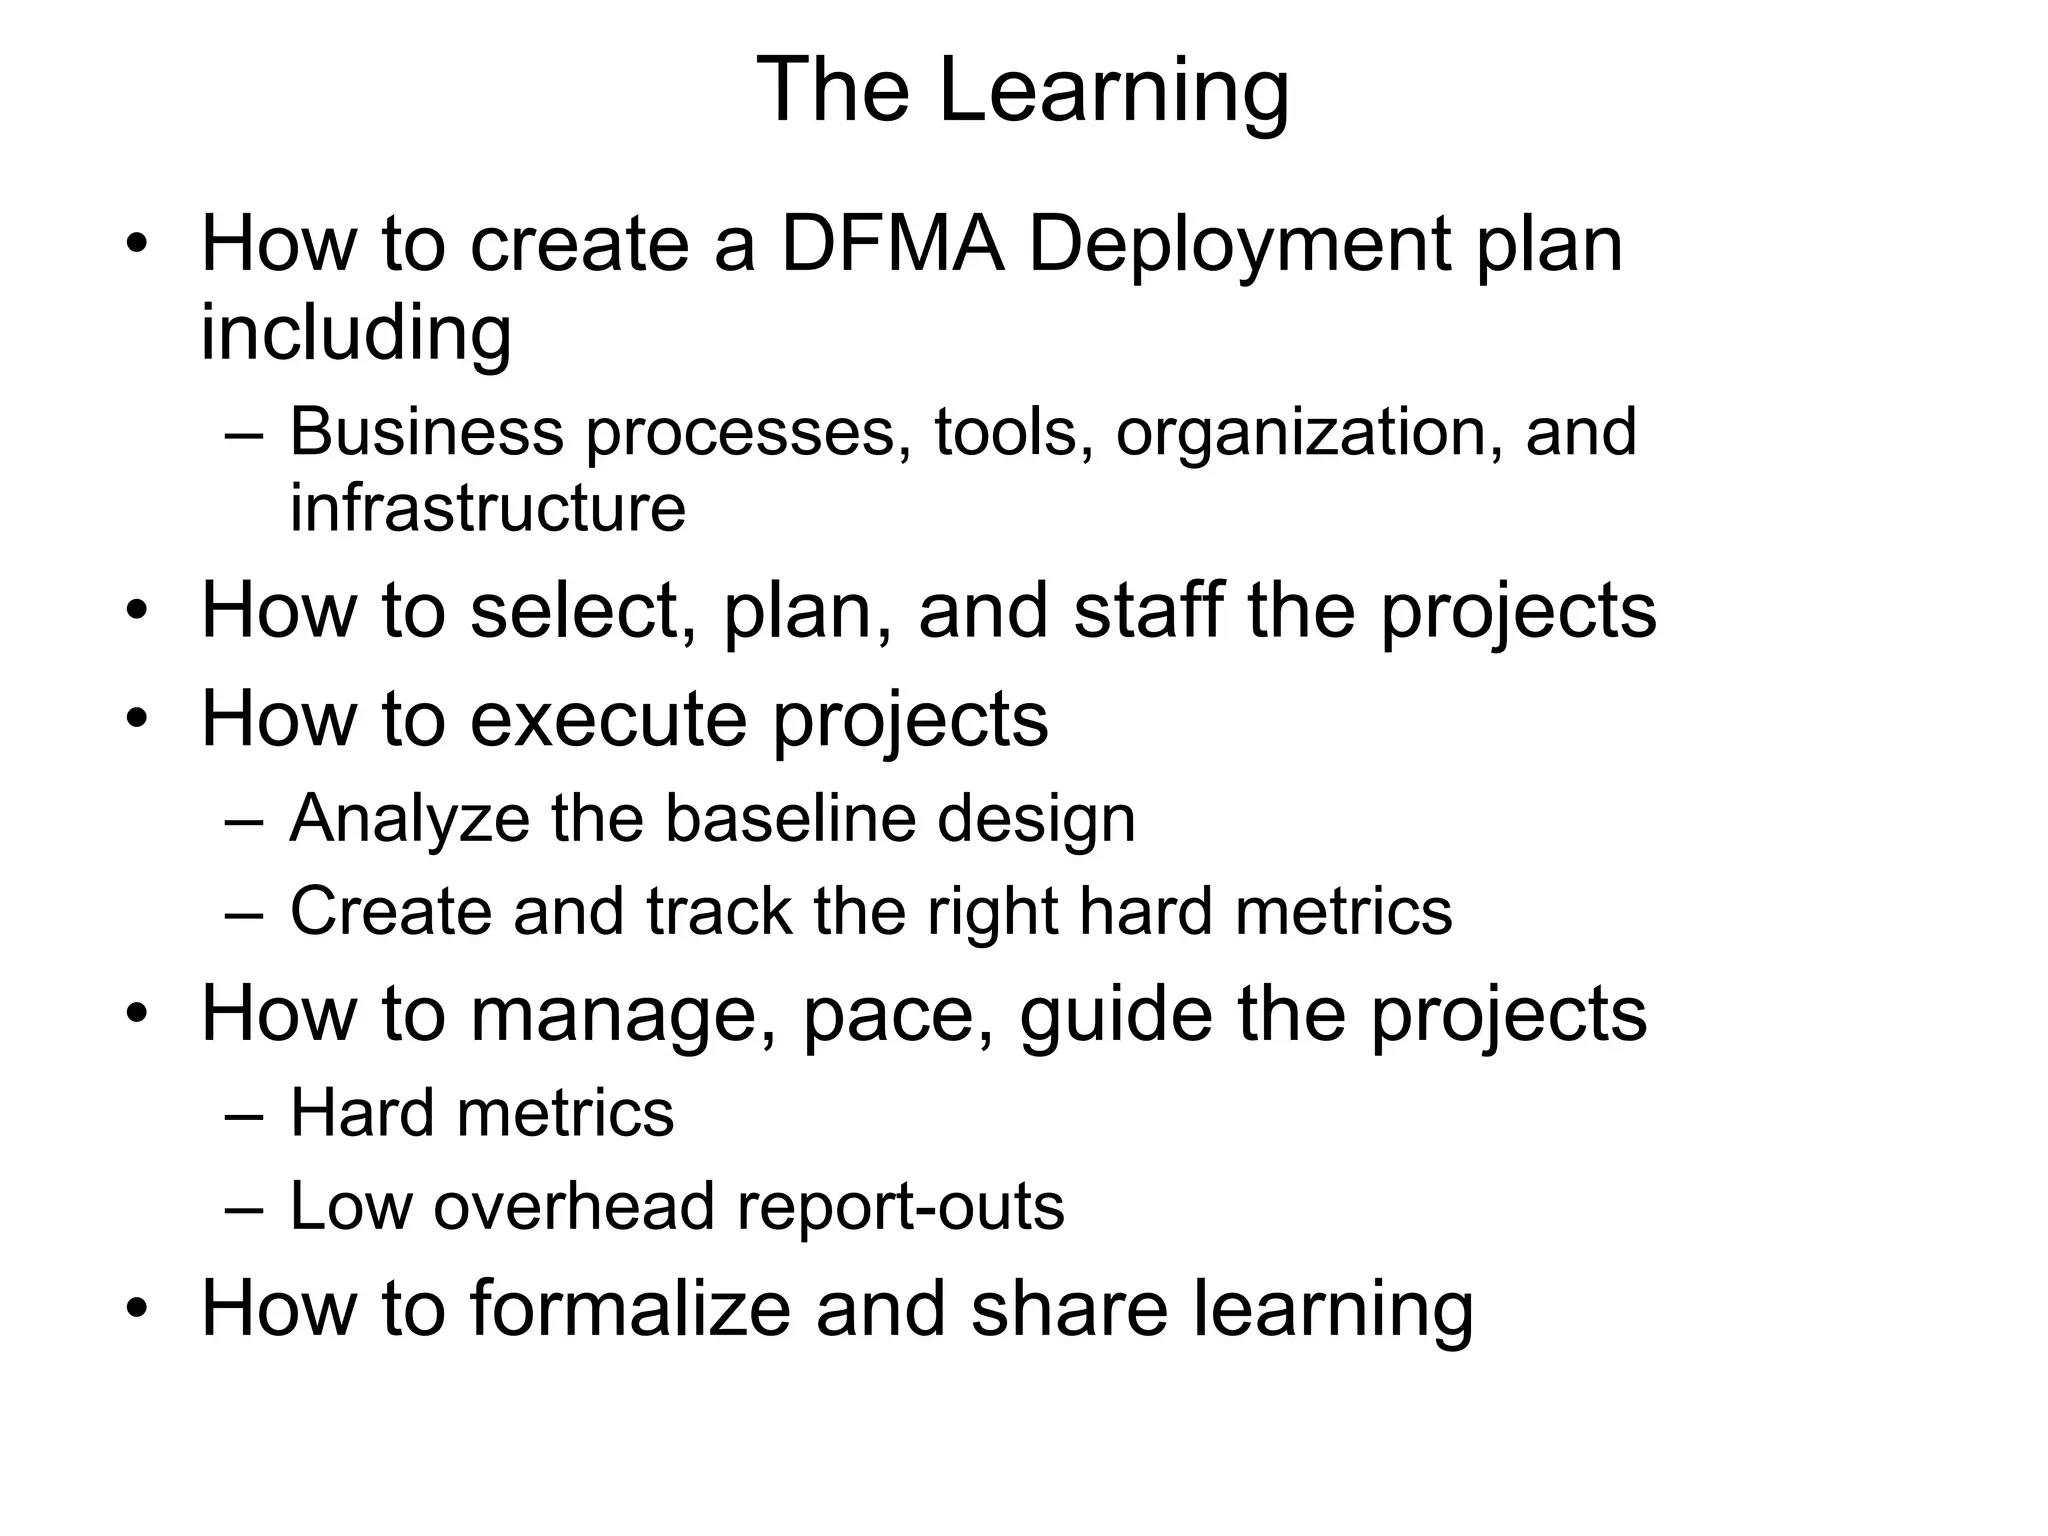
Downloaded 100 times
![We praised financial enterprises for driving economic growth knowing full well that moving and repackaging financial vehicles did not create sustainable growth All the while, manufacturing has taken it on the chin with: Astronomical job losses The thinnest capital investments And, most troubling, a general denigration of Manufacturing as an institution and profession We can resurrect Manufacturing with a back-to-basics approach to create sustainable economic growth. Manufacturing creates value when it combines raw materials and labor with thinking, which we call design, to create products that sell for more than the cost to make them, where Profit per part = Price – Cost [1] replacing Cost with Materials and Labor, eq. [1] becomes Profit per part = Price – (Materials + Labor). [2] We have lost our way](https://image.slidesharecdn.com/resurrectusmanufacturing2009dfmaforum-100128154708-phpapp02/75/Resurrect-Manufacturing-2009-DFMA-Forum-3-2048.jpg)
![Total profit is a function of the number of parts sold, so modifying eq. [2] for Volume Profit = [Price – (Materials + Labor)] x Volume. [3] The Market sets price and volume We are left only to with Materials and Labor to influence Profit. At the most basic level, we must reduce Materials and Labor to increase Profit. This is so important it must be written as a formula: Increased Profits in Manufacturing result from reduced Materials and Labor costs . [4] How do we use the simple fundamentals of eq. [4] to resurrect US Manufacturing? I propose we must change our designs to design out Material and Labor costs using Systematic DFMA Deployment. We have lost our way](https://image.slidesharecdn.com/resurrectusmanufacturing2009dfmaforum-100128154708-phpapp02/75/Resurrect-Manufacturing-2009-DFMA-Forum-4-2048.jpg)
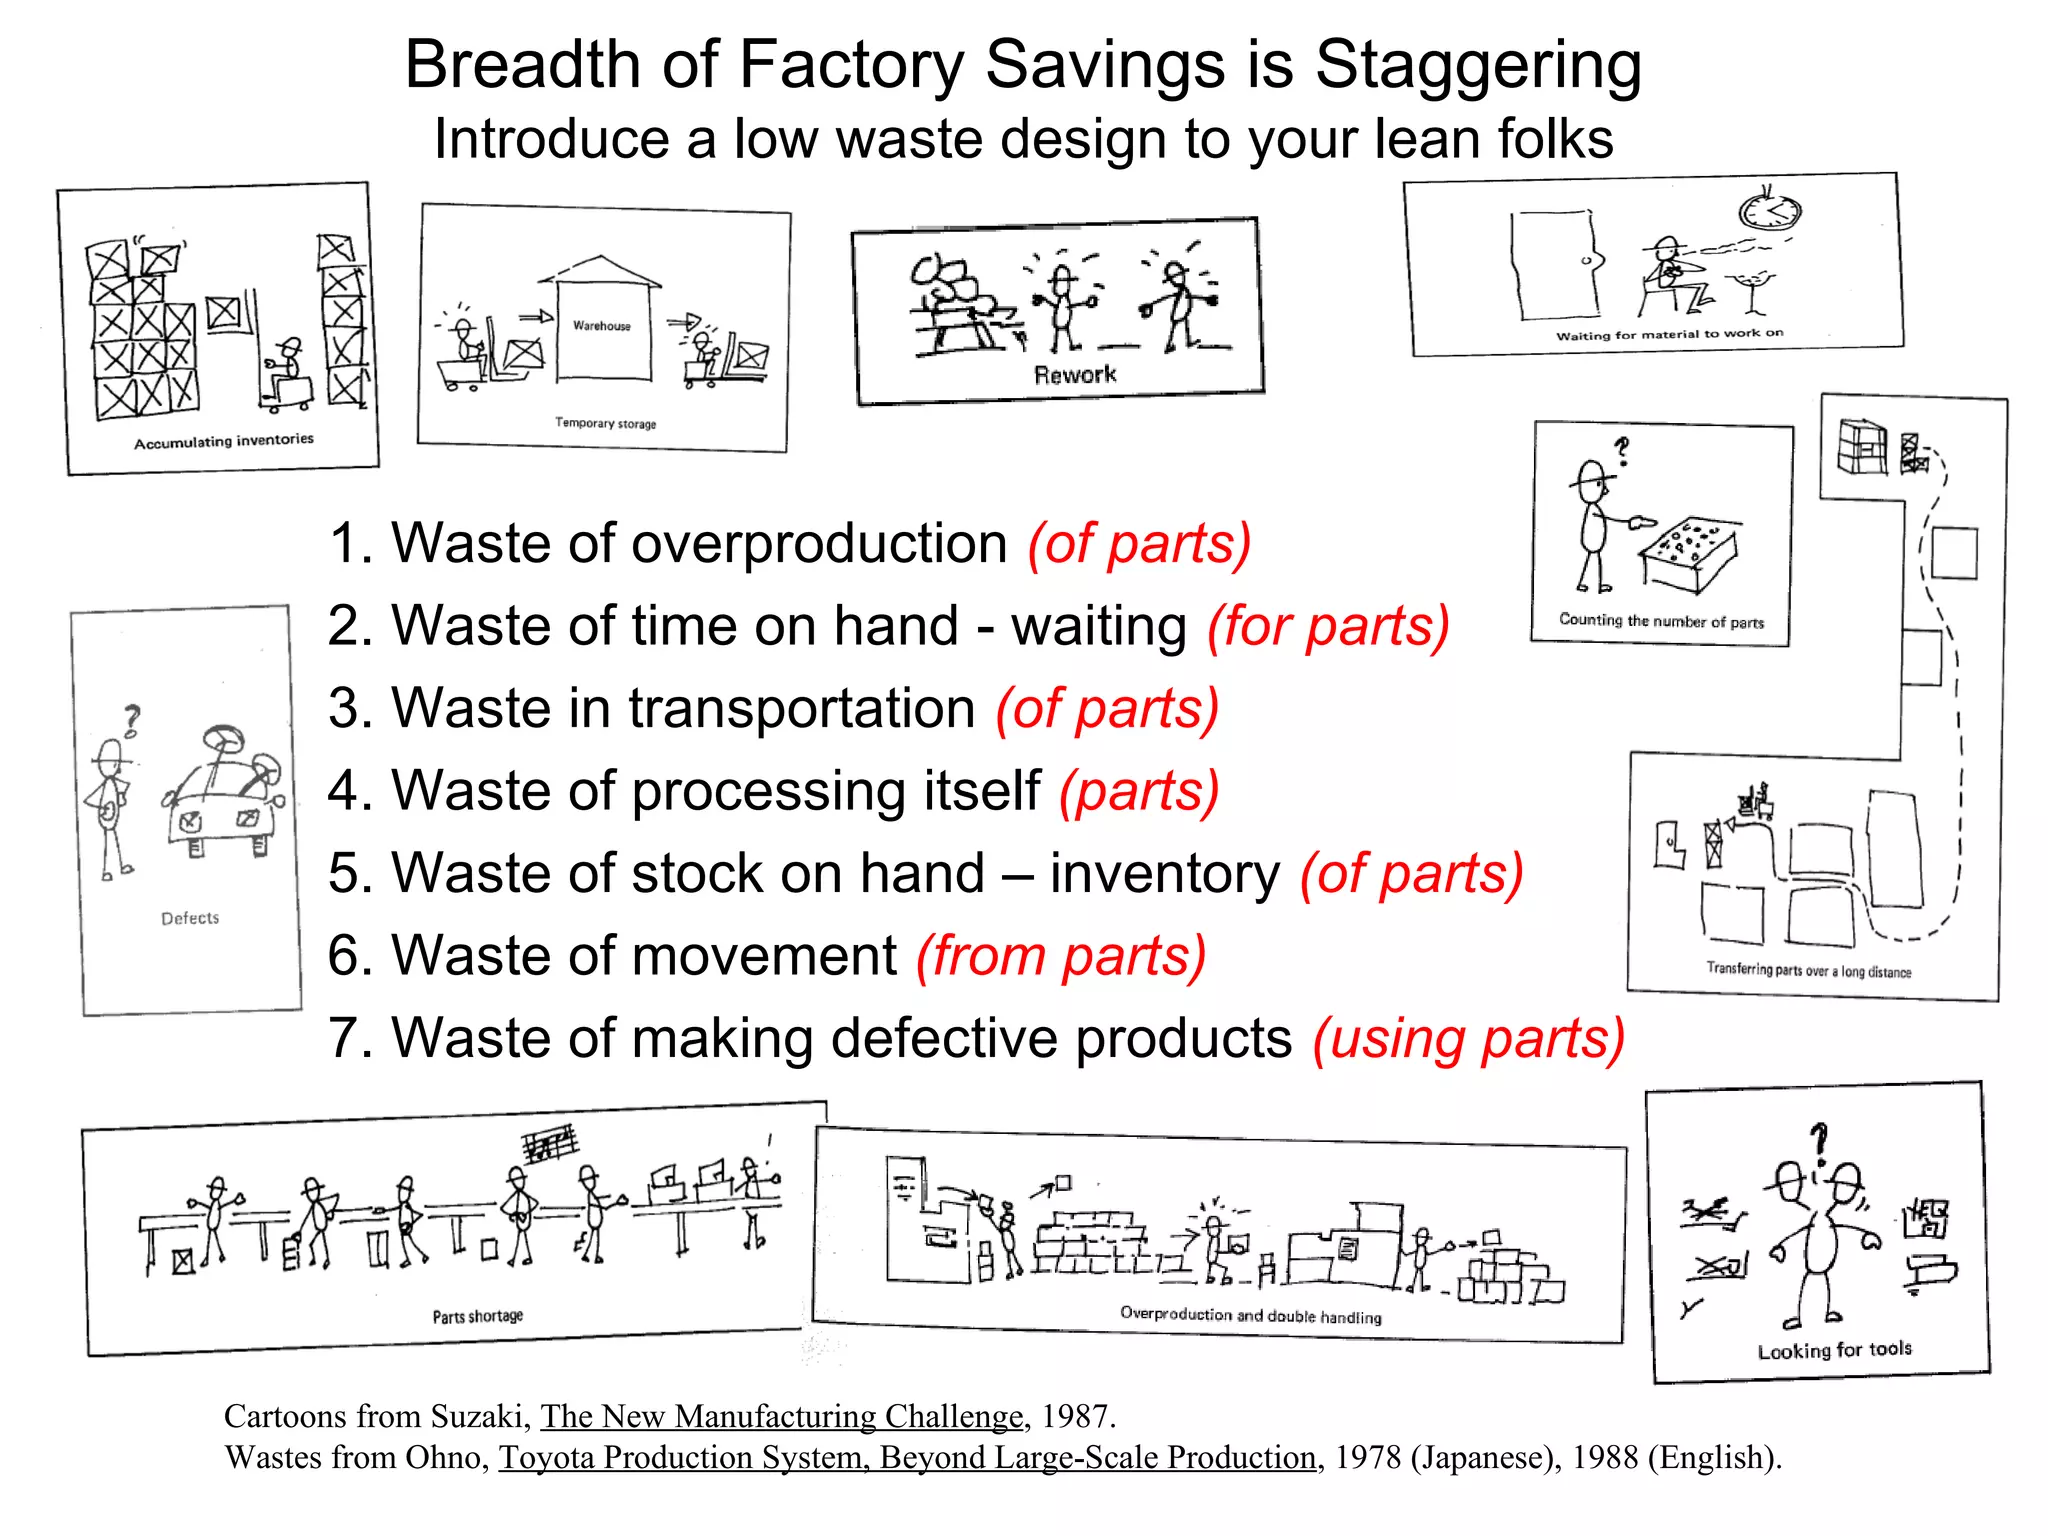
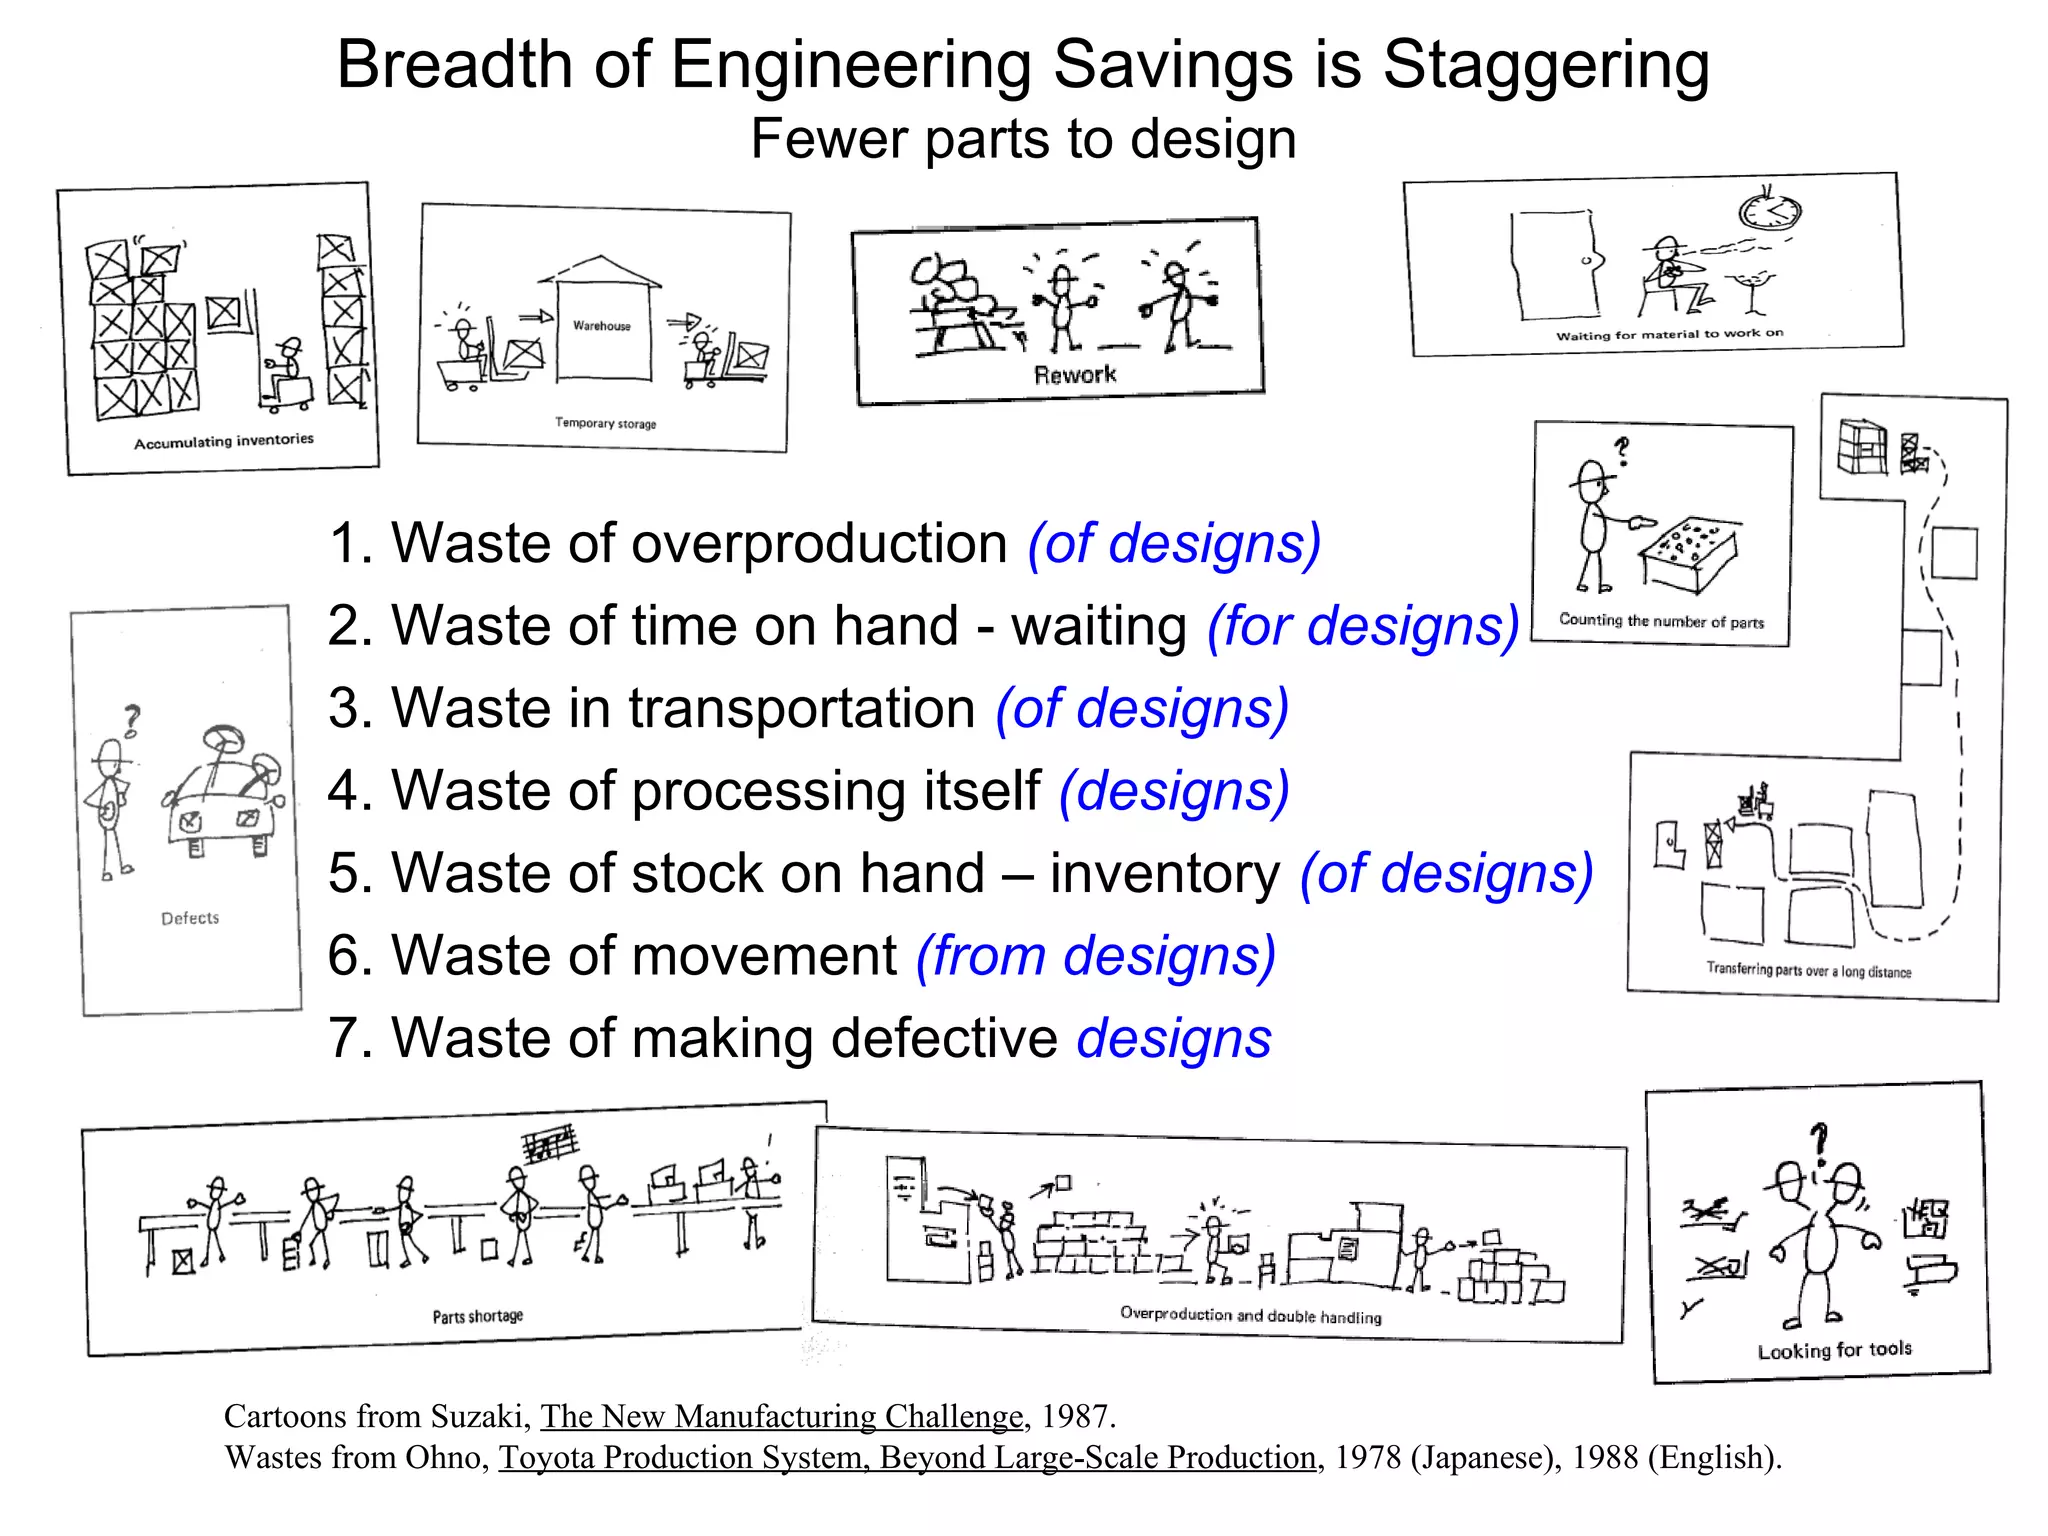
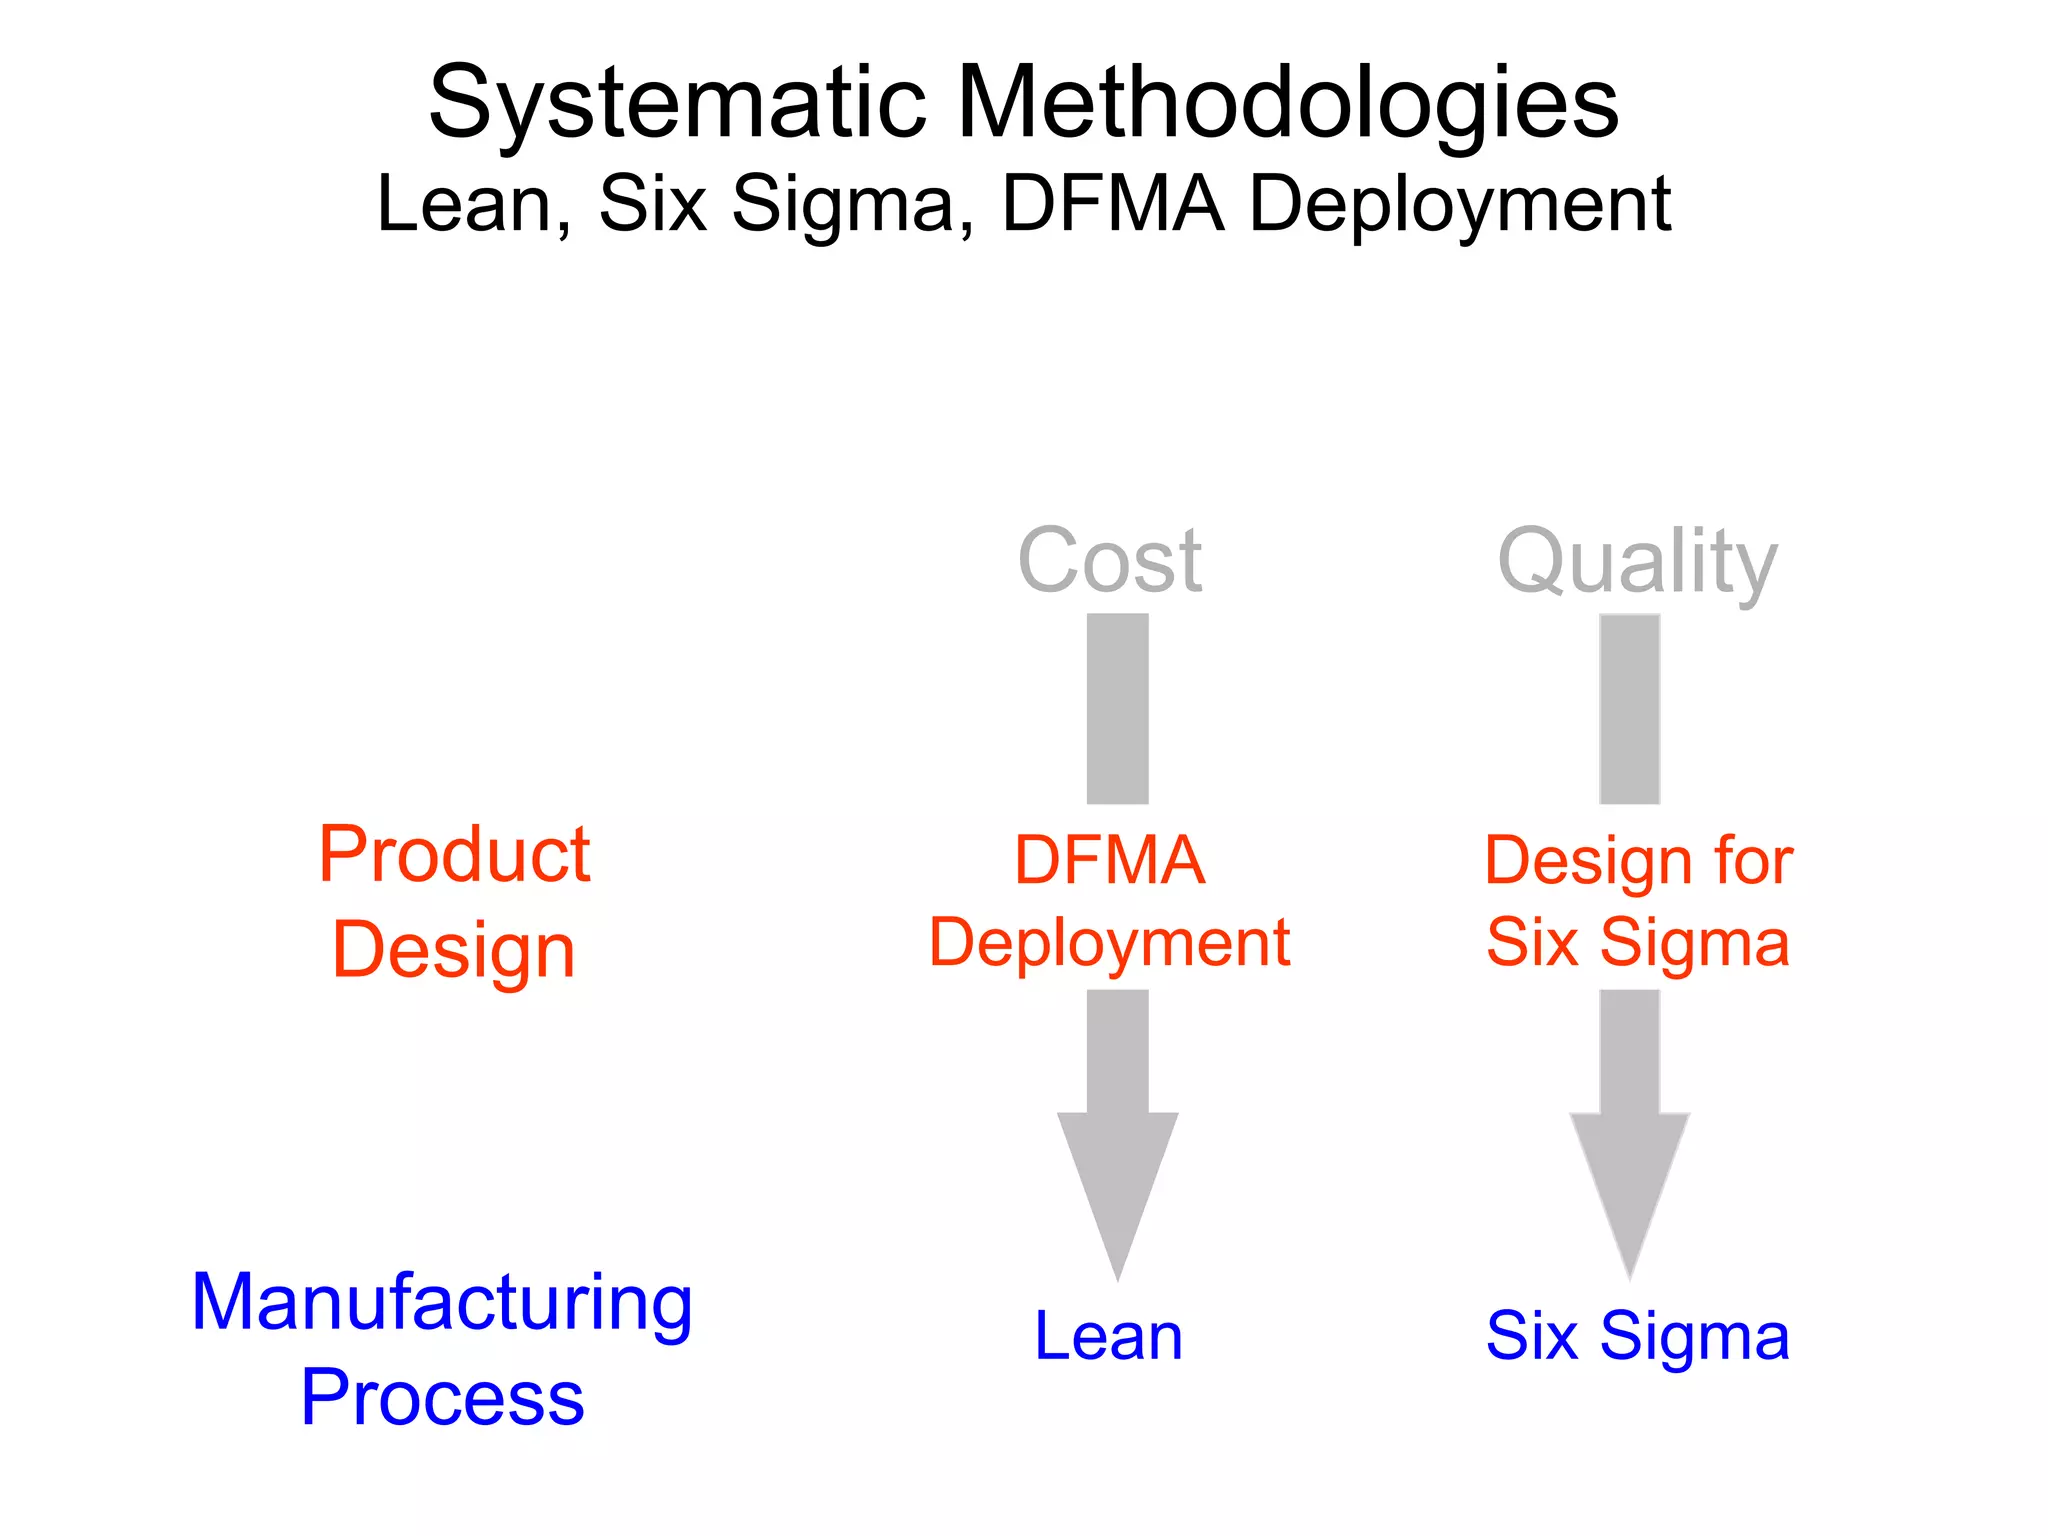
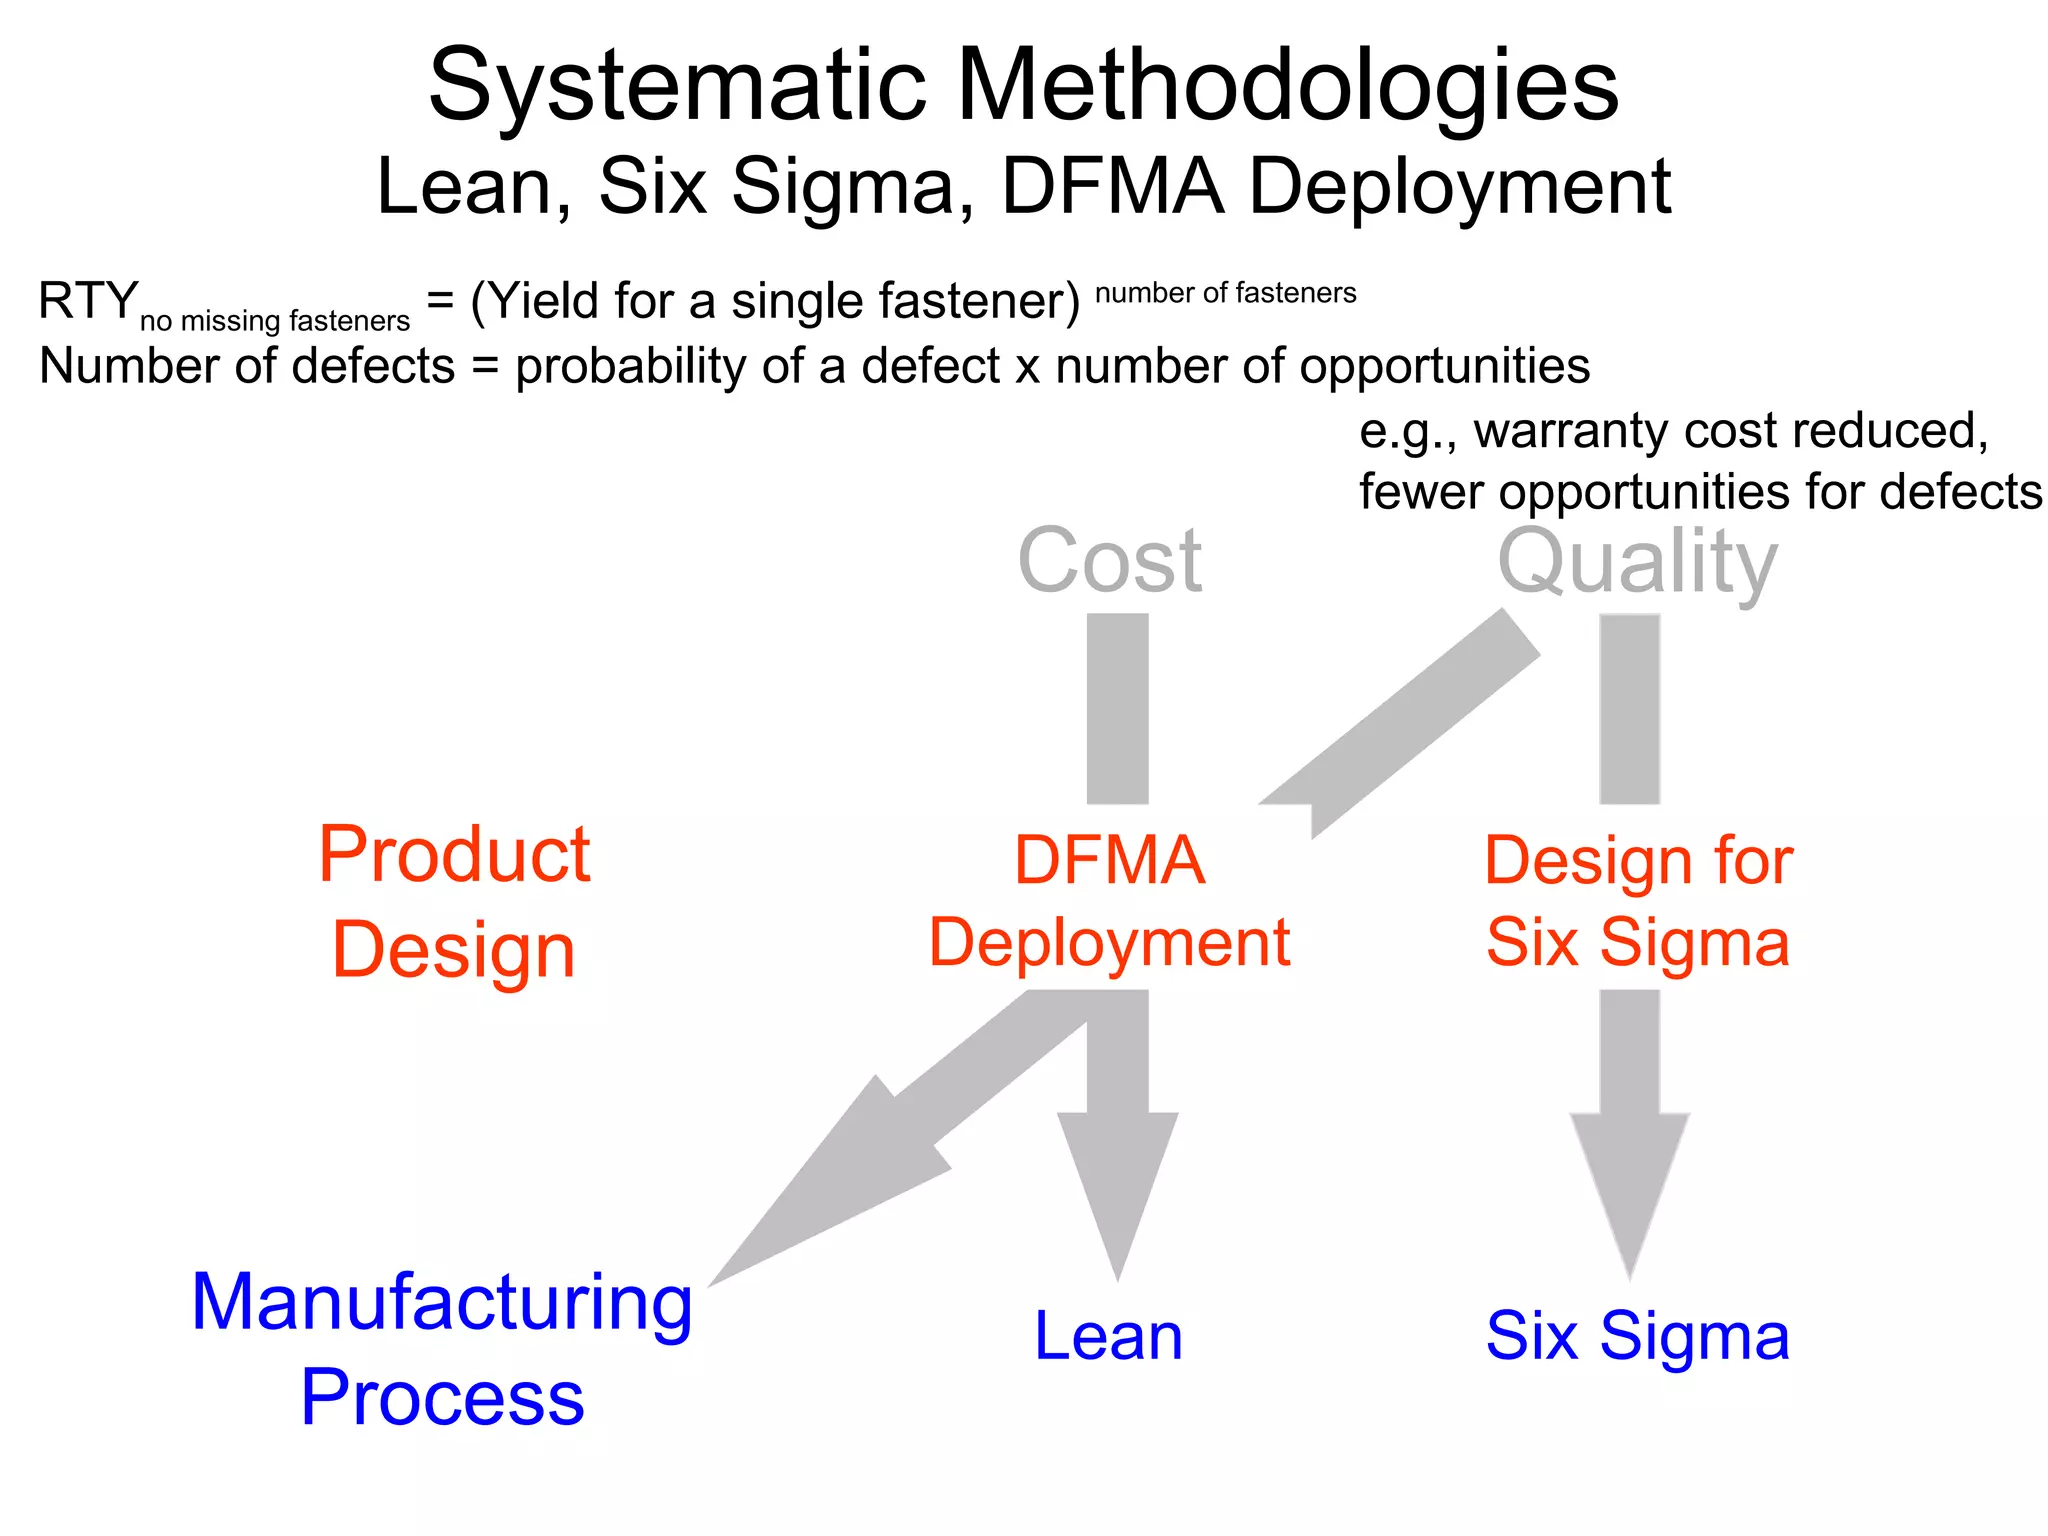
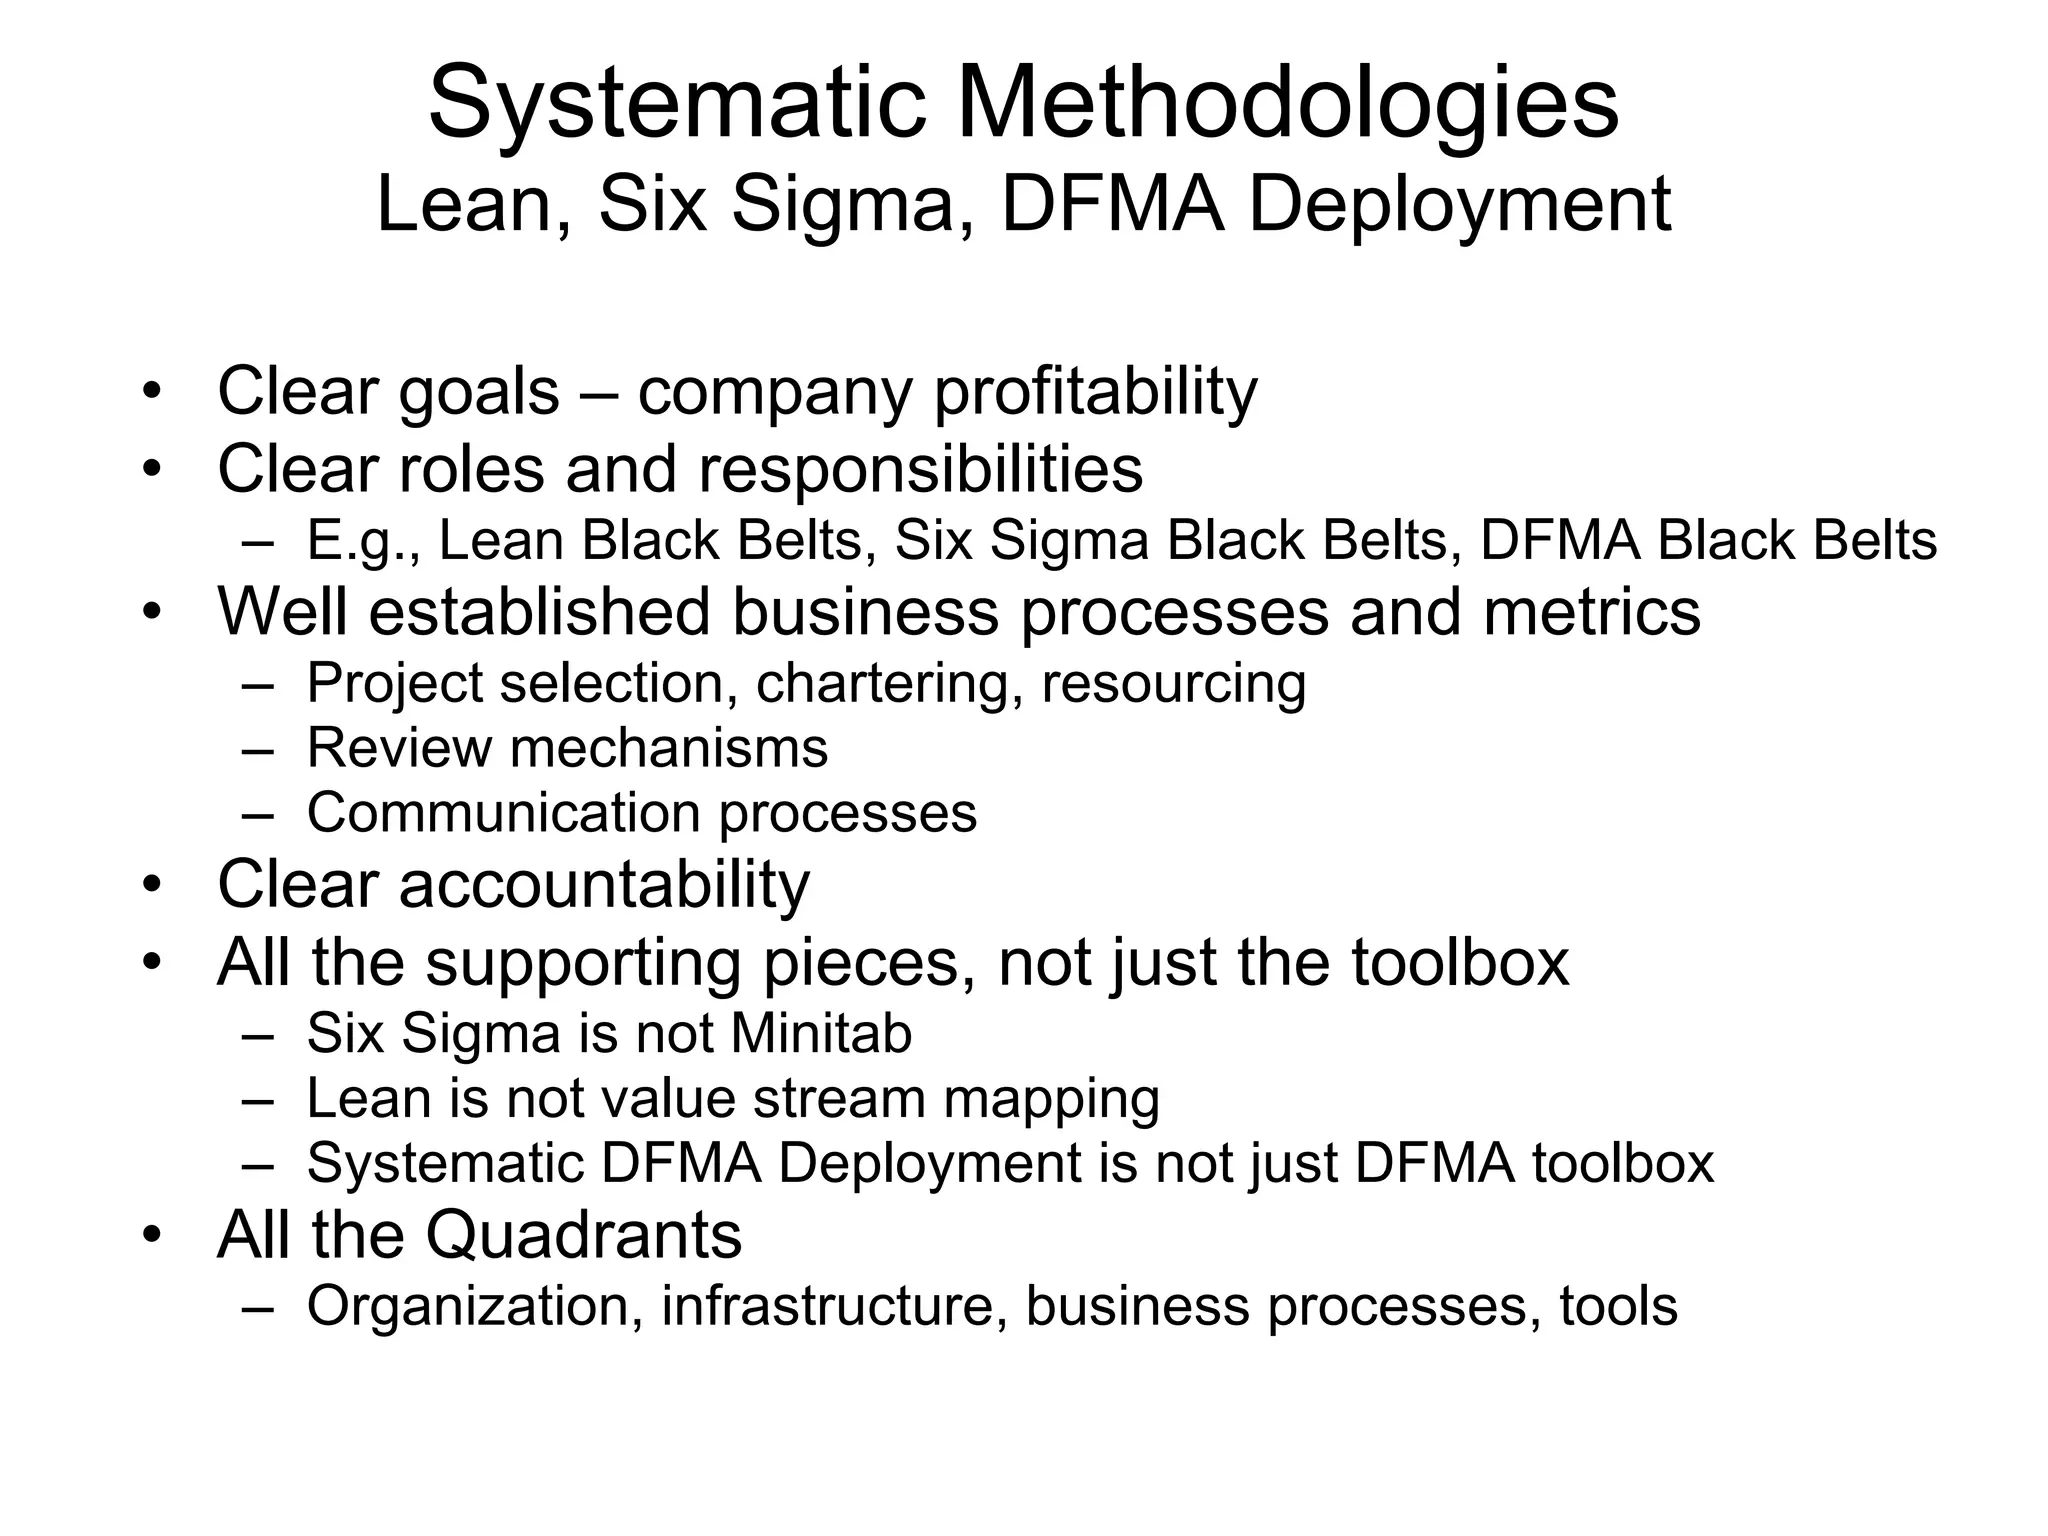
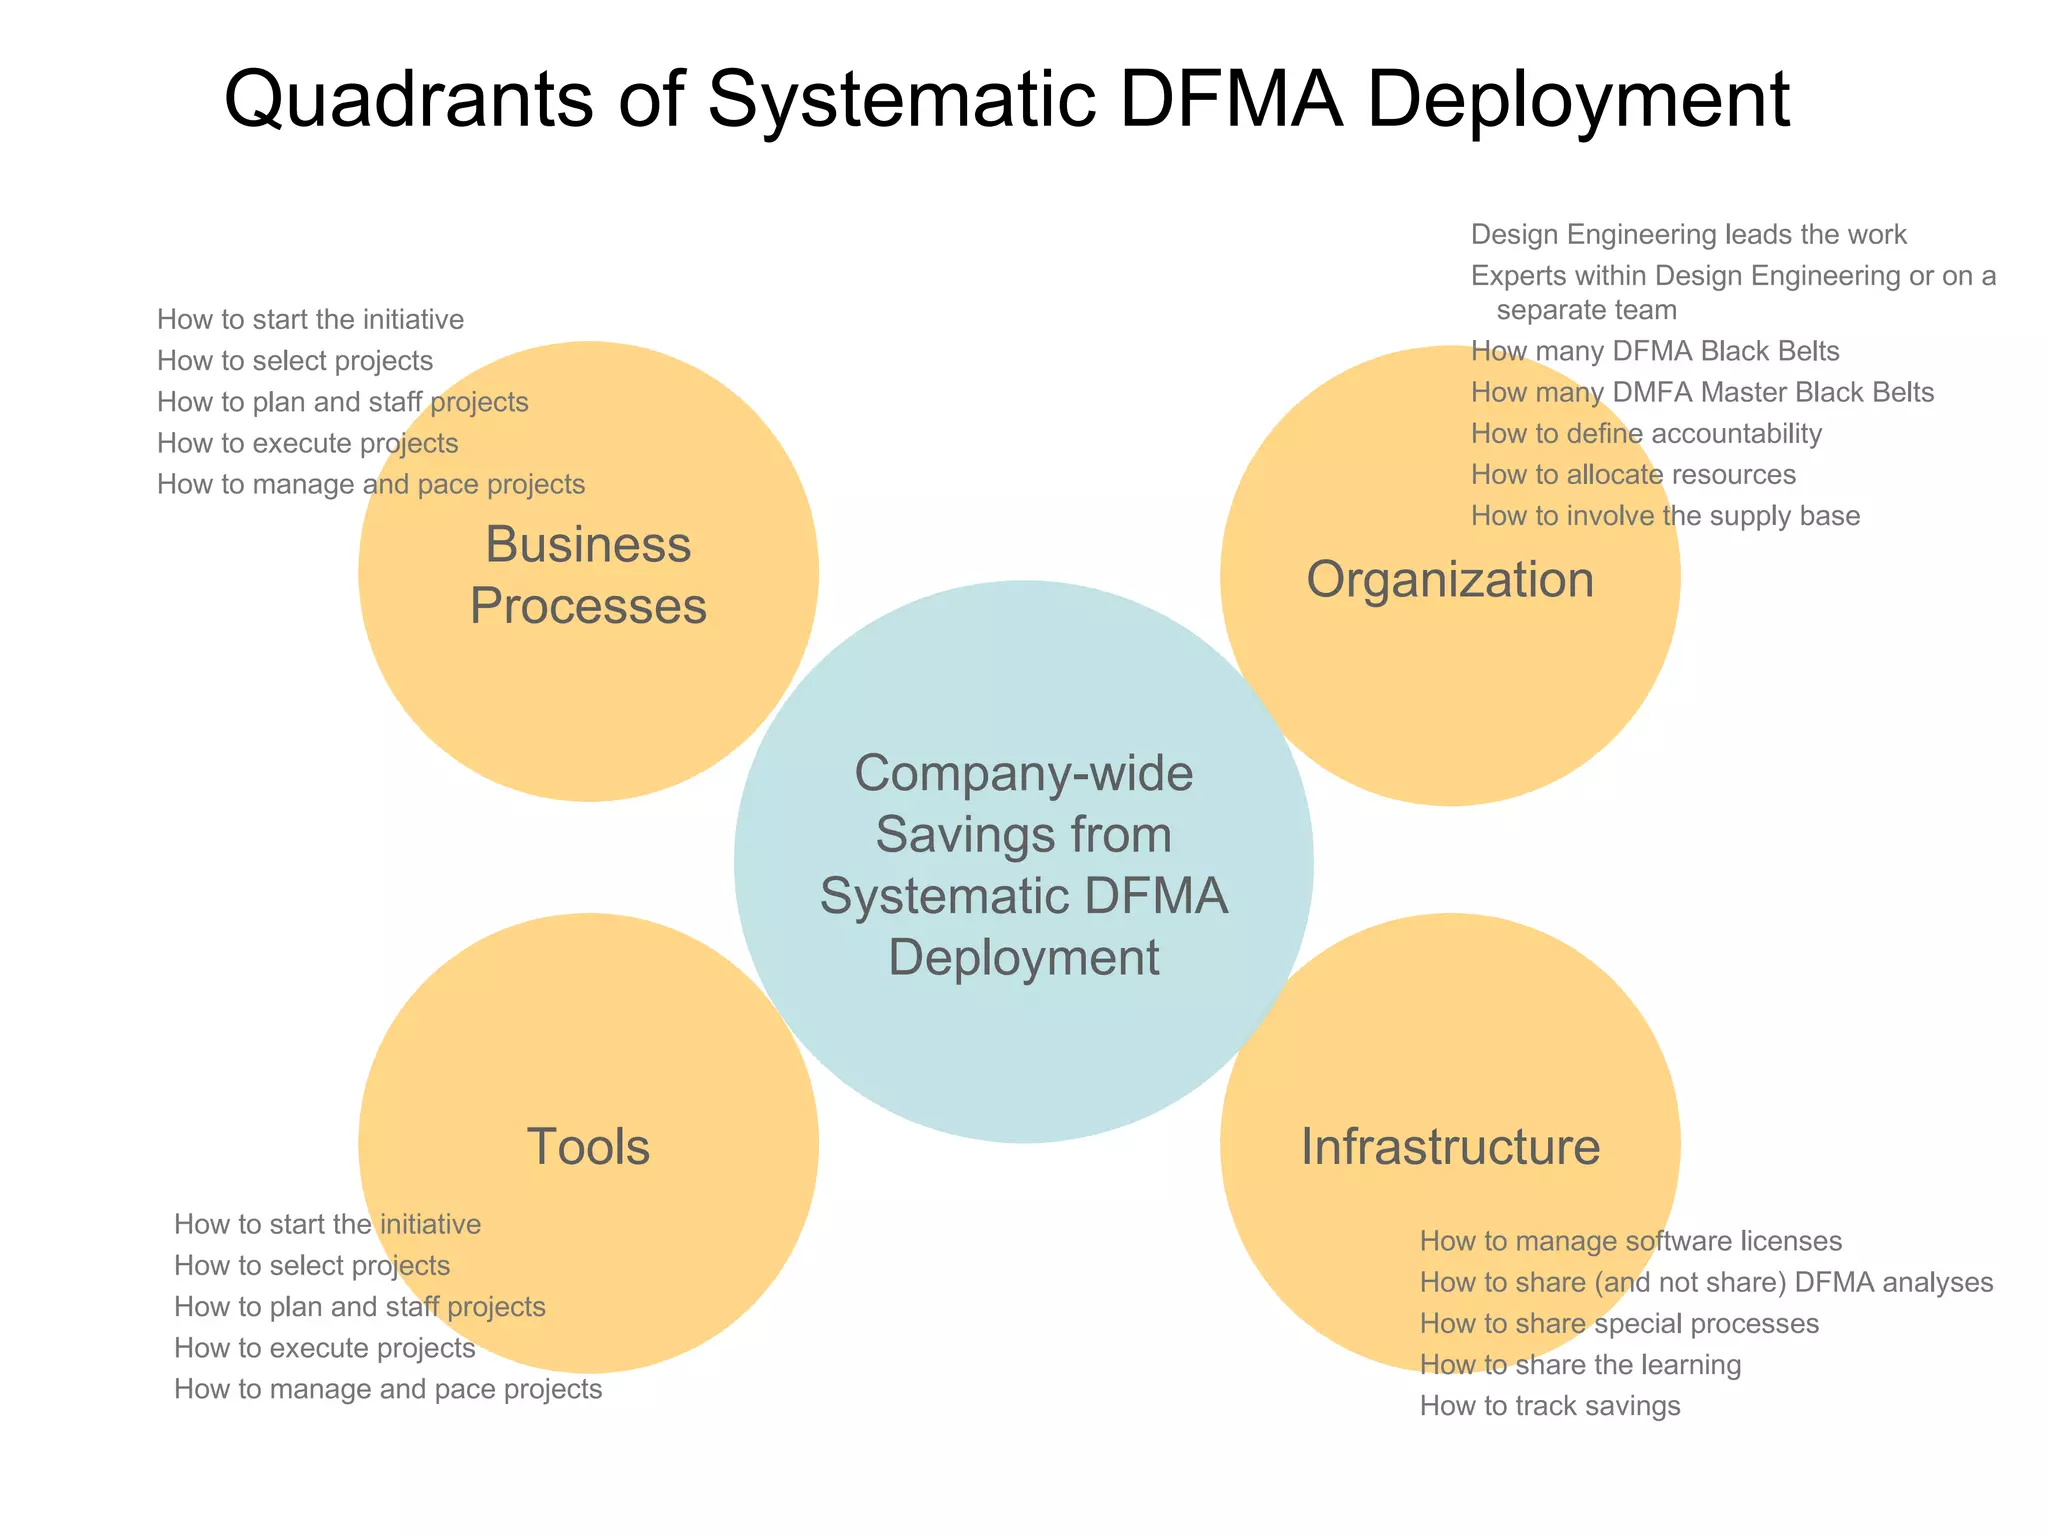
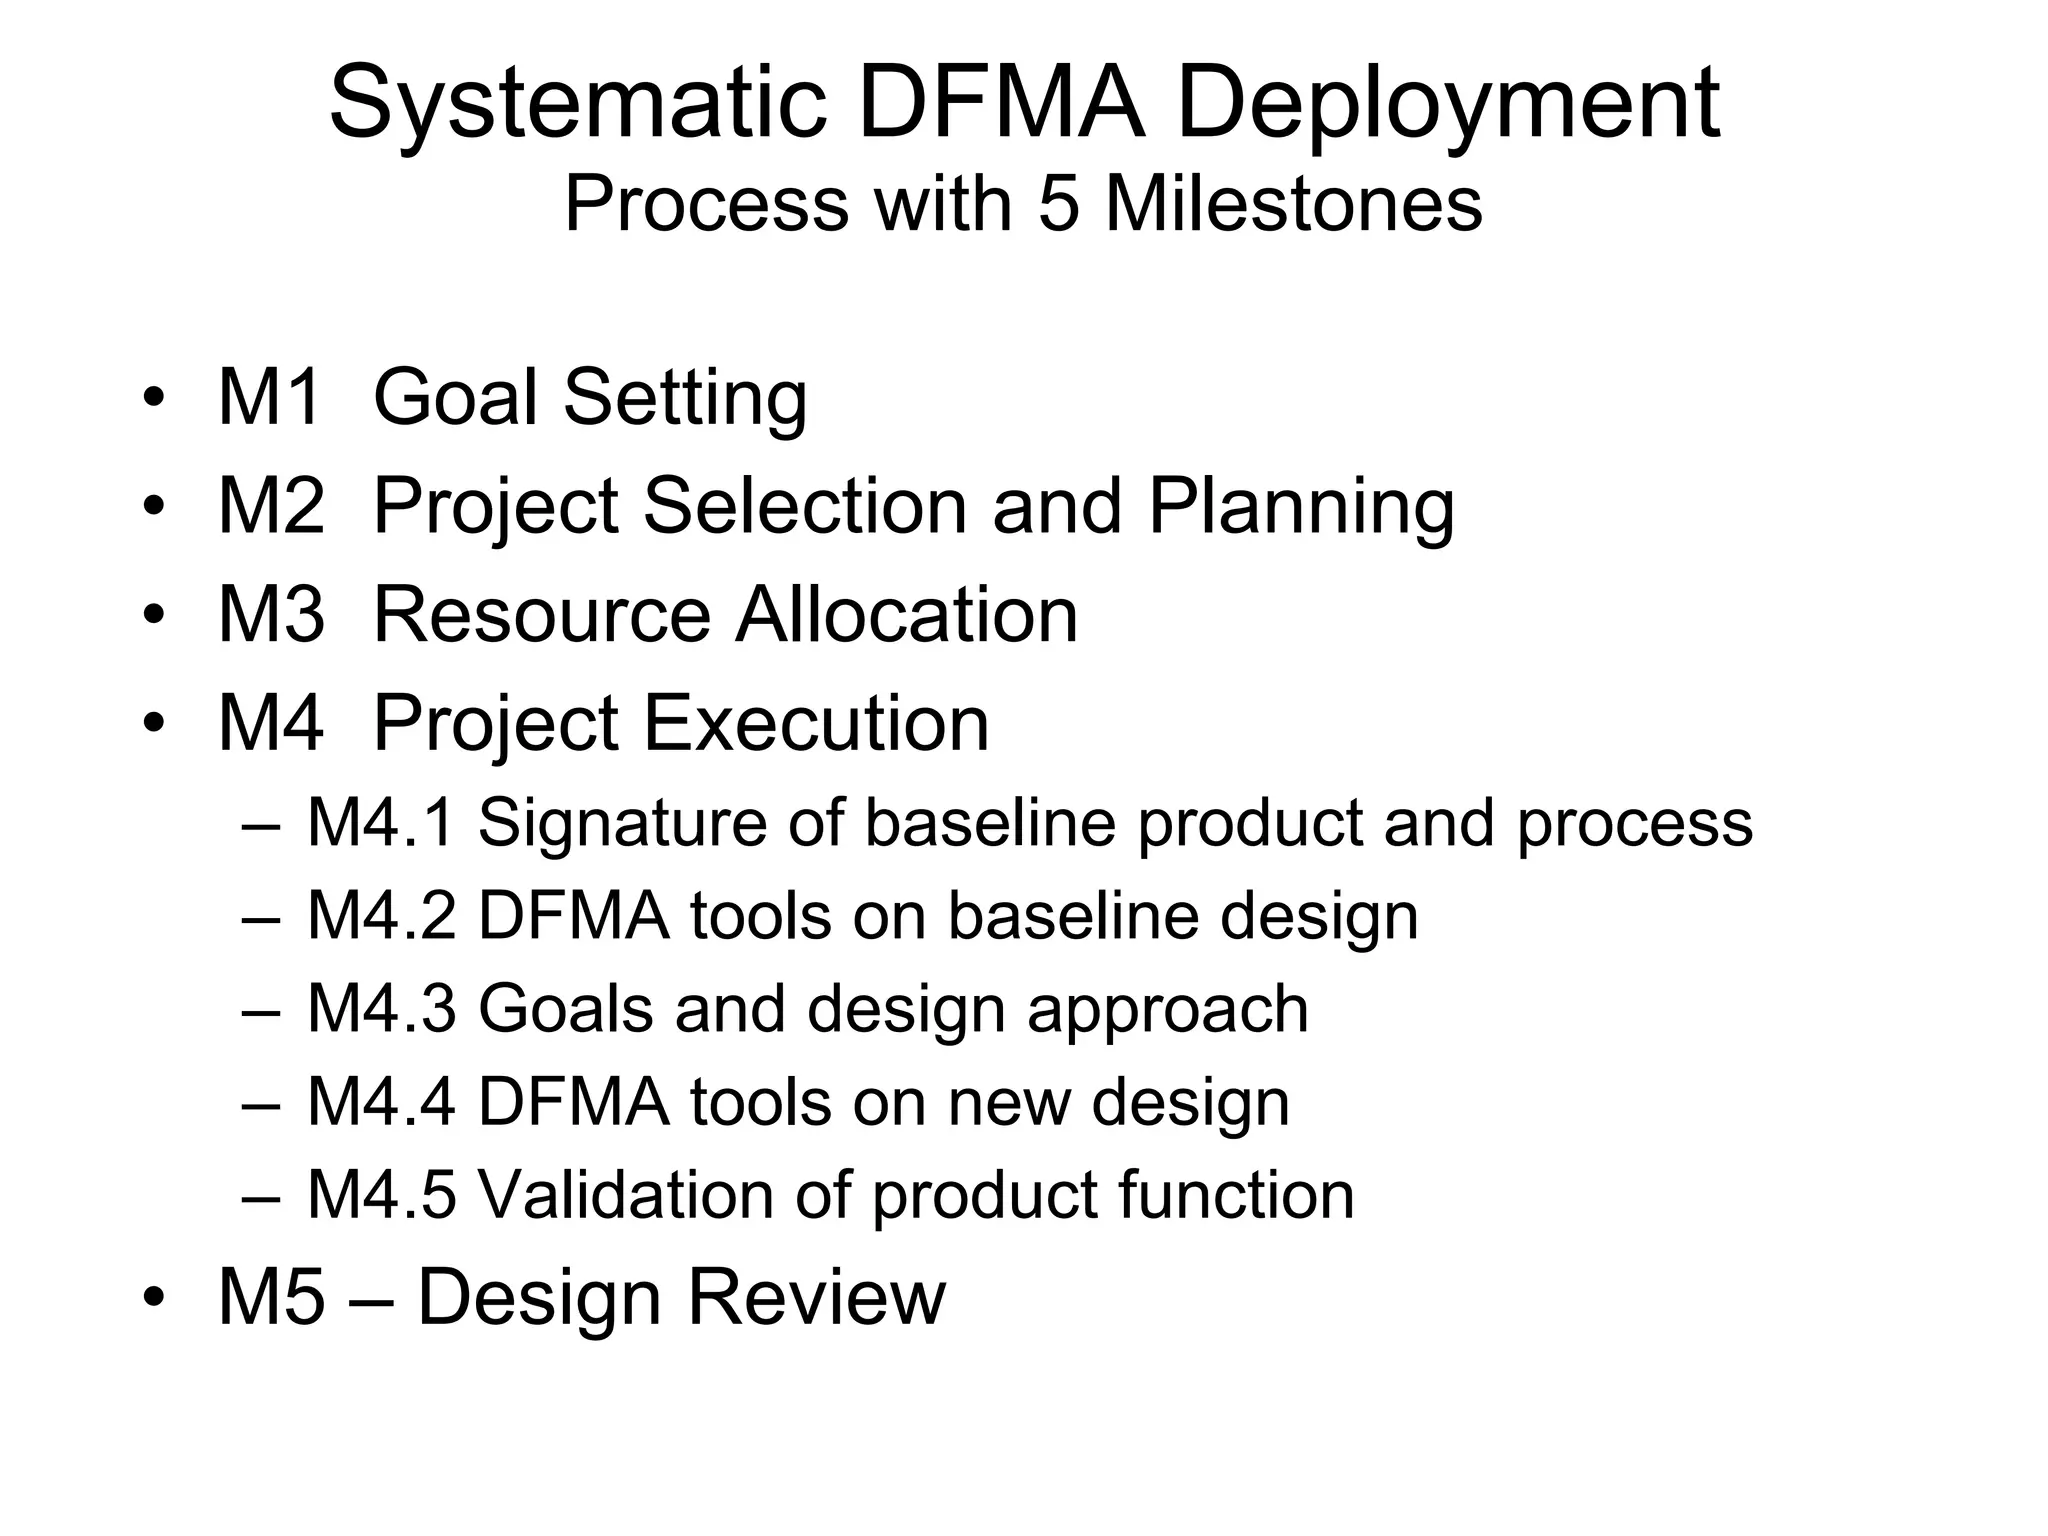

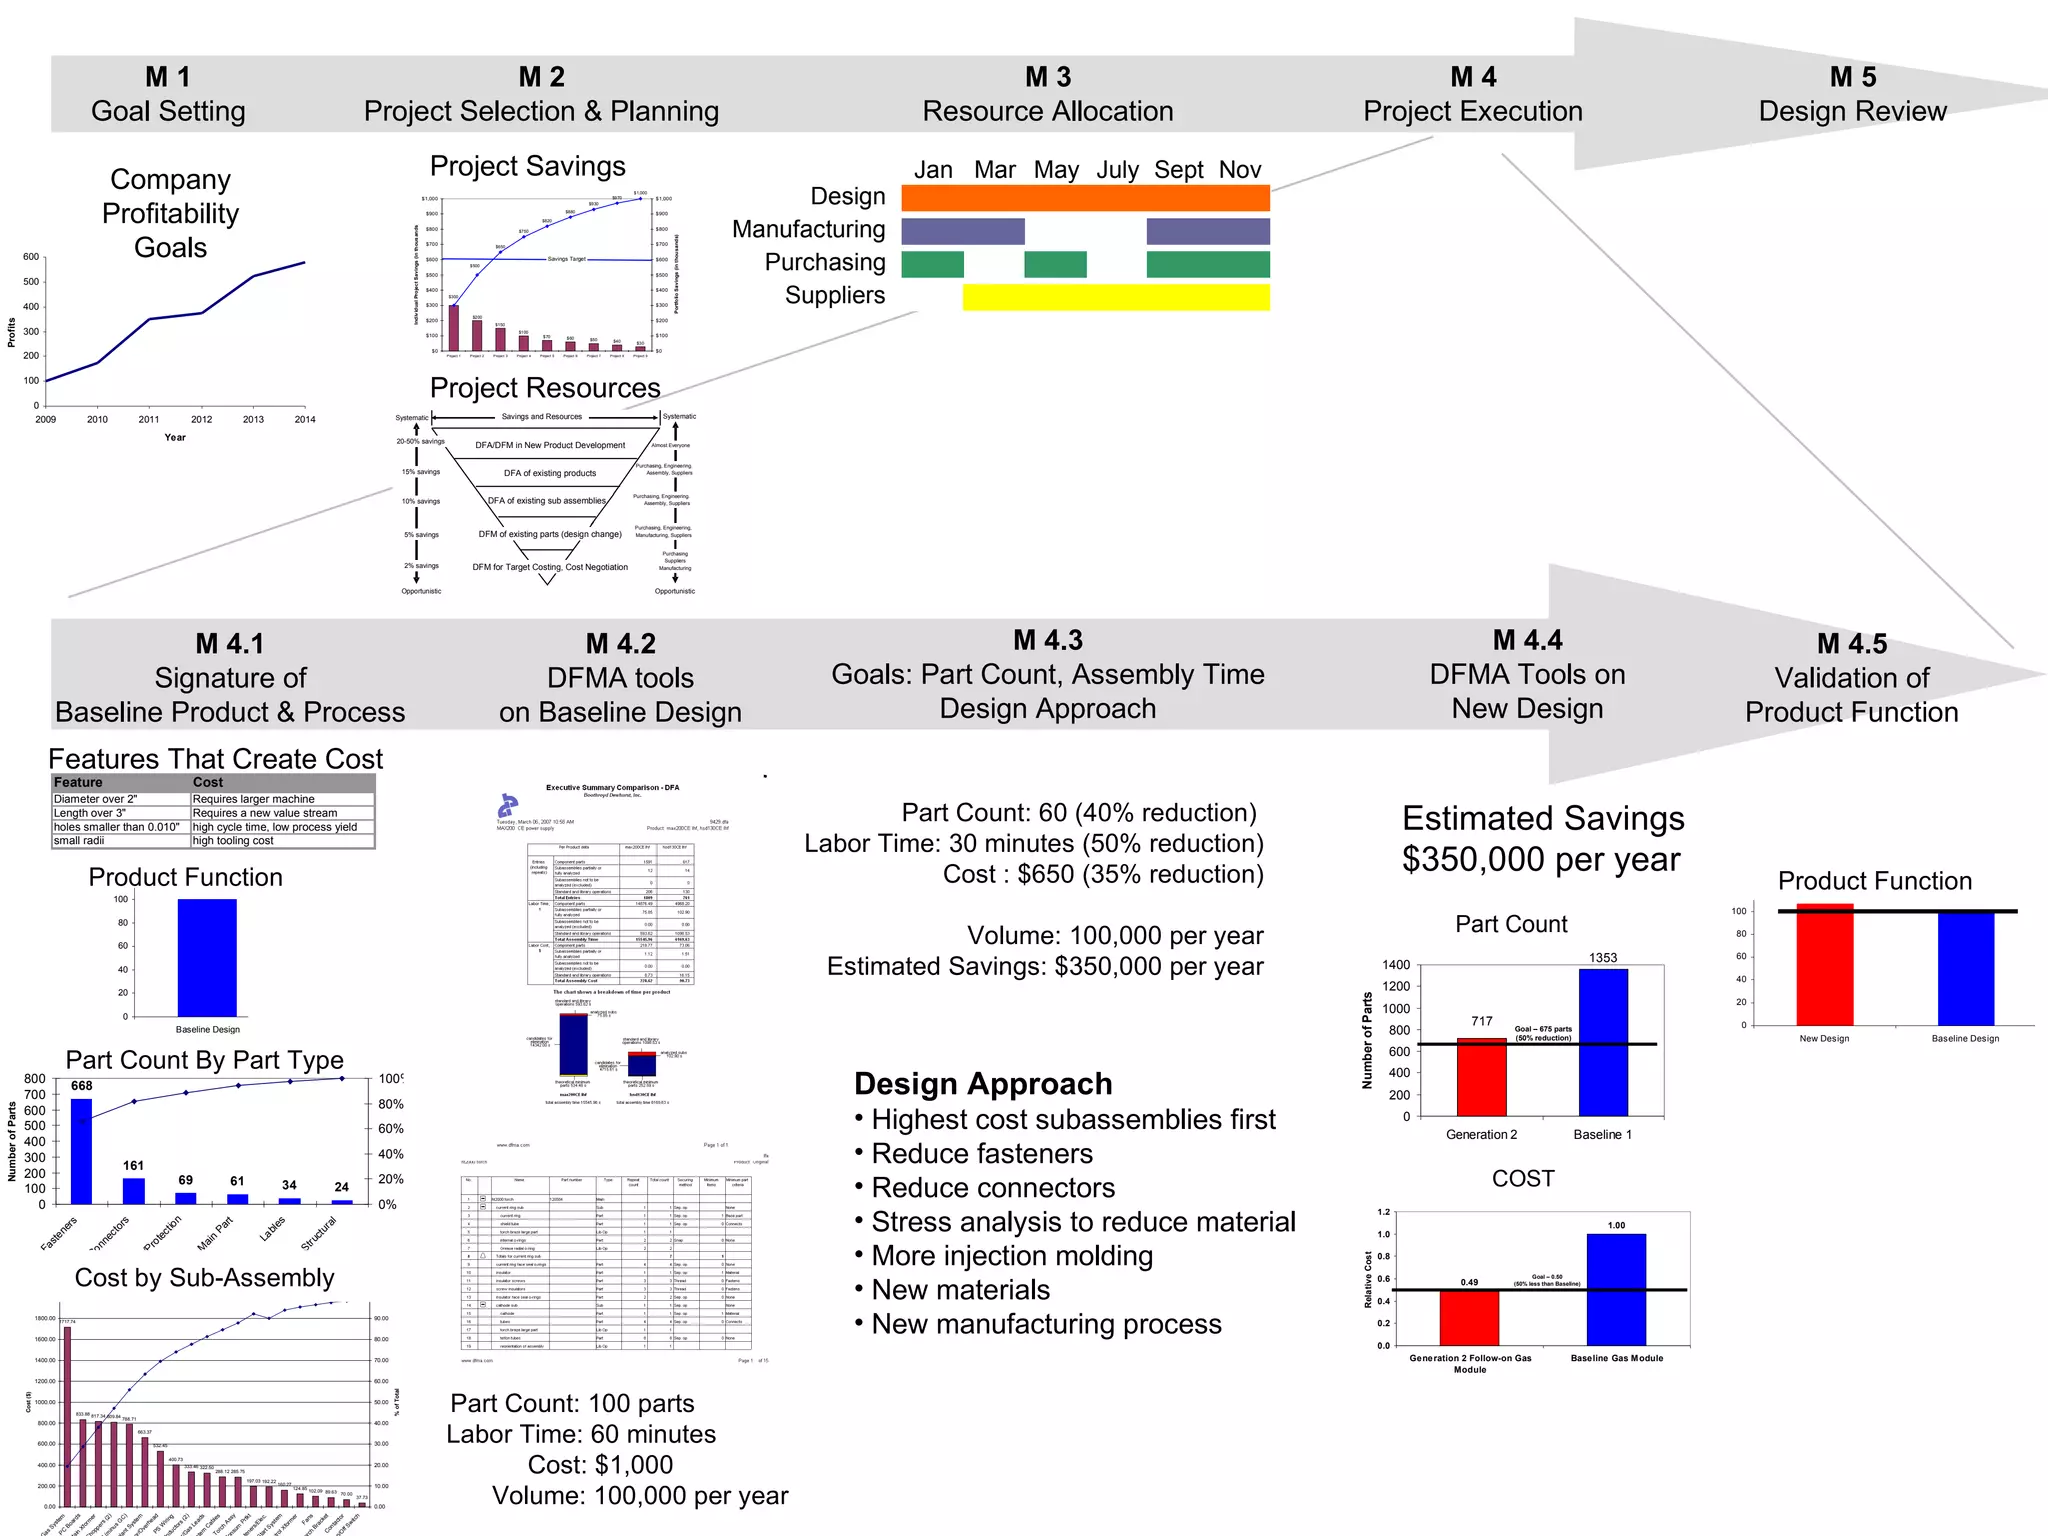

- Systematic DFMA (Design for Manufacturing and Assembly) deployment is proposed as a back-to-basics approach to reduce costs and increase profits in manufacturing through design changes. - Key aspects of a systematic DFMA deployment include establishing organizational support and accountability, selecting high-impact projects, allocating resources, executing projects through 5 milestones, and tracking savings. - When done systematically and considering organizational factors, DFMA can yield part count reductions of 20-50%, labor time reductions of 20-60%, and cost savings of 20-50% across industries.