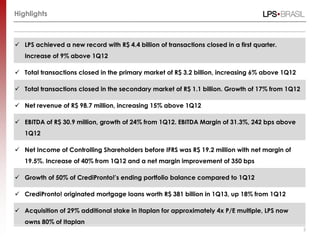
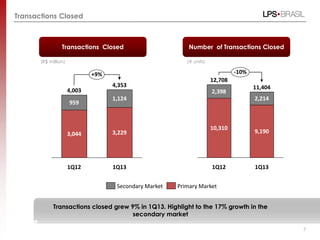
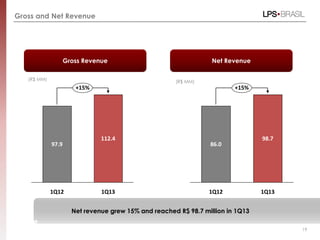
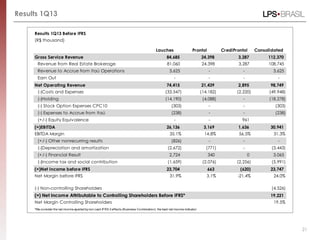
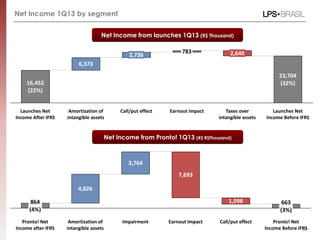
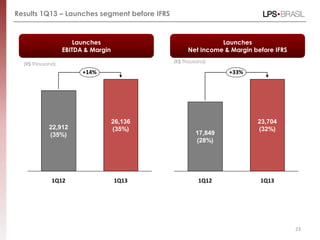
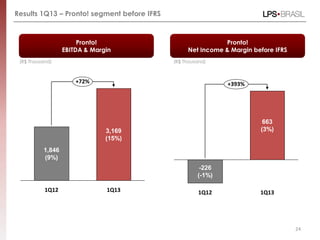
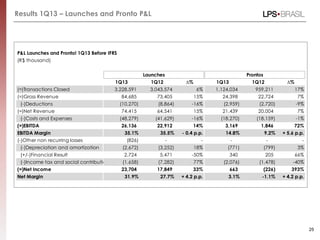
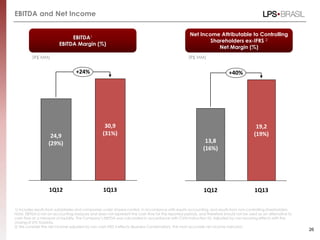
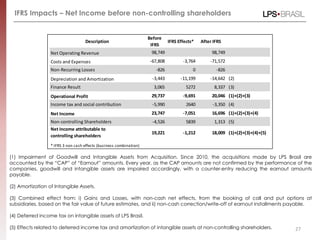
1
1Q13 Presentation
Presenters
Marcos Lopes – CEO
Francisco Lopes – COO
Marcello Leone – CFO and IRO
Bruno Gama - COO CrediPronto!
2
This presentation does not constitute or form part of any offer, or invitation or solicitation of any offer to purchase,
sell or subscribe for shares or other securities of the Company, nor shall this presentation or any information
contained herein form the basis of, or act as inducement to enter into, any contract or commitment whatsoever.
This presentation contains financial and other information related to the business operations of Lopes –LPS Brasil
Consultoria de Imóveis S.A and its subsidiaries (“LPS” or the “Company”) as of and for the period ended March
31st 2013. It should not be considered as a recommendation for prospective investors to sell, purchase or
subscribe for securities of the Company. The information presented herein is in summary form and does not
purport to be complete. No reliance should be placed on the accuracy completeness of the information
contained herein, and no representation or warranty, express or implied, is given on behalf of the Company or
its subsidiaries as to the accuracy completeness of the information presented herein.
This presentation contains forward-looking statements. Investors are advised that whilst the Company believes
they are based on reasonable assumptions by Management, forward-looking statements rely on current
expectations and projections about future events and financial trends, and are not a guarantee of future results.
Forward-looking statements are subject to risks and uncertainties that affect or may affect business conditions
and results of operations, which therefore could materially differ from those anticipated in forward-looking
statements due to several factors, including competitive pressures, Brazilian macroeconomic conditions,
performance of the industry, changes in market conditions, and other factors expressed or implied in these
forward-looking statements or disclosed by the Company elsewhere, factors currently deemed immaterial.
The forward-looking statements contained herein speak only as of the date they are made and neither
Management, nor the Company or its subsidiaries undertake any obligation to release publicly any revision to
these forward-looking statements after the date of this presentation or to reflect the occurrence of unanticipated
events.
Forward-looking statements
3
Schedule
I. Highlights
II. Operational Results
III. Credipronto!
IV. Financial Results
4
Highlights
Highlights
5
 LPS achieved a new record with R$ 4.4 billion of transactions closed in a first quarter.
Increase of 9% above 1Q12
 Total transactions closed in the primary market of R$ 3.2 billion, increasing 6% above 1Q12
 Total transactions closed in the secondary market of R$ 1.1 billion. Growth of 17% from 1Q12
 Net revenue of R$ 98.7 million, increasing 15% above 1Q12
 EBITDA of R$ 30.9 million, growth of 24% from 1Q12. EBITDA Margin of 31.3%, 242 bps above
1Q12
 Net Income of Controlling Shareholders before IFRS was R$ 19.2 million with net margin of
19.5%. Increase of 40% from 1Q12 and a net margin improvement of 350 bps
 Growth of 50% of CrediPronto!’s ending portfolio balance compared to 1Q12
 CrediPronto! originated mortgage loans worth R$ 381 billion in 1Q13, up 18% from 1Q12
 Acquisition of 29% additional stake in Itaplan for approximately 4x P/E multiple, LPS now
owns 80% of Itaplan
6
Operational Results
Transactions Closed
(R$ million)
Transactions Closed
7
Number of Transactions Closed
3,044
959
+9%
1Q13
4,353
3,229
1,124
1Q12
4,003
Primary MarketSecondary Market
12,708
10,310
1Q12
9,190
2,214
2,398
-10%
1Q13
11,404
(# units)
Transactions closed grew 9% in 1Q13. Highlight to the 17% growth in the
secondary market
Sales Speed over Supply
Lopes' Consolidated Sales Speed Habitcasa’s Sales Speed
8
1Q13
16.6%
4Q12
15.9%
1Q13
30.4%
4Q12
29.2%
(%) (%)
Transactions closed/supply ratio remains steady compared to 4Q12
Units
Transactions Closed
9
11,404 units
R$ 4,353 million
Transactions Closed by Income Segment – Primary / Secondary Markets
35%
24%
31%
10%
40%
27%
26%
6%
9%
35%
13%
43%
>600<150 150-350 350-600
12%
35%
20%
32%
R$ 4,003 million
12,708 units
1Q12 1Q13
1Q12 1Q13
Transactions Closed by Region – Primary and Secondary Market
Transactions Closed
10
6%
12%
4%
22%
51%
6%
5%
14%
4%
21%
51%
4%
Northest
South
Brasília
Rio de janeiro
São Paulo
Others
1Q12 1Q13
Increase of stake of São Paulo and South regions
Breakdown of Transactions Closed
11
Breakdown Transactions Closed
(em %)
1Q13
41%
59%
1Q12
42%
58%
Listed Homebuilders
Non Listed Homebuilders
Breakdown Transactions Closed
Primary Market
(em %)
26%
44%
31%
Listed Homebuilders
Secondary Market
Non Listed Homebuilders
Breakdown of Homebuilders
49%
53% 55%
64%
51% 47% 45%
36%
2010 2011 2012 1Q13
Other Homebuilders Top 10 Homebuilders
7,6%
9,5% 9,3% 7,1%
7,1%
5,3% 6,8%
4,6%
6,1%
5,2%
5,5%
4,6%
6,1% 5,1% 4,8%
4,5%
4,7% 4,0% 4,0% 4,3%
2010 2011 2012 1Q13
1st 2nd 3rd 4th 5th
12
Breakdown – Homebuilders Breakdown Top 5 Homebuilders
(em %) (em %)
LPS Brasil in the Mortgage Market
CrediPronto!
13
CrediPronto!
14
R$381 MM in
Mortgages
Average LTV of
59.6%
1,249 Contracts
Average Period
of 293 months
Average Rate
of 8.9% + TR
1Q13
Financed Volume
CrediPronto!
(R$ MM)
15
(R$ MM)
Mortgage Portfolio
381
322
+18%
1Q131Q12
+50%
Ending Portfolio
Balance 1Q13
2,986
Ending Portfolio
Balance 1Q12
1,989
The average portfolio balance was R$ 2.8 billion in 1Q13. The total volume
granted until Mar, 13 reached R$ 4.0 billion
CrediPronto!
392
517
707
881
1.162
1.454
1.756
1.989
2.266
2.492
2.771
2.986
Jun, 10 Sep, 10 Dec, 10 Mar, 11 Jun, 11 Sep, 11 Dec, 11 Mar, 12 Jun, 12 Sep, 12 Dec, 12 Mar, 12
16
Ending Portfolio Balance
(R$ MM)
The ending portfolio balance of Credipronto! has been grewing on average
6.3% per month since Jun,10 and reached R$ 3.0 billion in Mar, 13
Financial Results
17
18
Net Commission by Market
Net Comssion Fee
1Q11 2Q11 3Q11 4Q11 1Q12 2Q12 3Q12 4Q12 1Q13
BRAZIL 2.3% 2.4% 2.4% 2.4% 2.3% 2.4% 2.4% 2.4% 2.4%
Primary
SP 2.9% 3.0% 2.9% 3.1% 2.8% 3.1% 3.0% 2.9% 2.9%
Habitcasa 1.9% 1.9% 2.1% 2.1% 2.0% 1.9% 2.1% 2.0% 2.4%
RJ 2.2% 2.0% 2.2% 2.1% 2.1% 2.1% 2.0% 2.2% 2.2%
Other Markets 2.1% 2.1% 2.1% 2.1% 2.1% 2.0% 2.1% 2.1% 2.1%
Secondary
SP 2.2% 2.3% 2.3% 2.4% 2.2% 2.2% 2.4% 2.2% 2.3%
RJ 2.4% 2.5% 2.4% 2.3% 2.3% 2.0% 2.3% 2.2% 2.3%
Other Markets 2.1% 2.4% 2.4% 2.5% 2.3% 2.5% 2.1% 2.5% 2.0%
Gross and Net Revenue
Net Revenue
19
(R$ MM)
Gross Revenue
(R$ MM)
+15%
1Q13
112.4
1Q12
97.9
1Q13
98.7
1Q12
+15%
86.0
Net revenue grew 15% and reached R$ 98.7 million in 1Q13
Gross Revenue Reconciliation
IMPORTANT CRITERIA FOR CONTRACTED SALES
The contracted sales released in the quarter is exclusively based on the invoiced sales,
which multiplied by the net commission result in the gross revenue of the quarter.
Thus, the contracted sales meets all the criteria for accounting the Company’s gross
revenue, even including the contract approval by the homebuilder. Additional sales
generated during this same period, that do not meet all the accounting criteria were not
considered as contracted sales of the period.
20
1Q13 - Gross Revenue Reconciliation (R$ Million)
Contracted Sales (a) 4,353
Net Comission (b) 2.4%
Gross Brokerage
Revenue (a) x (b)
103.8
Revenue to Accrue from Itaú
Operations
3.6
Other revenues 6.0
Ajustment to Present Value (1.1)
Gross Revenue 112.4
Results 1Q13
21
Results 1Q13 Before IFRS
(R$ thousand)
Lauches Pronto! CrediPronto! Consolidated
Gross Service Revenue 84,685 24,398 3,287 112,370
Revenue from Real Estate Brokerage 81,060 24,398 3,287 108,745
Revenue to Accrue from Itaú Operations 3,625 - - 3,625
Earn Out - - - -
Net Operating Revenue 74,415 21,439 2,895 98,749
(-)Costs and Expenses (33,547) (14,182) (2,220) (49,948)
(-)Holding (14,190) (4,088) - (18,278)
(-) Stock Option Expenses CPC10 (303) - - (303)
(-) Expenses to Accrue from Itaú (238) - - (238)
(+/-) Equity Equivalence - - 961
(=)EBITDA 26,136 3,169 1,636 30,941
EBITDA Margin 35.1% 14.8% 56.5% 31.3%
(+/-) Other nonrecurring results (826) - - -
(-)Depreciation and amortization (2,672) (771) - (3,443)
(+/-) Financial Result 2,724 340 0 3,065
(-)Income tax and social contribution (1,659) (2,076) (2,256) (5,991)
(=)Net income before IFRS 23,704 663 (620) 23,747
Net Margin before IFRS 31.9% 3.1% -21.4% 24.0%
(-) Non-controlling Shareholders (4,526)
(=) Net Income Attributable to Controlling Shareholders Before IFRS* 19,221
Net Margin Controlling Shareholders 19.5%
*We consider the net income ajusted by non cash IFRS 3 effects (Business Combination) the best net income indicator
Net Income 1Q13 by segment
22
Launches Net
Income Before IFRS
23,704
(32%)
Taxes over
intangible assets
2,640
Earnout impact
783
Call/put effect
2,736
Amortization of
intangible assets
6,373
Launches Net
Income After IFRS
16,452
(22%)
663
(3%)
Call/put effect
1,098
Earnout Impact
7,693
Impairment
3,764
Amortization of
intangible assets
4,826
Pronto! Net
Income after IFRS
864
(4%)
Pronto! Net
Income Before IFRS
Net Income from launches 1Q13 (R$ Thousand)
Net Income from Pronto! 1Q13 (R$ R$Thousand)
23
Results 1Q13 – Launches segment before IFRS
Launches
EBITDA & Margin
Launches
Net Income & Margin before IFRS
+33%
23,704
(32%)
1Q12 1Q13
17,849
(28%)
(R$ Thousand)
(R$ Thousand)
26,136
(35%)
1Q12
22,912
(35%)
+14%
1Q13
24
Results 1Q13 – Pronto! segment before IFRS
+72%
1Q13
3,169
(15%)
1Q12
1,846
(9%)
Pronto!
EBITDA & Margin
Pronto!
Net Income & Margin before IFRS
1Q13
663
(3%)
1Q12
-226
(-1%)
+393%
(R$ Thousand) (R$ Thousand)
Results 1Q13 – Launches and Pronto P&L
25
P&L Launches and Pronto! 1Q13 Before IFRS
(R$ thousand)
1Q13 1Q12 ∆% 1Q13 1Q12 ∆%
(=)Transactions Closed 3,228,591 3,043,574 6% 1,124,034 959,211 17%
(=)Gross Revenue 84,685 73,405 15% 24,398 22,724 7%
(-)Deductions (10,270) (8,864) -16% (2,959) (2,720) -9%
(=)Net Revenue 74,415 64,541 15% 21,439 20,004 7%
(-)Costs and Expenses (48,279) (41,629) -16% (18,270) (18,159) -1%
(=)EBITDA 26,136 22,912 14% 3,169 1,846 72%
EBITDA Margin 35.1% 35.5% - 0.4 p.p. 14.8% 9.2% + 5.6 p.p.
(-)Other non recurring losses (826) - - - - -
(-)Depreciation and amortization (2,672) (3,252) 18% (771) (799) 3%
(+/-)Financial Result 2,724 5,471 -50% 340 205 66%
(-)Income tax and social contribution (1,658) (7,282) 77% (2,076) (1,478) -40%
(=)Net Income 23,704 17,849 33% 663 (226) 393%
Net Margin 31.9% 27.7% + 4.2 p.p. 3.1% -1.1% + 4.2 p.p.
Launches Prontos
EBITDA and Net Income
26
1Q13
+24%
30,9
(31%)
1Q12
24,9
(29%)
EBITDA1
EBITDA Margin (%)
(R$ MM)
1Q12
+40%
1Q13
13,8
(16%)
19,2
(19%)
Net Income Attributable to Controlling
Shareholders ex-IFRS 2
Net Margin (%)
(R$ MM)
1) Includes results from subsidiaries and companies under shared-control, in accordance with equity accounting, and results from non-controlling shareholders.
Note: EBITDA is not an accounting measure and does not represent the cash flow for the reported periods, and therefore should not be used as an alternative to
cash flow as a measure of liquidity. The Company’s EBITDA was calculated in accordance with CVM Instruction 52. Adjusted by non recurring effects with the
closing of LPS Goiania.
2) We consider the net income adjusted by non cash IFRS 3 effects (Business Combination) the most accurate net income indicator.
27
IFRS Impacts – Net Income before non-controlling shareholders
(1) Impairment of Goodwill and Intangible Assets from Acquisition. Since 2010, the acquisitions made by LPS Brasil are
accounted by the “CAP” of “Earnout” amounts. Every year, as the CAP amounts are not confirmed by the performance of the
companies, goodwill and intangible assets are impaired accordingly, with a counter-entry reducing the earnout amounts
payable.
(2) Amortization of Intangible Assets.
(3) Combined effect from: i) Gains and Losses, with non-cash net effects, from the booking of call and put options at
subsidiaries, based on the fair value of future estimates, and ii) non-cash correction/write-off of earnout installments payable.
(4) Deferred income tax on intangible assets of LPS Brasil.
(5) Effects related to deferred income tax and amortization of intangible assets at non-controlling shareholders.
Description
Before
IFRS
IFRS Effects* After IFRS
Net Operating Revenue 98,749 98,749
Costs and Expenses -67,808 -3,764 -71,572
Non-Recurring Losses -826 0 -826
Depreciation and Amortization -3,443 -11,199 -14,642 (2)
Finance Result 3,065 5272 8,337 (3)
Operational Profit 29,737 -9,691 20,046 (1)+(2)+(3)
Income tax and social contribution -5,990 2640 -3,350 (4)
Net Income 23,747 -7,051 16,696 (1)+(2)+(3)+(4)
Non-controlling Shareholders -4,526 5839 1,313 (5)
Net Income attributable to
controlling shareholders
19,221 -1,212 18,009 (1)+(2)+(3)+(4)+(5)
* IFRS 3 non cash effects (business combination)
CONTACTS
Marcello Leone
CFO and IRO
Tel. +55 (11) 3067-0015
IR
Tel. +55 (11) 3067-0218
E-mail: ri@lopes.com.br
www.lopes.com.br/ir
28

Results presentation 1 q13_vfinal

  • 1.
    1 1Q13 Presentation Presenters Marcos Lopes– CEO Francisco Lopes – COO Marcello Leone – CFO and IRO Bruno Gama - COO CrediPronto!
  • 2.
    2 This presentation doesnot constitute or form part of any offer, or invitation or solicitation of any offer to purchase, sell or subscribe for shares or other securities of the Company, nor shall this presentation or any information contained herein form the basis of, or act as inducement to enter into, any contract or commitment whatsoever. This presentation contains financial and other information related to the business operations of Lopes –LPS Brasil Consultoria de Imóveis S.A and its subsidiaries (“LPS” or the “Company”) as of and for the period ended March 31st 2013. It should not be considered as a recommendation for prospective investors to sell, purchase or subscribe for securities of the Company. The information presented herein is in summary form and does not purport to be complete. No reliance should be placed on the accuracy completeness of the information contained herein, and no representation or warranty, express or implied, is given on behalf of the Company or its subsidiaries as to the accuracy completeness of the information presented herein. This presentation contains forward-looking statements. Investors are advised that whilst the Company believes they are based on reasonable assumptions by Management, forward-looking statements rely on current expectations and projections about future events and financial trends, and are not a guarantee of future results. Forward-looking statements are subject to risks and uncertainties that affect or may affect business conditions and results of operations, which therefore could materially differ from those anticipated in forward-looking statements due to several factors, including competitive pressures, Brazilian macroeconomic conditions, performance of the industry, changes in market conditions, and other factors expressed or implied in these forward-looking statements or disclosed by the Company elsewhere, factors currently deemed immaterial. The forward-looking statements contained herein speak only as of the date they are made and neither Management, nor the Company or its subsidiaries undertake any obligation to release publicly any revision to these forward-looking statements after the date of this presentation or to reflect the occurrence of unanticipated events. Forward-looking statements
  • 3.
    3 Schedule I. Highlights II. OperationalResults III. Credipronto! IV. Financial Results
  • 4.
  • 5.
    Highlights 5  LPS achieveda new record with R$ 4.4 billion of transactions closed in a first quarter. Increase of 9% above 1Q12  Total transactions closed in the primary market of R$ 3.2 billion, increasing 6% above 1Q12  Total transactions closed in the secondary market of R$ 1.1 billion. Growth of 17% from 1Q12  Net revenue of R$ 98.7 million, increasing 15% above 1Q12  EBITDA of R$ 30.9 million, growth of 24% from 1Q12. EBITDA Margin of 31.3%, 242 bps above 1Q12  Net Income of Controlling Shareholders before IFRS was R$ 19.2 million with net margin of 19.5%. Increase of 40% from 1Q12 and a net margin improvement of 350 bps  Growth of 50% of CrediPronto!’s ending portfolio balance compared to 1Q12  CrediPronto! originated mortgage loans worth R$ 381 billion in 1Q13, up 18% from 1Q12  Acquisition of 29% additional stake in Itaplan for approximately 4x P/E multiple, LPS now owns 80% of Itaplan
  • 6.
  • 7.
    Transactions Closed (R$ million) TransactionsClosed 7 Number of Transactions Closed 3,044 959 +9% 1Q13 4,353 3,229 1,124 1Q12 4,003 Primary MarketSecondary Market 12,708 10,310 1Q12 9,190 2,214 2,398 -10% 1Q13 11,404 (# units) Transactions closed grew 9% in 1Q13. Highlight to the 17% growth in the secondary market
  • 8.
    Sales Speed overSupply Lopes' Consolidated Sales Speed Habitcasa’s Sales Speed 8 1Q13 16.6% 4Q12 15.9% 1Q13 30.4% 4Q12 29.2% (%) (%) Transactions closed/supply ratio remains steady compared to 4Q12
  • 9.
    Units Transactions Closed 9 11,404 units R$4,353 million Transactions Closed by Income Segment – Primary / Secondary Markets 35% 24% 31% 10% 40% 27% 26% 6% 9% 35% 13% 43% >600<150 150-350 350-600 12% 35% 20% 32% R$ 4,003 million 12,708 units 1Q12 1Q13 1Q12 1Q13
  • 10.
    Transactions Closed byRegion – Primary and Secondary Market Transactions Closed 10 6% 12% 4% 22% 51% 6% 5% 14% 4% 21% 51% 4% Northest South Brasília Rio de janeiro São Paulo Others 1Q12 1Q13 Increase of stake of São Paulo and South regions
  • 11.
    Breakdown of TransactionsClosed 11 Breakdown Transactions Closed (em %) 1Q13 41% 59% 1Q12 42% 58% Listed Homebuilders Non Listed Homebuilders Breakdown Transactions Closed Primary Market (em %) 26% 44% 31% Listed Homebuilders Secondary Market Non Listed Homebuilders
  • 12.
    Breakdown of Homebuilders 49% 53%55% 64% 51% 47% 45% 36% 2010 2011 2012 1Q13 Other Homebuilders Top 10 Homebuilders 7,6% 9,5% 9,3% 7,1% 7,1% 5,3% 6,8% 4,6% 6,1% 5,2% 5,5% 4,6% 6,1% 5,1% 4,8% 4,5% 4,7% 4,0% 4,0% 4,3% 2010 2011 2012 1Q13 1st 2nd 3rd 4th 5th 12 Breakdown – Homebuilders Breakdown Top 5 Homebuilders (em %) (em %)
  • 13.
    LPS Brasil inthe Mortgage Market CrediPronto! 13
  • 14.
    CrediPronto! 14 R$381 MM in Mortgages AverageLTV of 59.6% 1,249 Contracts Average Period of 293 months Average Rate of 8.9% + TR 1Q13
  • 15.
    Financed Volume CrediPronto! (R$ MM) 15 (R$MM) Mortgage Portfolio 381 322 +18% 1Q131Q12 +50% Ending Portfolio Balance 1Q13 2,986 Ending Portfolio Balance 1Q12 1,989 The average portfolio balance was R$ 2.8 billion in 1Q13. The total volume granted until Mar, 13 reached R$ 4.0 billion
  • 16.
    CrediPronto! 392 517 707 881 1.162 1.454 1.756 1.989 2.266 2.492 2.771 2.986 Jun, 10 Sep,10 Dec, 10 Mar, 11 Jun, 11 Sep, 11 Dec, 11 Mar, 12 Jun, 12 Sep, 12 Dec, 12 Mar, 12 16 Ending Portfolio Balance (R$ MM) The ending portfolio balance of Credipronto! has been grewing on average 6.3% per month since Jun,10 and reached R$ 3.0 billion in Mar, 13
  • 17.
  • 18.
    18 Net Commission byMarket Net Comssion Fee 1Q11 2Q11 3Q11 4Q11 1Q12 2Q12 3Q12 4Q12 1Q13 BRAZIL 2.3% 2.4% 2.4% 2.4% 2.3% 2.4% 2.4% 2.4% 2.4% Primary SP 2.9% 3.0% 2.9% 3.1% 2.8% 3.1% 3.0% 2.9% 2.9% Habitcasa 1.9% 1.9% 2.1% 2.1% 2.0% 1.9% 2.1% 2.0% 2.4% RJ 2.2% 2.0% 2.2% 2.1% 2.1% 2.1% 2.0% 2.2% 2.2% Other Markets 2.1% 2.1% 2.1% 2.1% 2.1% 2.0% 2.1% 2.1% 2.1% Secondary SP 2.2% 2.3% 2.3% 2.4% 2.2% 2.2% 2.4% 2.2% 2.3% RJ 2.4% 2.5% 2.4% 2.3% 2.3% 2.0% 2.3% 2.2% 2.3% Other Markets 2.1% 2.4% 2.4% 2.5% 2.3% 2.5% 2.1% 2.5% 2.0%
  • 19.
    Gross and NetRevenue Net Revenue 19 (R$ MM) Gross Revenue (R$ MM) +15% 1Q13 112.4 1Q12 97.9 1Q13 98.7 1Q12 +15% 86.0 Net revenue grew 15% and reached R$ 98.7 million in 1Q13
  • 20.
    Gross Revenue Reconciliation IMPORTANTCRITERIA FOR CONTRACTED SALES The contracted sales released in the quarter is exclusively based on the invoiced sales, which multiplied by the net commission result in the gross revenue of the quarter. Thus, the contracted sales meets all the criteria for accounting the Company’s gross revenue, even including the contract approval by the homebuilder. Additional sales generated during this same period, that do not meet all the accounting criteria were not considered as contracted sales of the period. 20 1Q13 - Gross Revenue Reconciliation (R$ Million) Contracted Sales (a) 4,353 Net Comission (b) 2.4% Gross Brokerage Revenue (a) x (b) 103.8 Revenue to Accrue from Itaú Operations 3.6 Other revenues 6.0 Ajustment to Present Value (1.1) Gross Revenue 112.4
  • 21.
    Results 1Q13 21 Results 1Q13Before IFRS (R$ thousand) Lauches Pronto! CrediPronto! Consolidated Gross Service Revenue 84,685 24,398 3,287 112,370 Revenue from Real Estate Brokerage 81,060 24,398 3,287 108,745 Revenue to Accrue from Itaú Operations 3,625 - - 3,625 Earn Out - - - - Net Operating Revenue 74,415 21,439 2,895 98,749 (-)Costs and Expenses (33,547) (14,182) (2,220) (49,948) (-)Holding (14,190) (4,088) - (18,278) (-) Stock Option Expenses CPC10 (303) - - (303) (-) Expenses to Accrue from Itaú (238) - - (238) (+/-) Equity Equivalence - - 961 (=)EBITDA 26,136 3,169 1,636 30,941 EBITDA Margin 35.1% 14.8% 56.5% 31.3% (+/-) Other nonrecurring results (826) - - - (-)Depreciation and amortization (2,672) (771) - (3,443) (+/-) Financial Result 2,724 340 0 3,065 (-)Income tax and social contribution (1,659) (2,076) (2,256) (5,991) (=)Net income before IFRS 23,704 663 (620) 23,747 Net Margin before IFRS 31.9% 3.1% -21.4% 24.0% (-) Non-controlling Shareholders (4,526) (=) Net Income Attributable to Controlling Shareholders Before IFRS* 19,221 Net Margin Controlling Shareholders 19.5% *We consider the net income ajusted by non cash IFRS 3 effects (Business Combination) the best net income indicator
  • 22.
    Net Income 1Q13by segment 22 Launches Net Income Before IFRS 23,704 (32%) Taxes over intangible assets 2,640 Earnout impact 783 Call/put effect 2,736 Amortization of intangible assets 6,373 Launches Net Income After IFRS 16,452 (22%) 663 (3%) Call/put effect 1,098 Earnout Impact 7,693 Impairment 3,764 Amortization of intangible assets 4,826 Pronto! Net Income after IFRS 864 (4%) Pronto! Net Income Before IFRS Net Income from launches 1Q13 (R$ Thousand) Net Income from Pronto! 1Q13 (R$ R$Thousand)
  • 23.
    23 Results 1Q13 –Launches segment before IFRS Launches EBITDA & Margin Launches Net Income & Margin before IFRS +33% 23,704 (32%) 1Q12 1Q13 17,849 (28%) (R$ Thousand) (R$ Thousand) 26,136 (35%) 1Q12 22,912 (35%) +14% 1Q13
  • 24.
    24 Results 1Q13 –Pronto! segment before IFRS +72% 1Q13 3,169 (15%) 1Q12 1,846 (9%) Pronto! EBITDA & Margin Pronto! Net Income & Margin before IFRS 1Q13 663 (3%) 1Q12 -226 (-1%) +393% (R$ Thousand) (R$ Thousand)
  • 25.
    Results 1Q13 –Launches and Pronto P&L 25 P&L Launches and Pronto! 1Q13 Before IFRS (R$ thousand) 1Q13 1Q12 ∆% 1Q13 1Q12 ∆% (=)Transactions Closed 3,228,591 3,043,574 6% 1,124,034 959,211 17% (=)Gross Revenue 84,685 73,405 15% 24,398 22,724 7% (-)Deductions (10,270) (8,864) -16% (2,959) (2,720) -9% (=)Net Revenue 74,415 64,541 15% 21,439 20,004 7% (-)Costs and Expenses (48,279) (41,629) -16% (18,270) (18,159) -1% (=)EBITDA 26,136 22,912 14% 3,169 1,846 72% EBITDA Margin 35.1% 35.5% - 0.4 p.p. 14.8% 9.2% + 5.6 p.p. (-)Other non recurring losses (826) - - - - - (-)Depreciation and amortization (2,672) (3,252) 18% (771) (799) 3% (+/-)Financial Result 2,724 5,471 -50% 340 205 66% (-)Income tax and social contribution (1,658) (7,282) 77% (2,076) (1,478) -40% (=)Net Income 23,704 17,849 33% 663 (226) 393% Net Margin 31.9% 27.7% + 4.2 p.p. 3.1% -1.1% + 4.2 p.p. Launches Prontos
  • 26.
    EBITDA and NetIncome 26 1Q13 +24% 30,9 (31%) 1Q12 24,9 (29%) EBITDA1 EBITDA Margin (%) (R$ MM) 1Q12 +40% 1Q13 13,8 (16%) 19,2 (19%) Net Income Attributable to Controlling Shareholders ex-IFRS 2 Net Margin (%) (R$ MM) 1) Includes results from subsidiaries and companies under shared-control, in accordance with equity accounting, and results from non-controlling shareholders. Note: EBITDA is not an accounting measure and does not represent the cash flow for the reported periods, and therefore should not be used as an alternative to cash flow as a measure of liquidity. The Company’s EBITDA was calculated in accordance with CVM Instruction 52. Adjusted by non recurring effects with the closing of LPS Goiania. 2) We consider the net income adjusted by non cash IFRS 3 effects (Business Combination) the most accurate net income indicator.
  • 27.
    27 IFRS Impacts –Net Income before non-controlling shareholders (1) Impairment of Goodwill and Intangible Assets from Acquisition. Since 2010, the acquisitions made by LPS Brasil are accounted by the “CAP” of “Earnout” amounts. Every year, as the CAP amounts are not confirmed by the performance of the companies, goodwill and intangible assets are impaired accordingly, with a counter-entry reducing the earnout amounts payable. (2) Amortization of Intangible Assets. (3) Combined effect from: i) Gains and Losses, with non-cash net effects, from the booking of call and put options at subsidiaries, based on the fair value of future estimates, and ii) non-cash correction/write-off of earnout installments payable. (4) Deferred income tax on intangible assets of LPS Brasil. (5) Effects related to deferred income tax and amortization of intangible assets at non-controlling shareholders. Description Before IFRS IFRS Effects* After IFRS Net Operating Revenue 98,749 98,749 Costs and Expenses -67,808 -3,764 -71,572 Non-Recurring Losses -826 0 -826 Depreciation and Amortization -3,443 -11,199 -14,642 (2) Finance Result 3,065 5272 8,337 (3) Operational Profit 29,737 -9,691 20,046 (1)+(2)+(3) Income tax and social contribution -5,990 2640 -3,350 (4) Net Income 23,747 -7,051 16,696 (1)+(2)+(3)+(4) Non-controlling Shareholders -4,526 5839 1,313 (5) Net Income attributable to controlling shareholders 19,221 -1,212 18,009 (1)+(2)+(3)+(4)+(5) * IFRS 3 non cash effects (business combination)
  • 28.
    CONTACTS Marcello Leone CFO andIRO Tel. +55 (11) 3067-0015 IR Tel. +55 (11) 3067-0218 E-mail: ri@lopes.com.br www.lopes.com.br/ir 28