Download to read offline


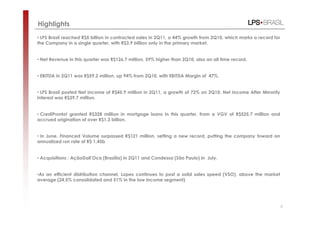
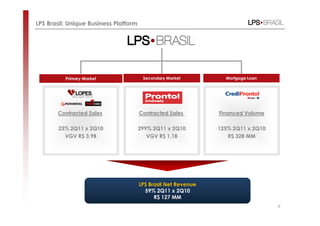
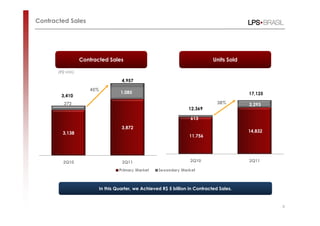
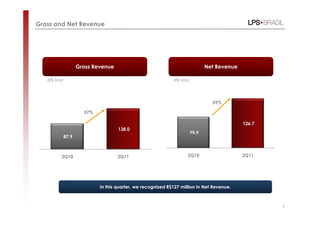
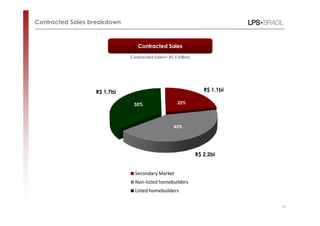

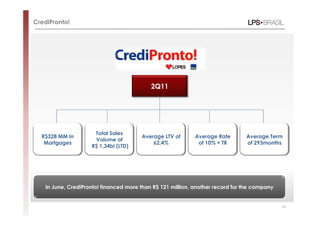
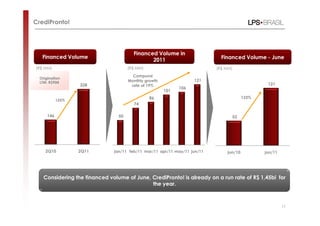
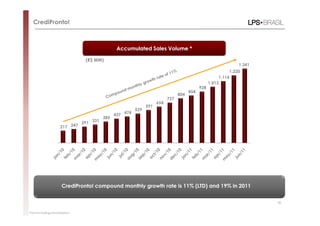

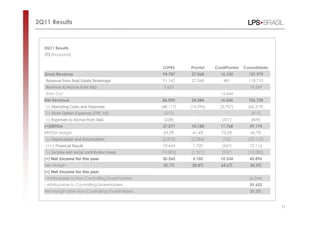
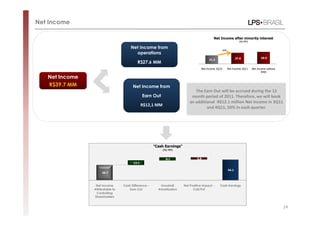
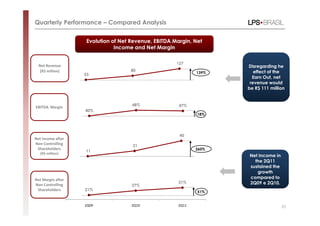

The presentation provides an overview of LPS Brasil's operational and financial results for the second quarter of 2011, highlighting record contracted sales of R$5 billion, net revenue of R$127 million (up 59% year-over-year), and net income of R$39.7 million. CrediPronto also achieved strong growth in mortgage originations and financed volume.


