Download to read offline


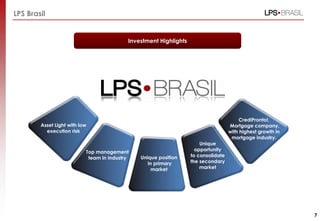
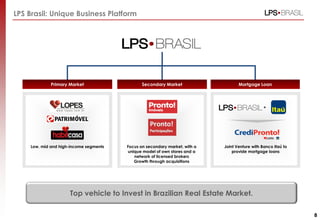
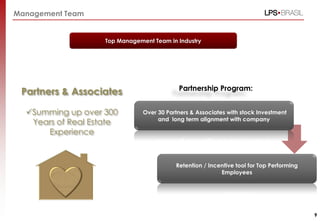
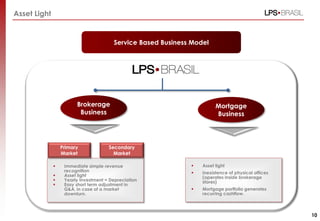

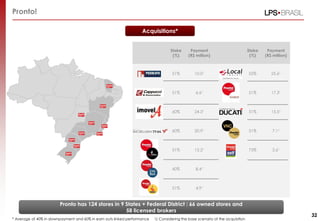
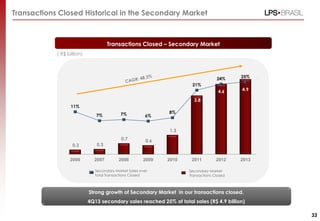

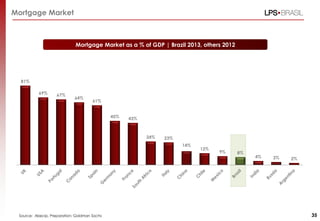
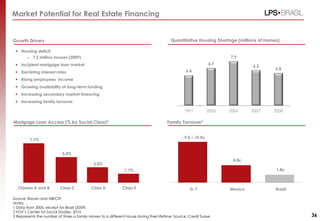


The document is an institutional presentation by LPS Brasil - Consultoria de Imóveis S.A. detailing the company's operations and performance in the 4th quarter of 2013. It discusses LPS Brasil's leadership position in the Brazilian real estate brokerage and mortgage lending industries, strong brand recognition, experienced management team, and growth strategy of expanding nationally through acquisitions while focusing on high-growth market segments. Financial highlights show increasing transaction volumes and market share across LPS Brasil's different business units.


