Download to read offline
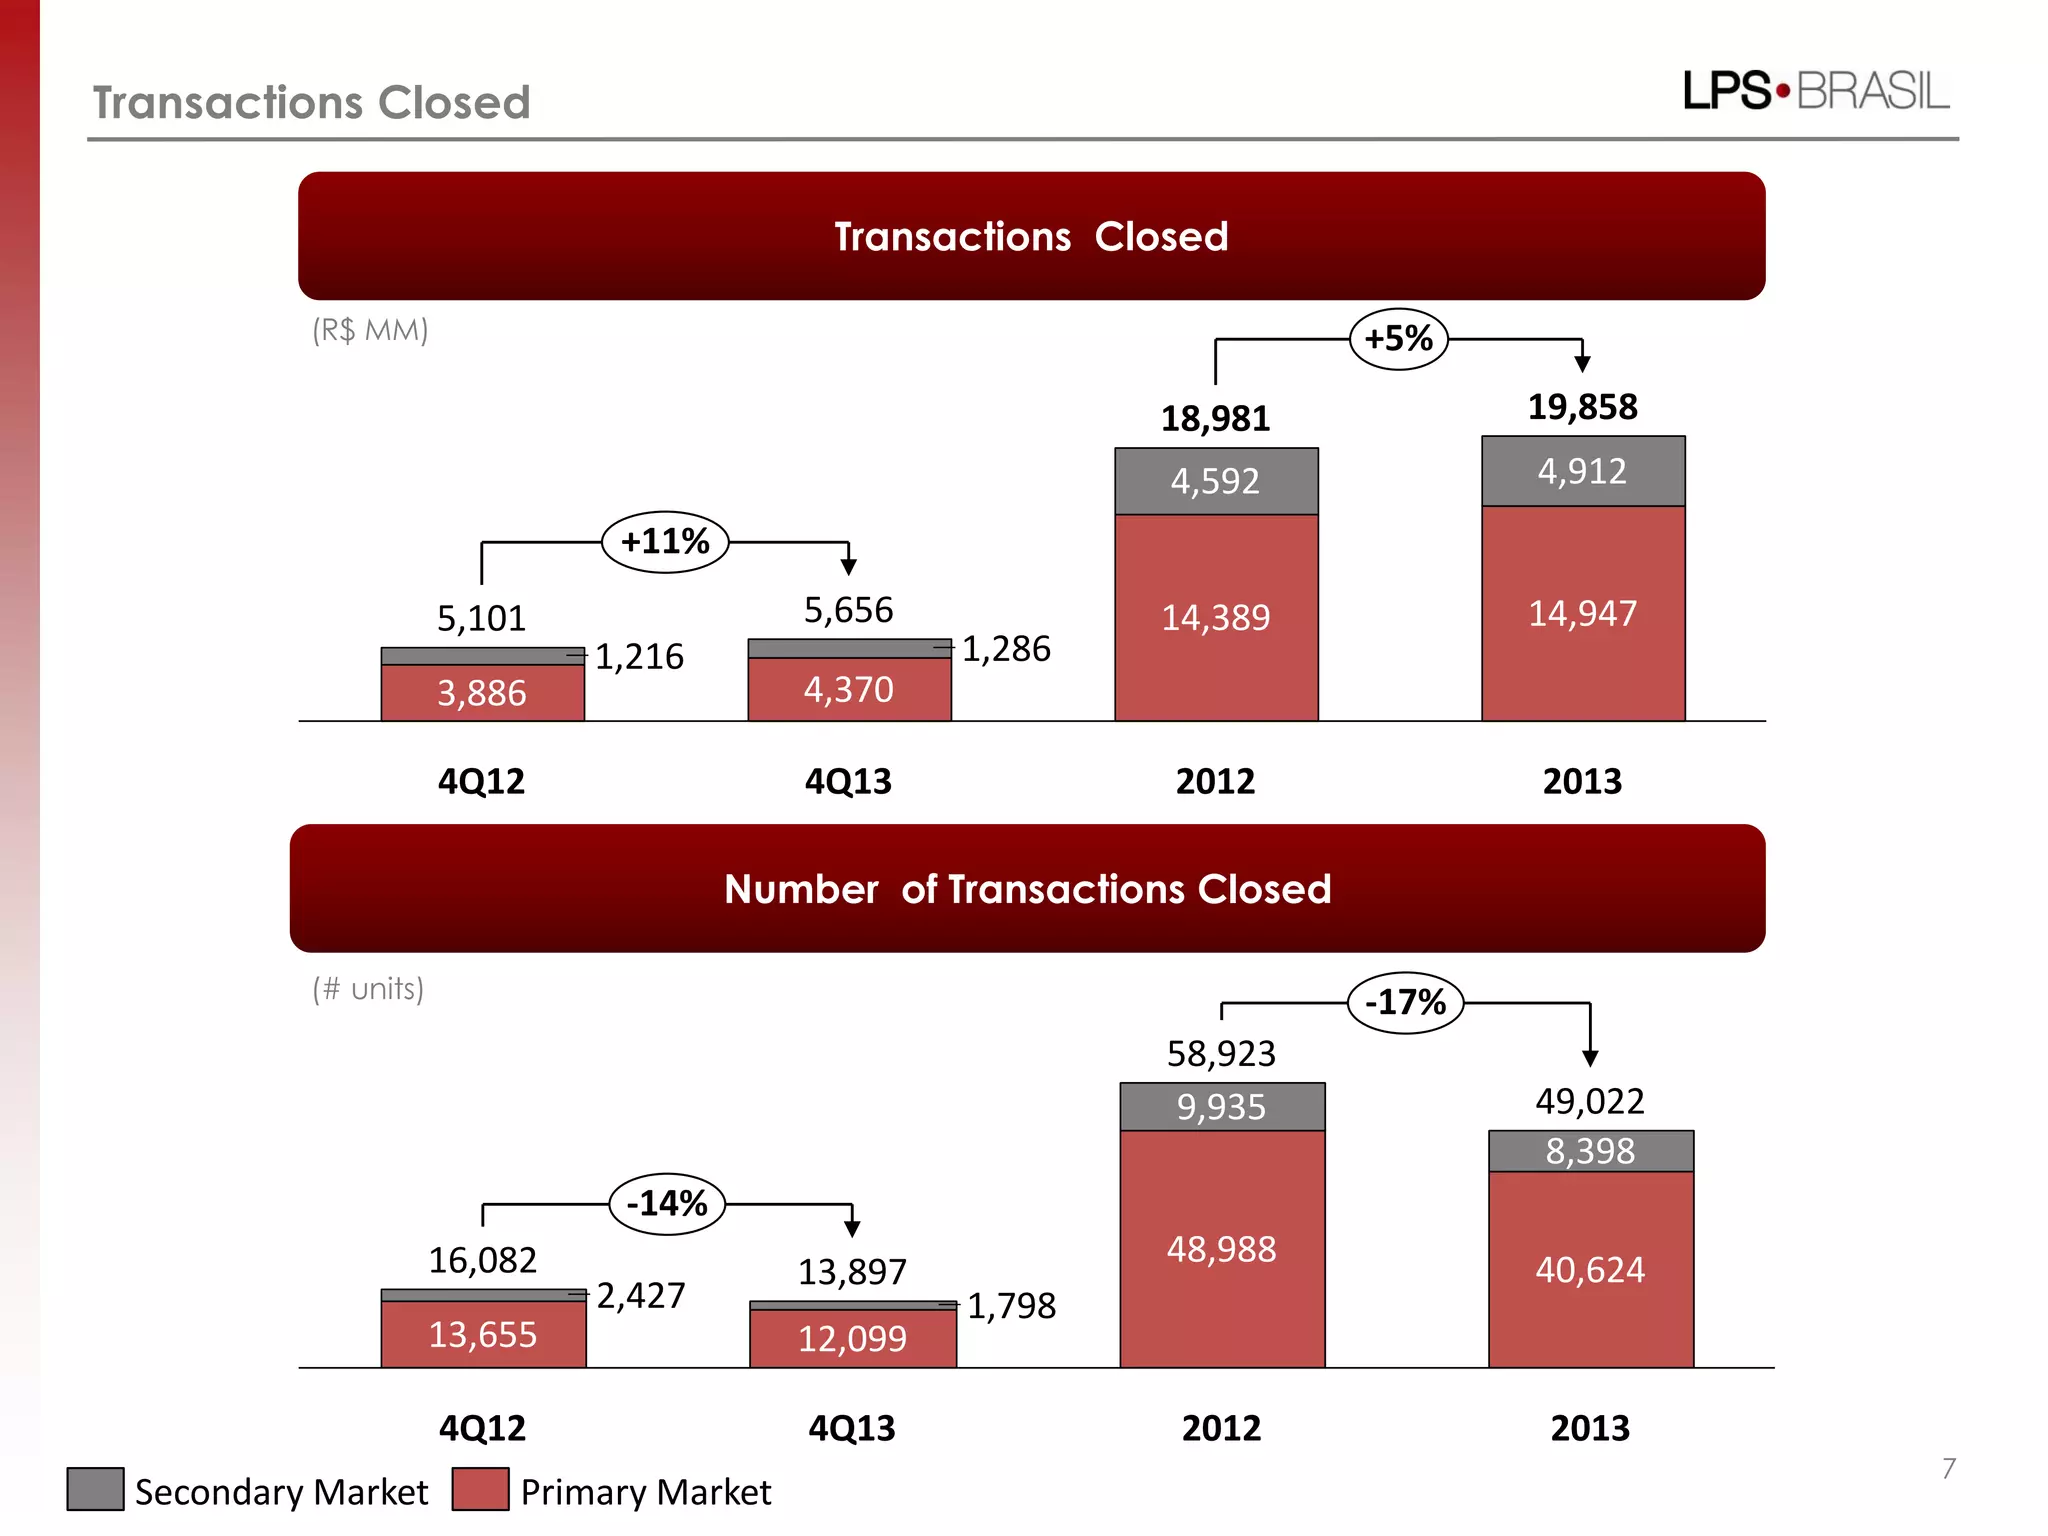

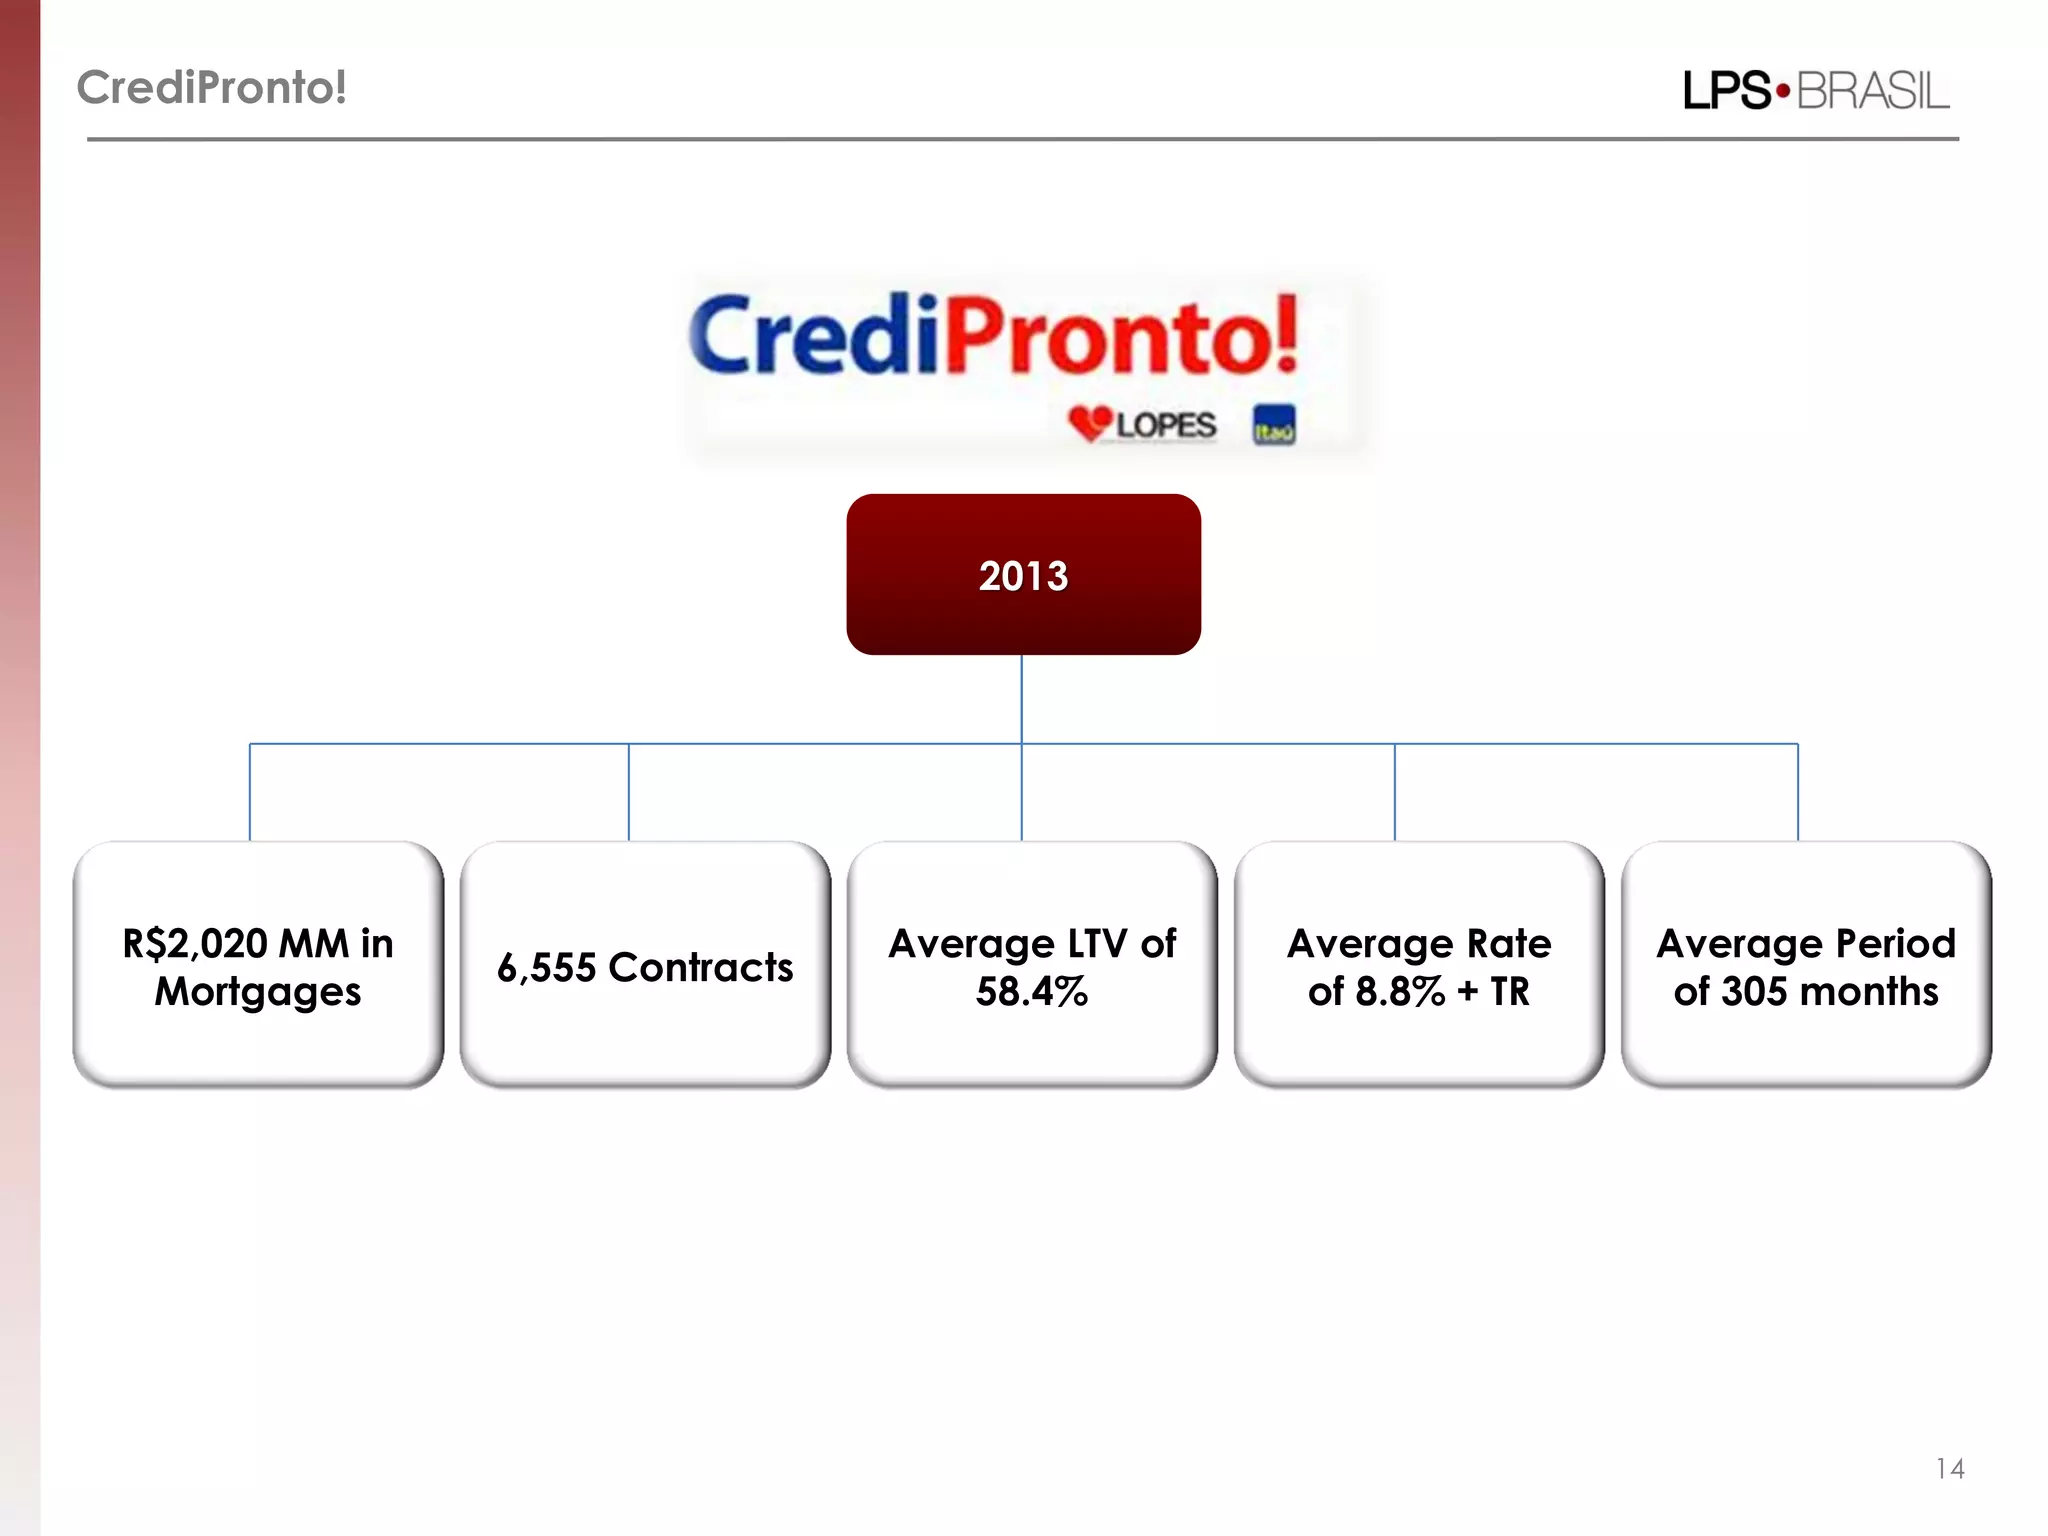
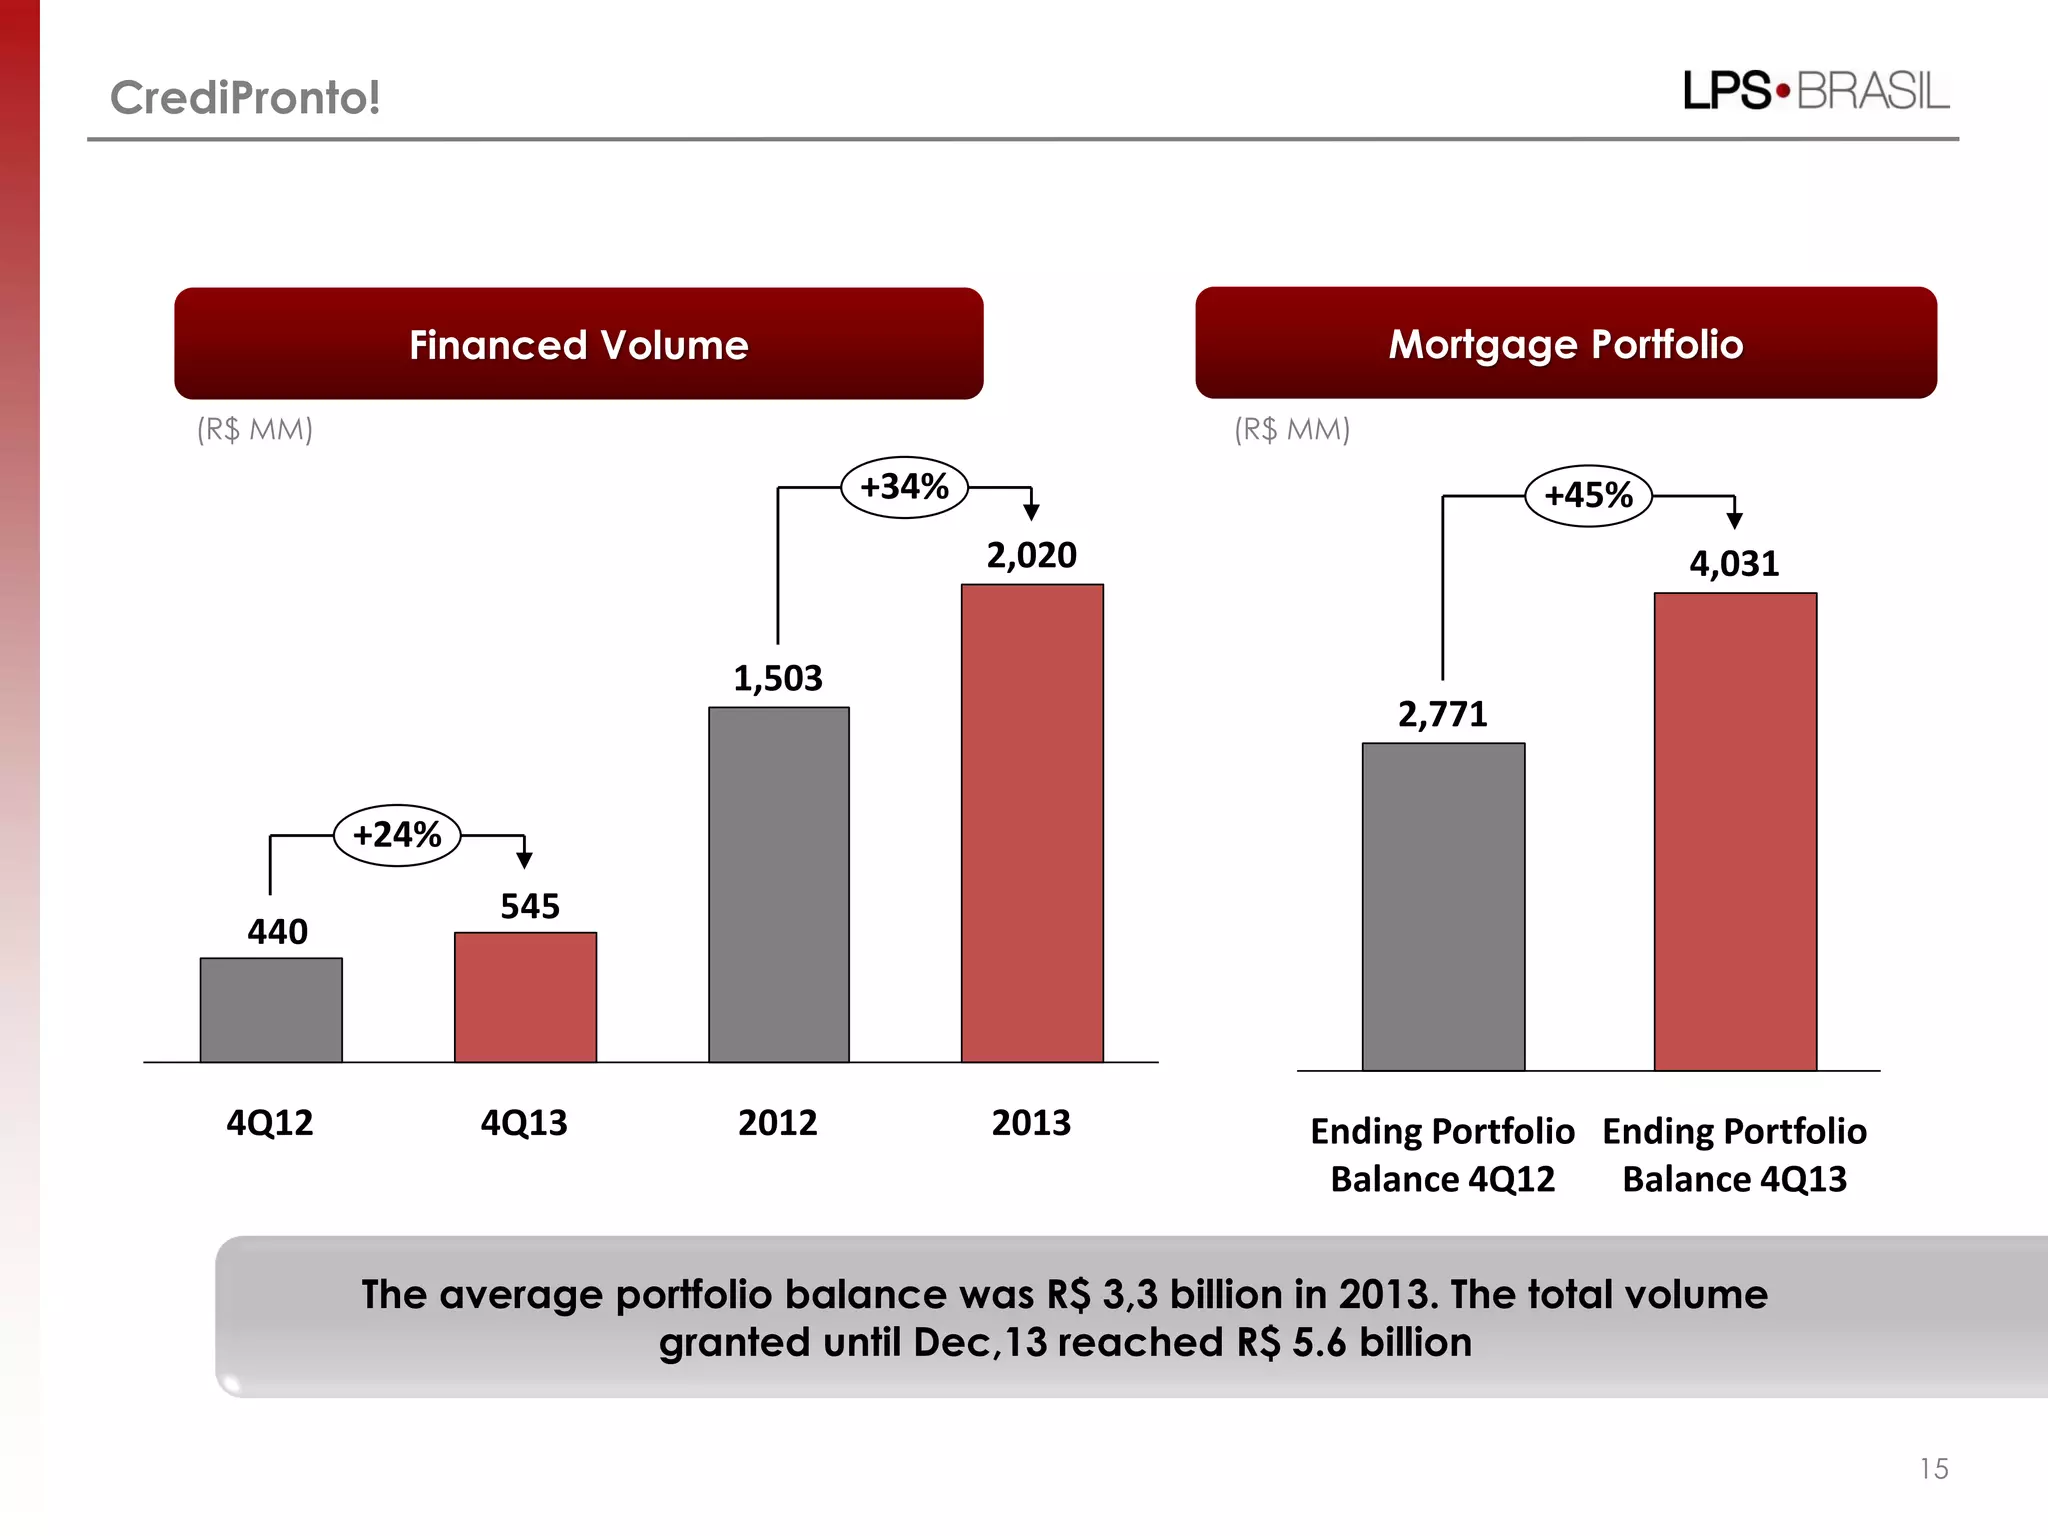
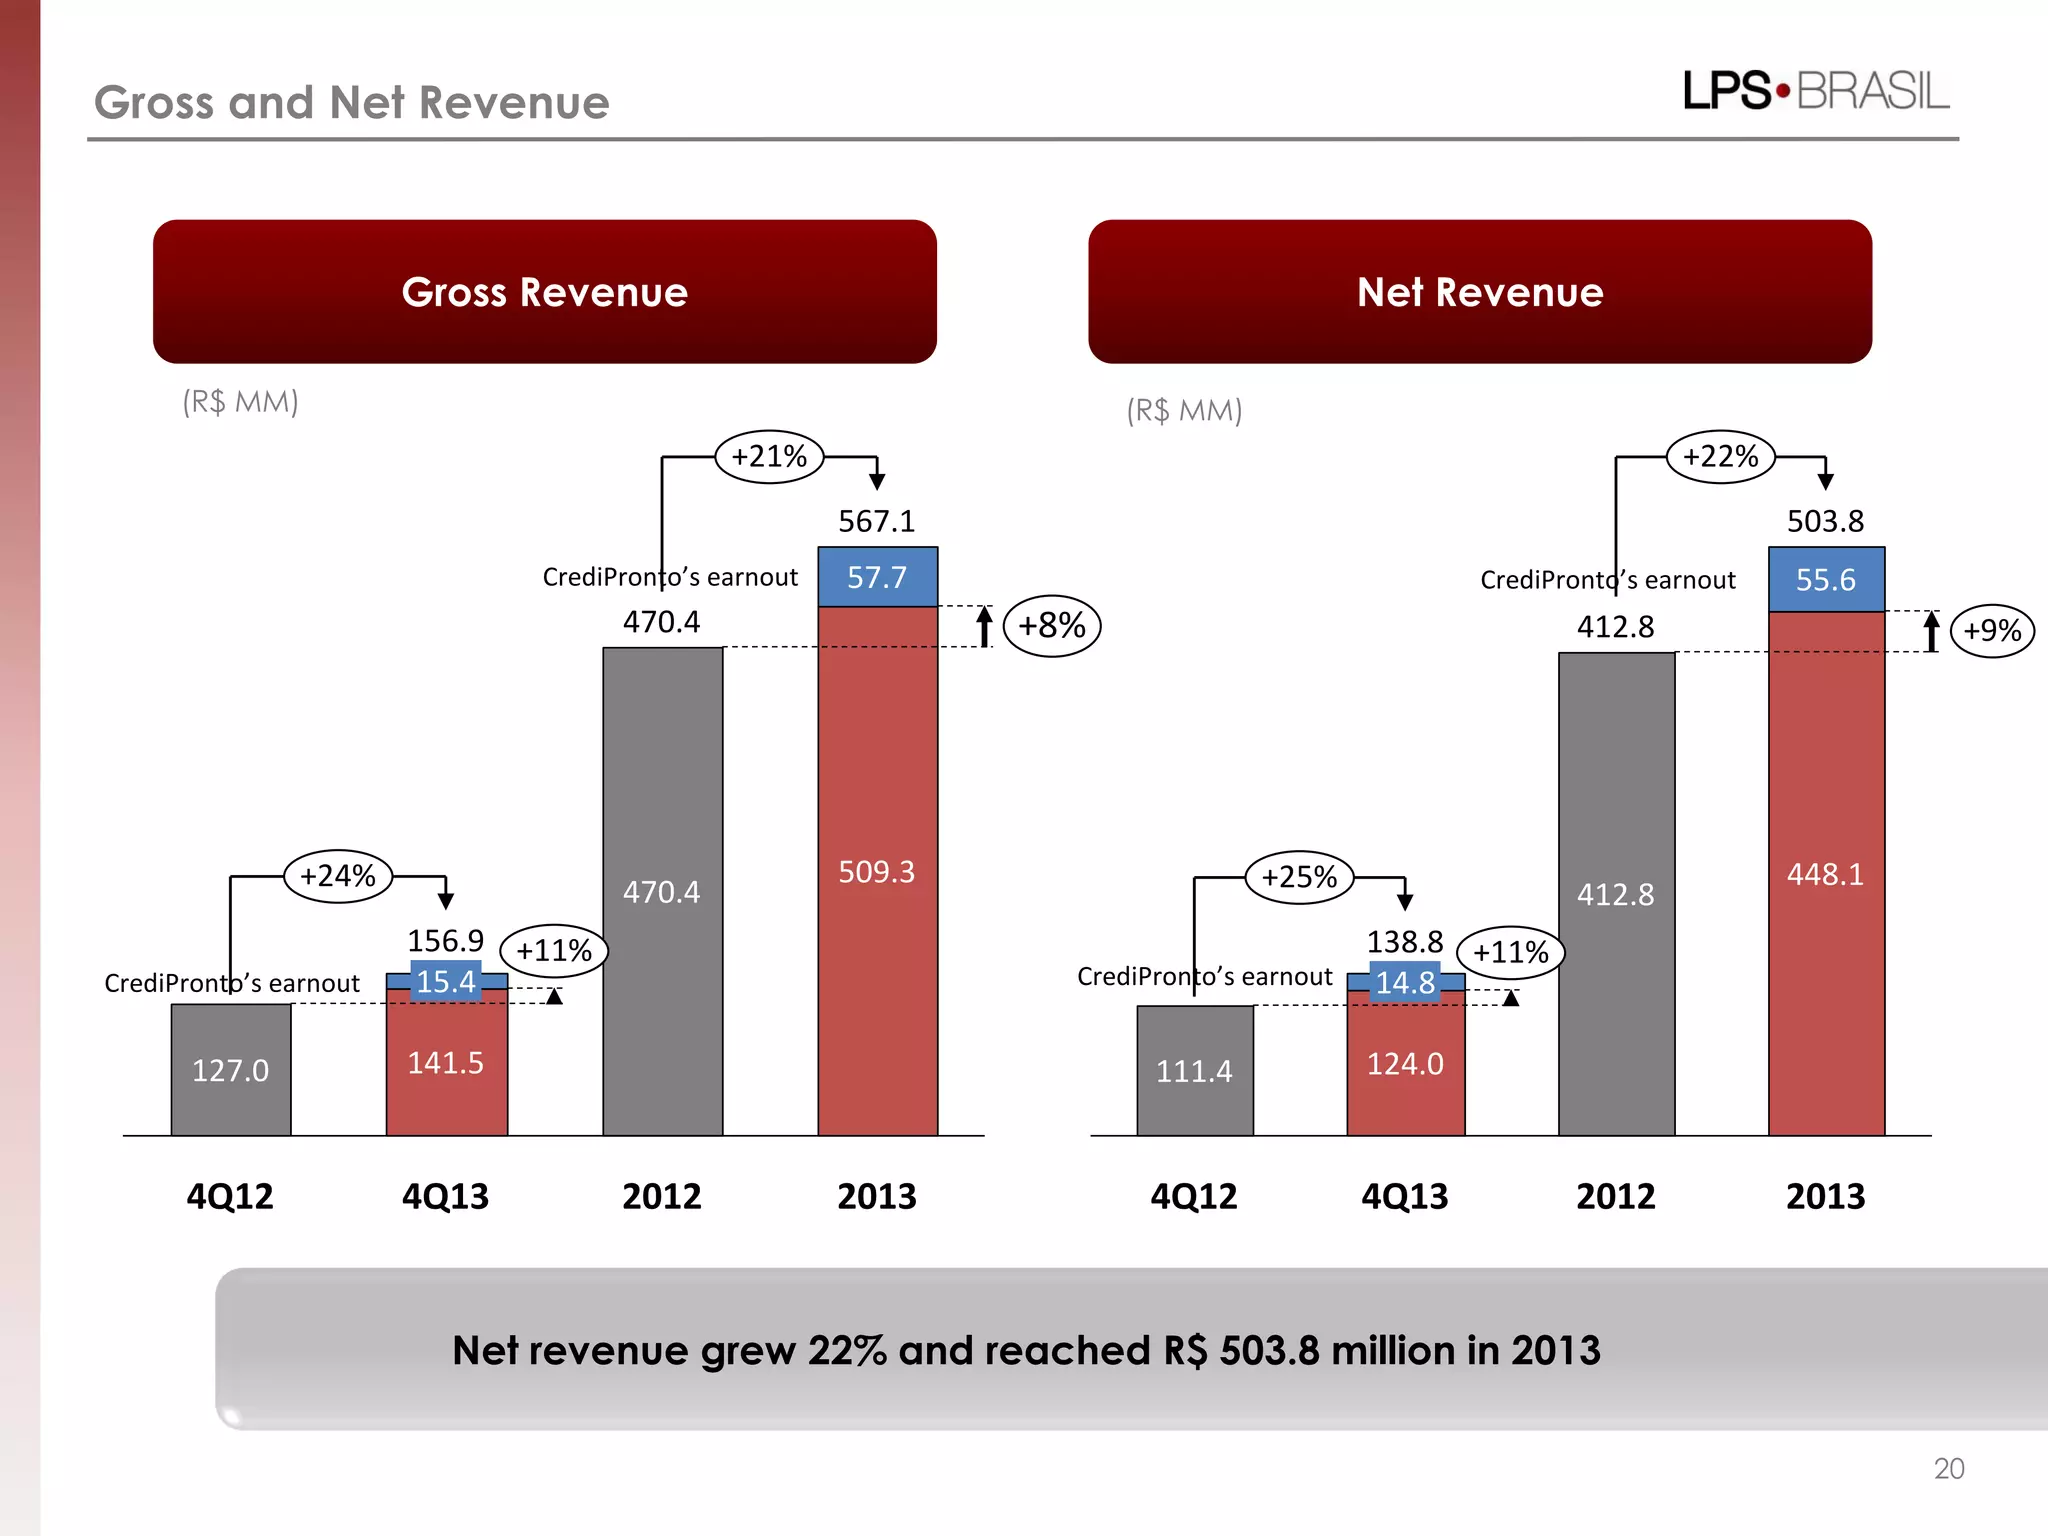
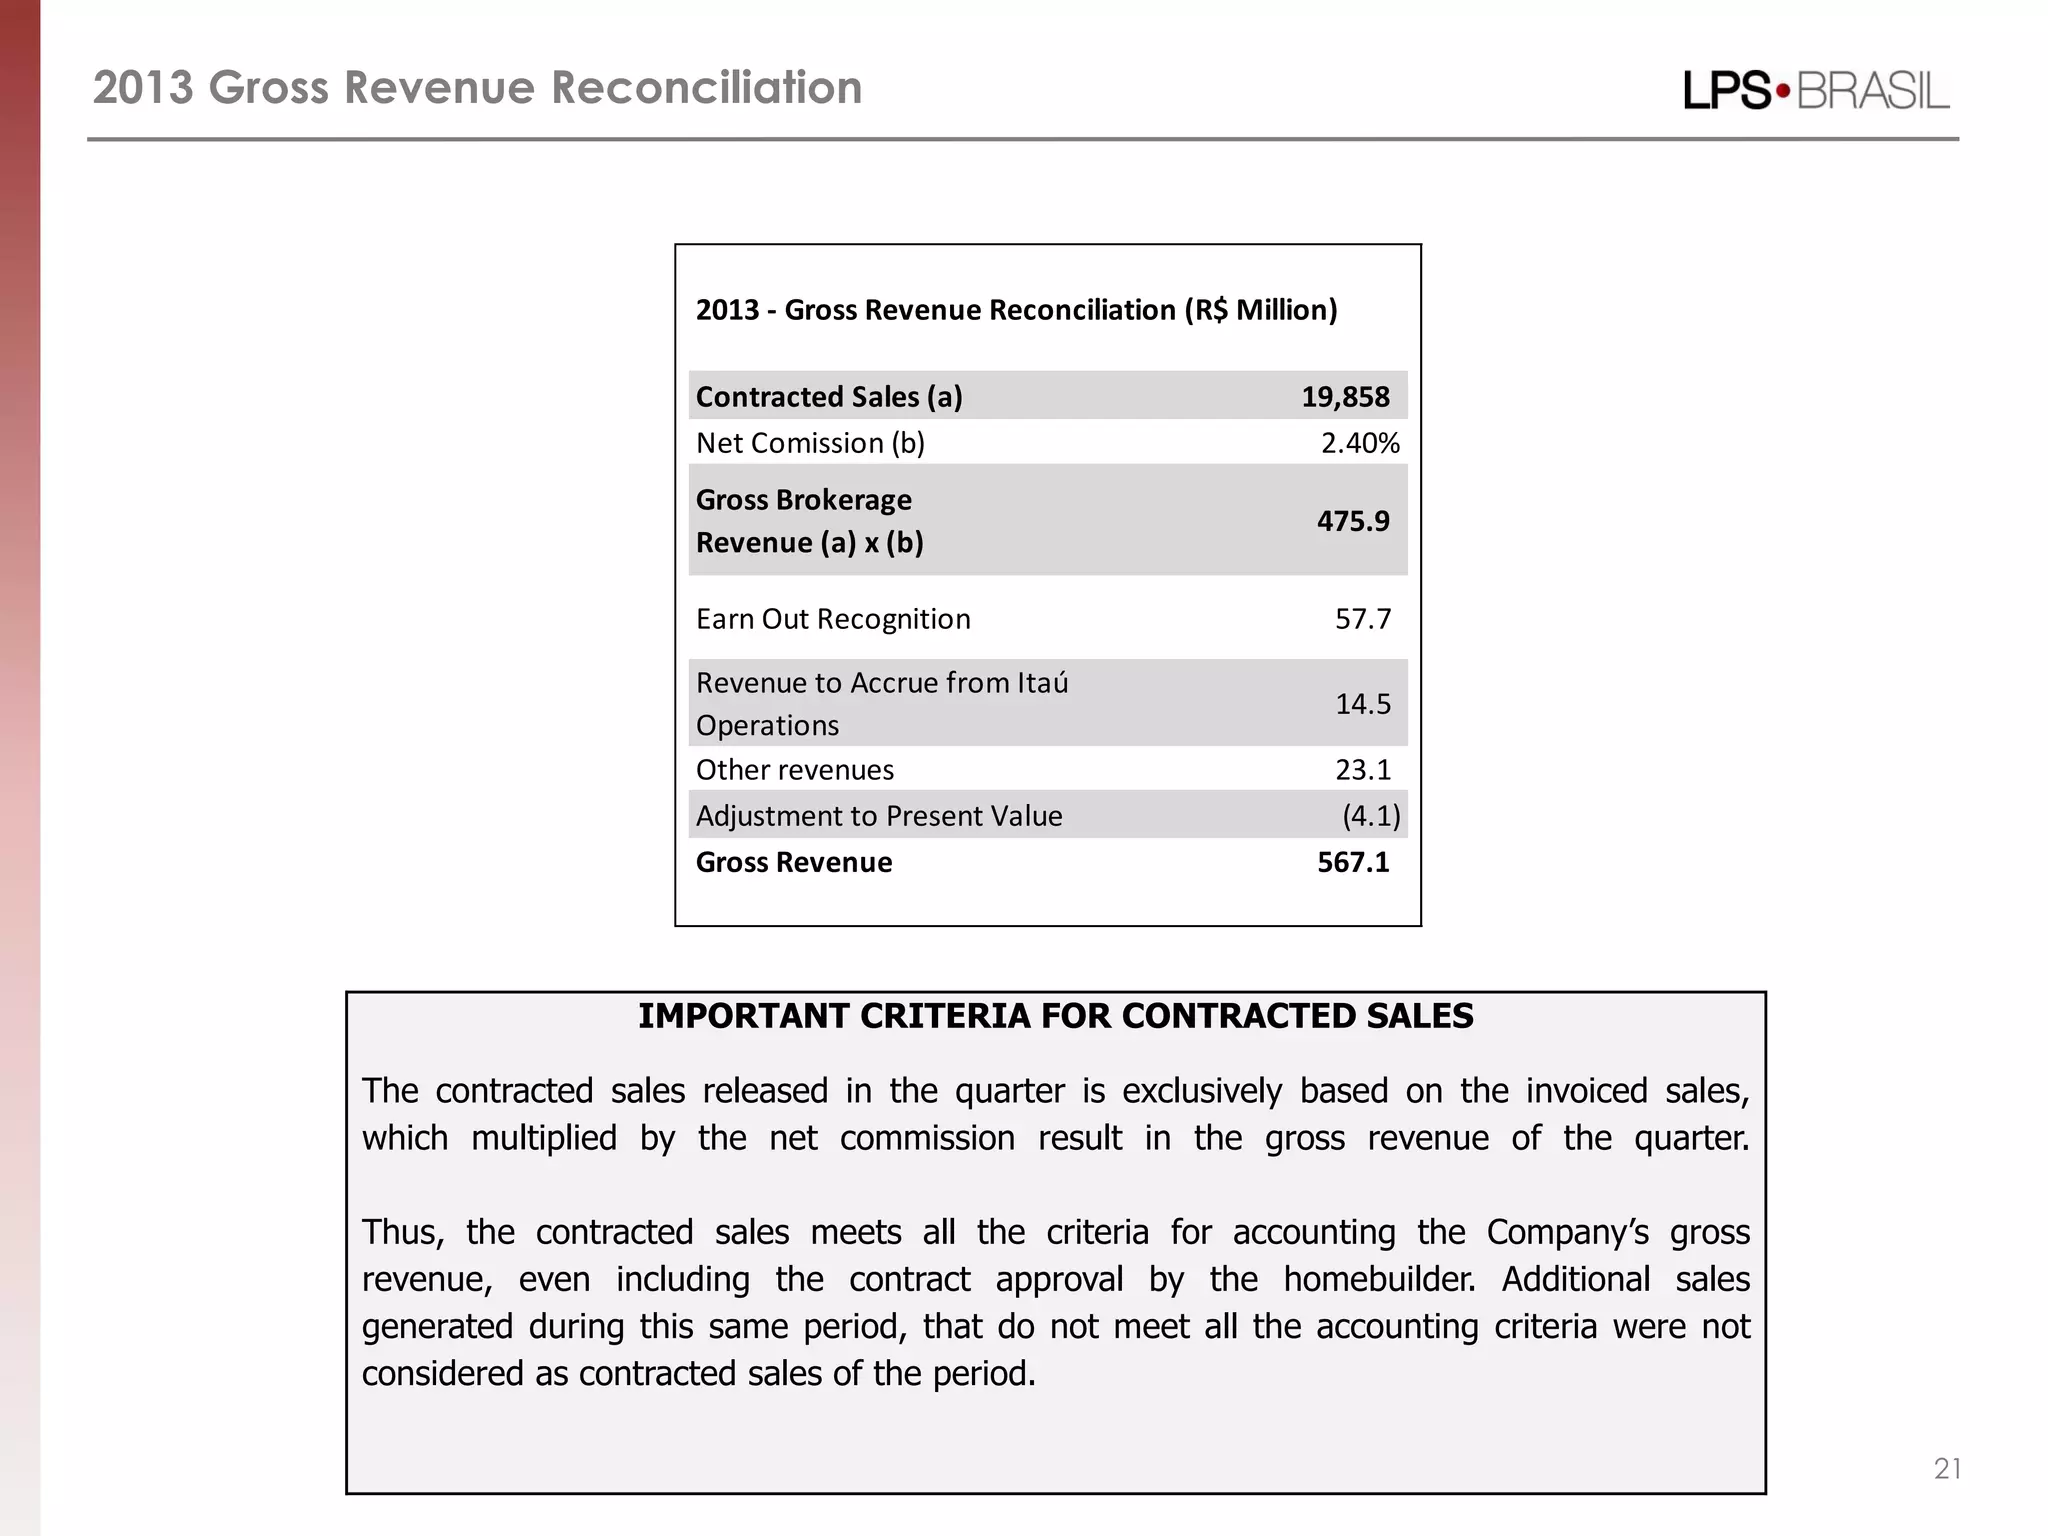
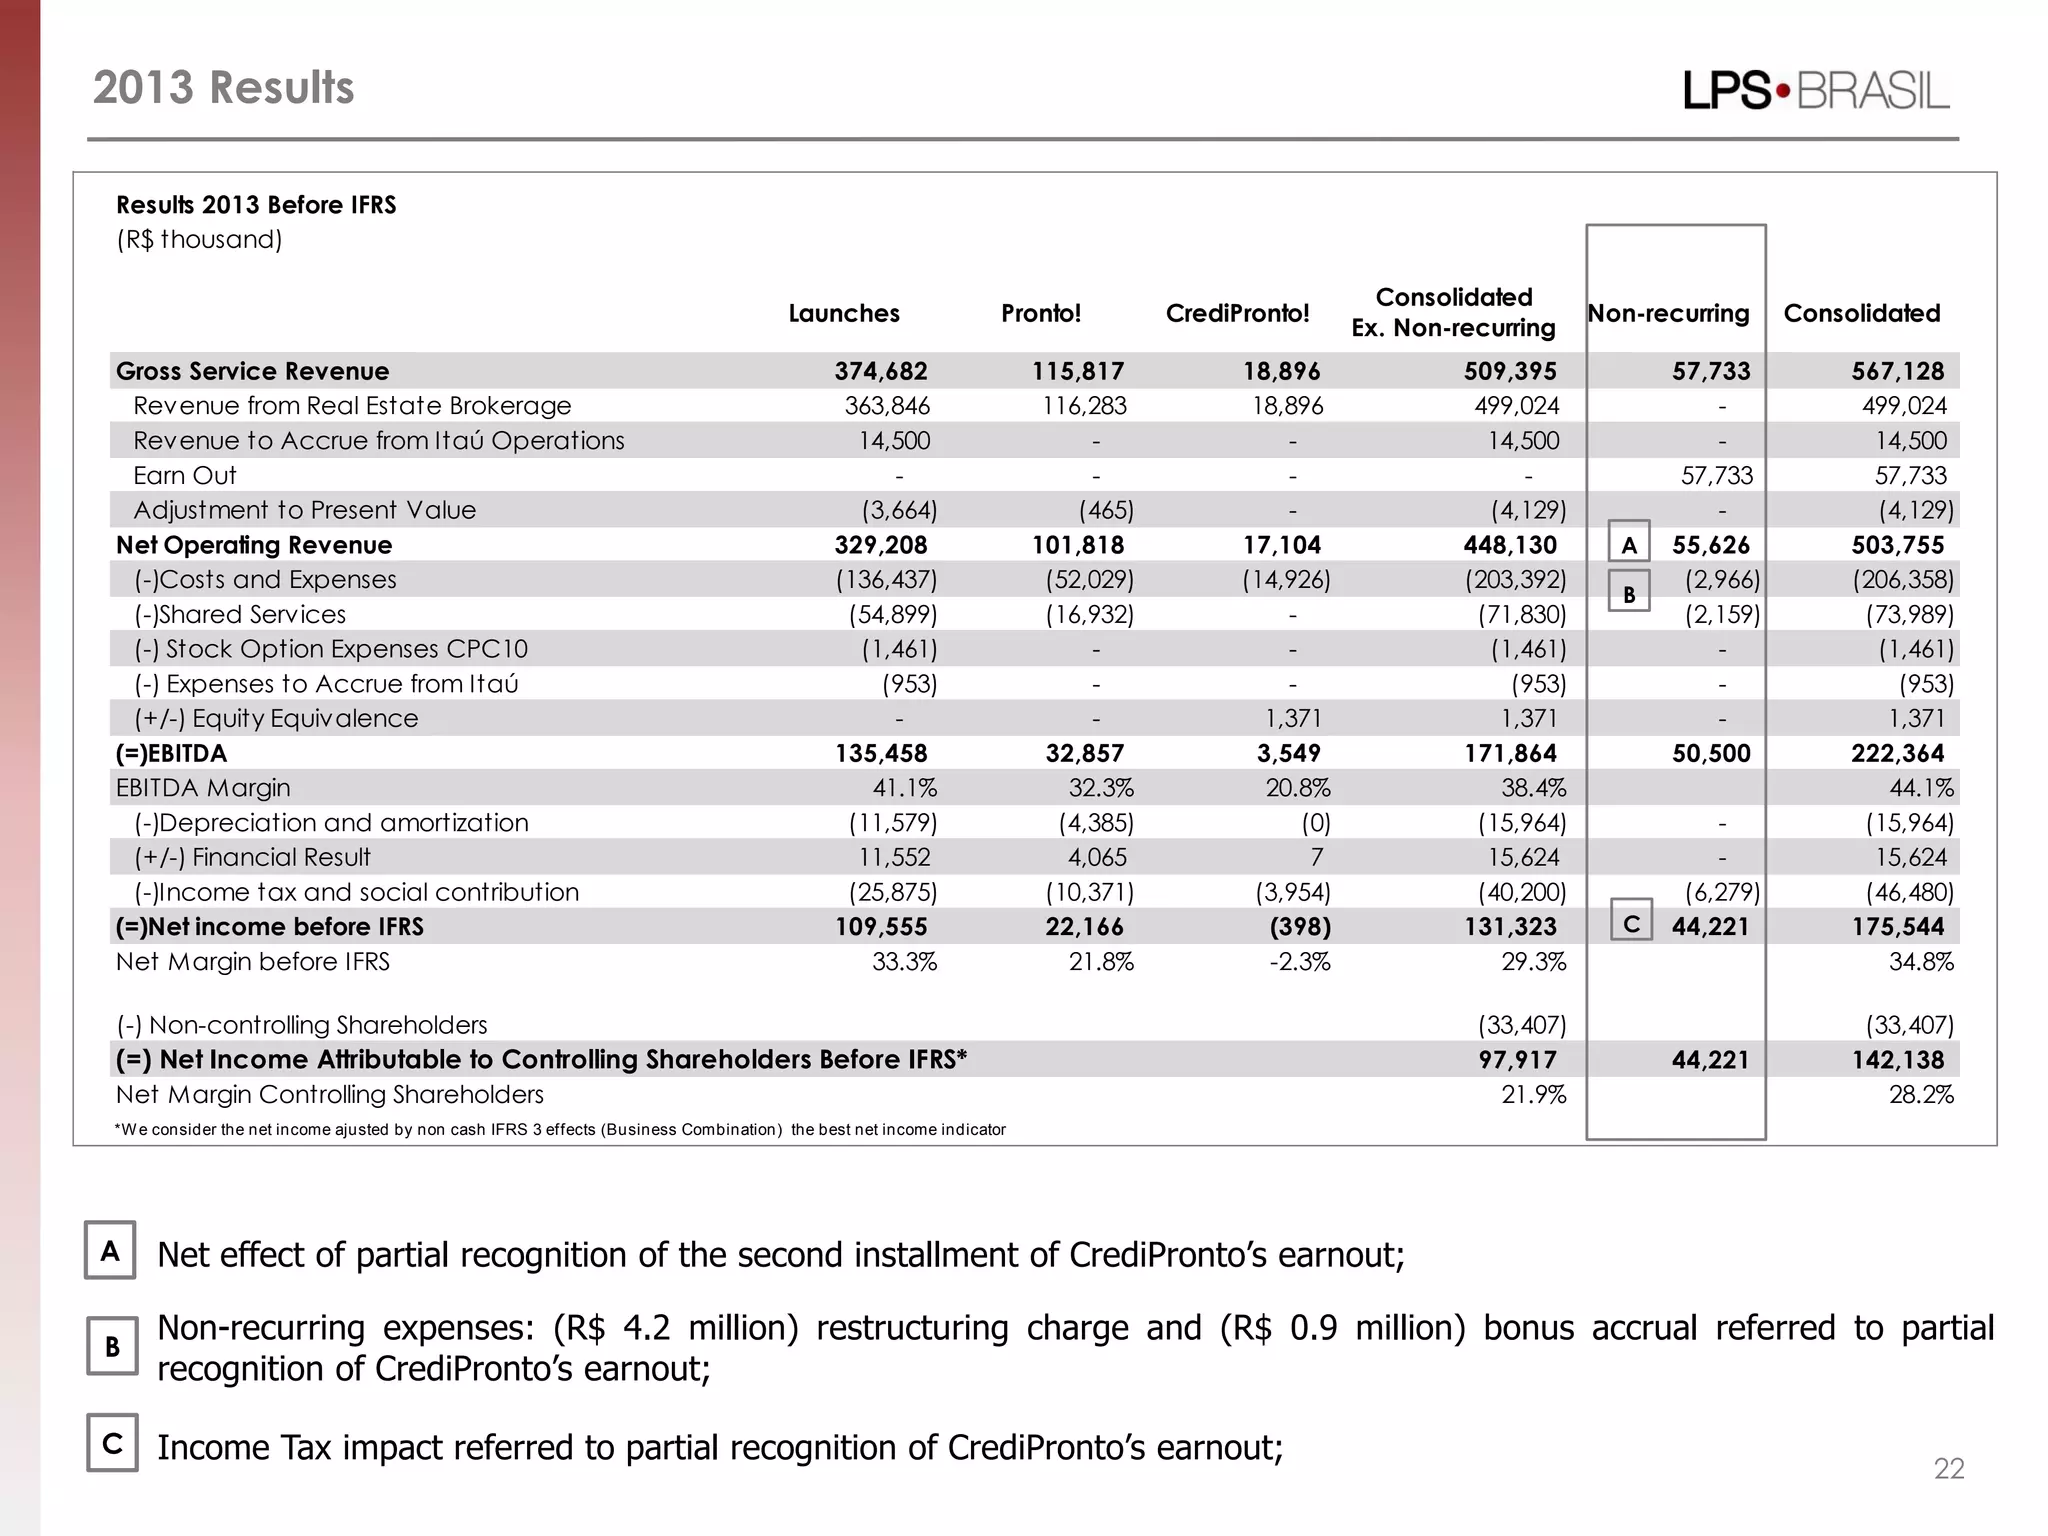

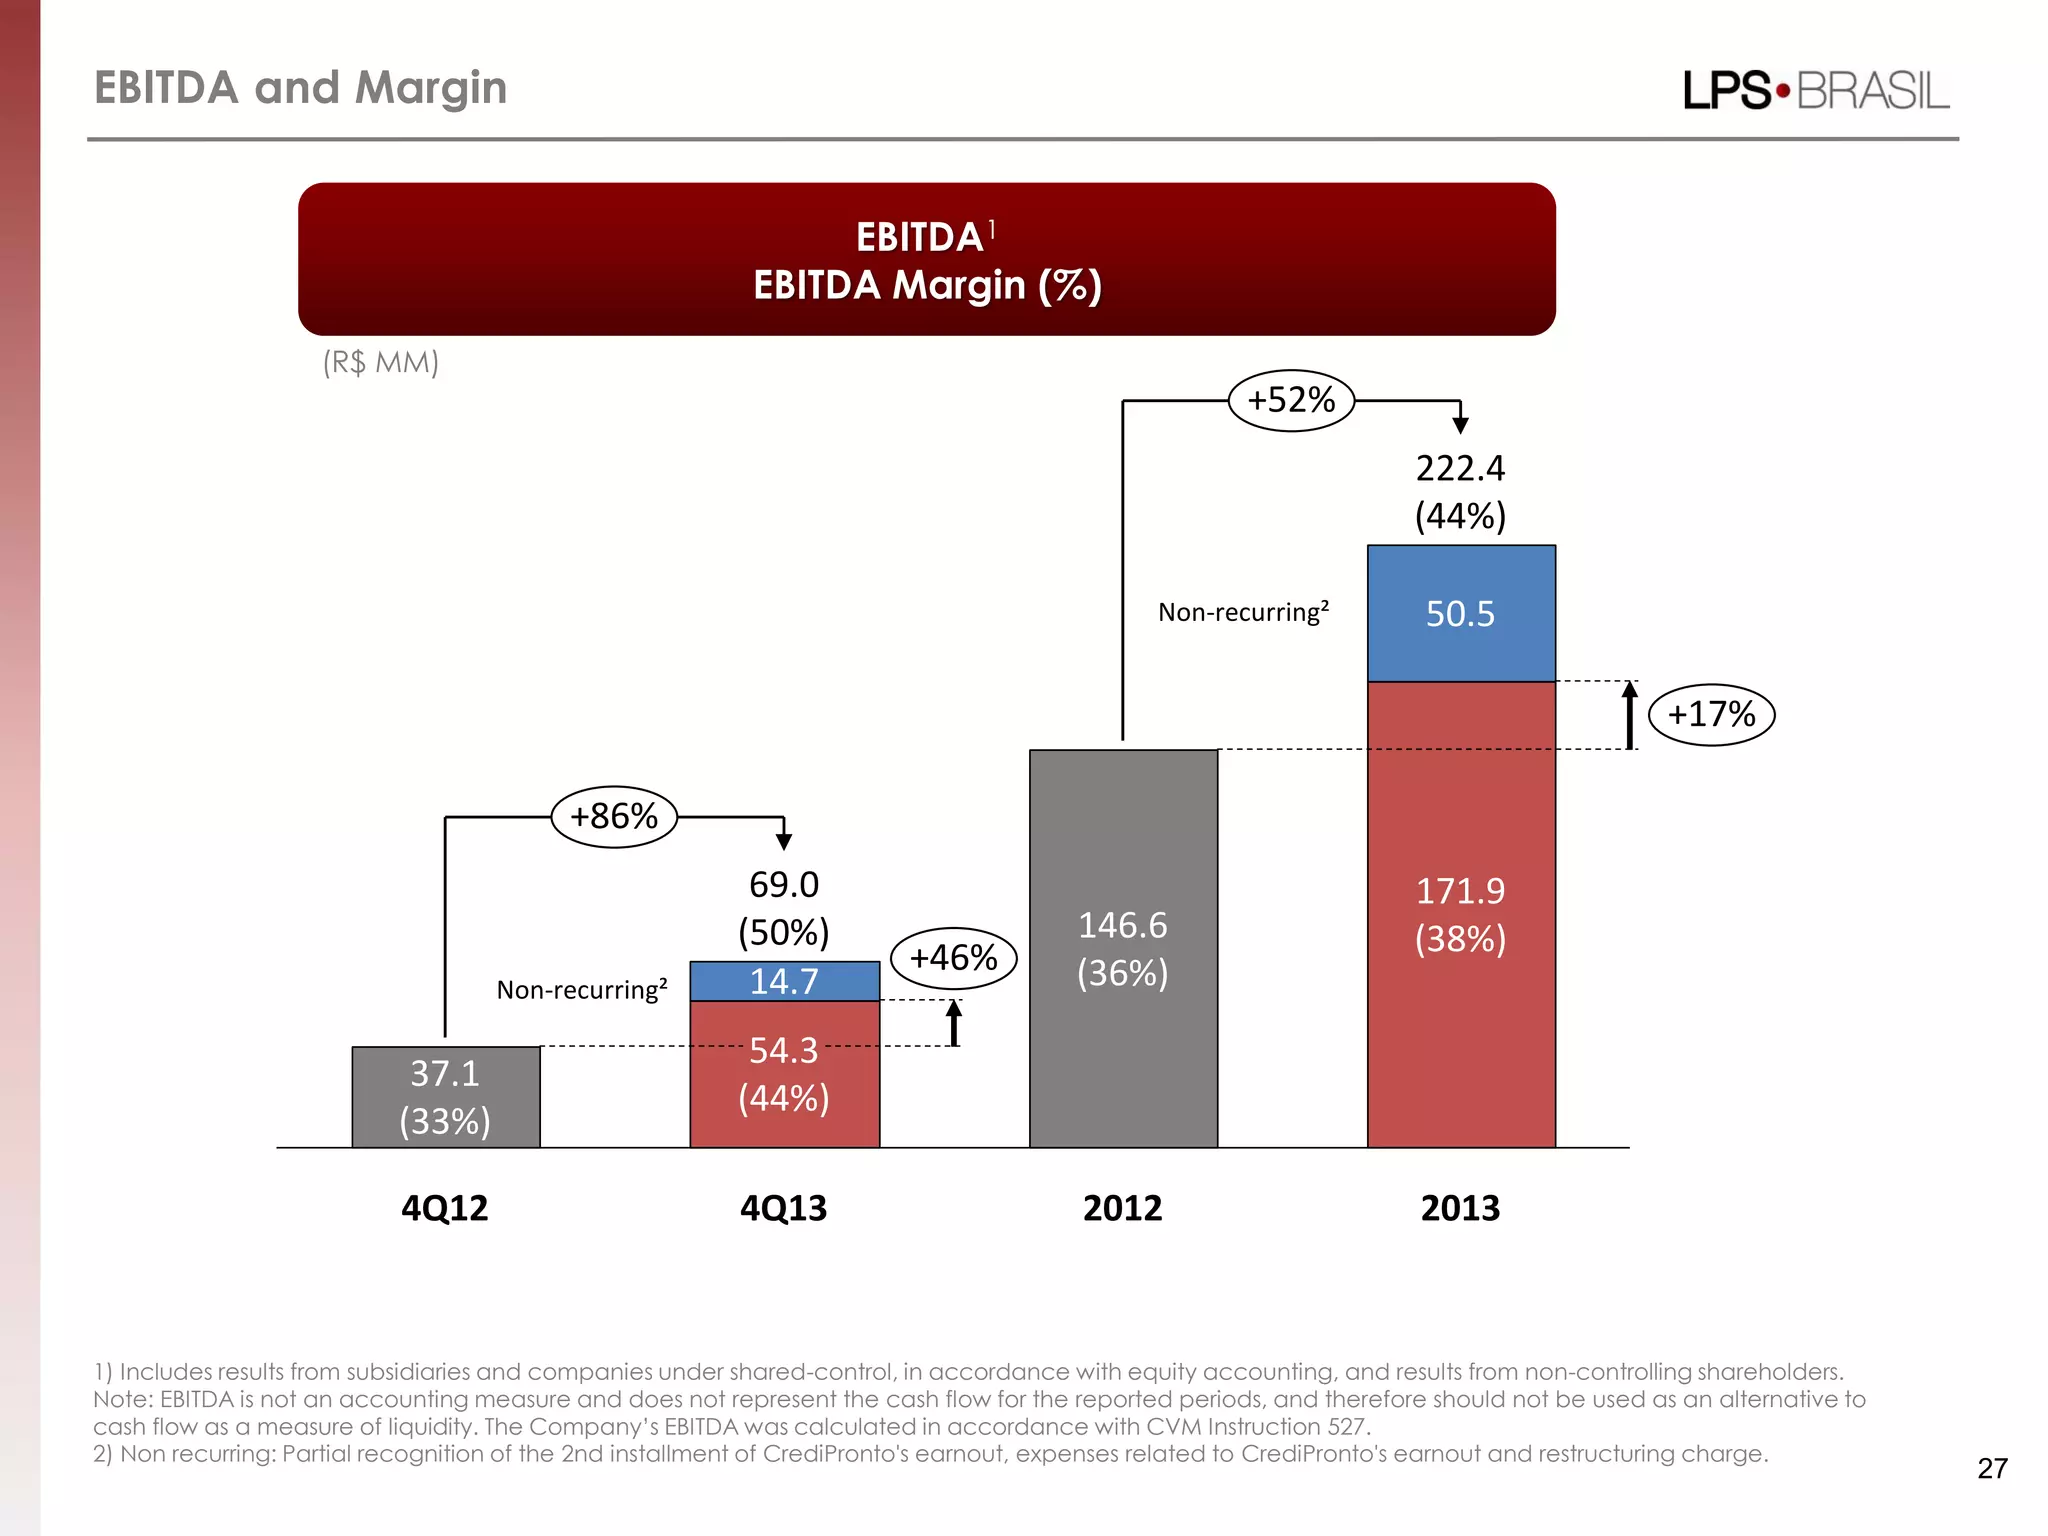
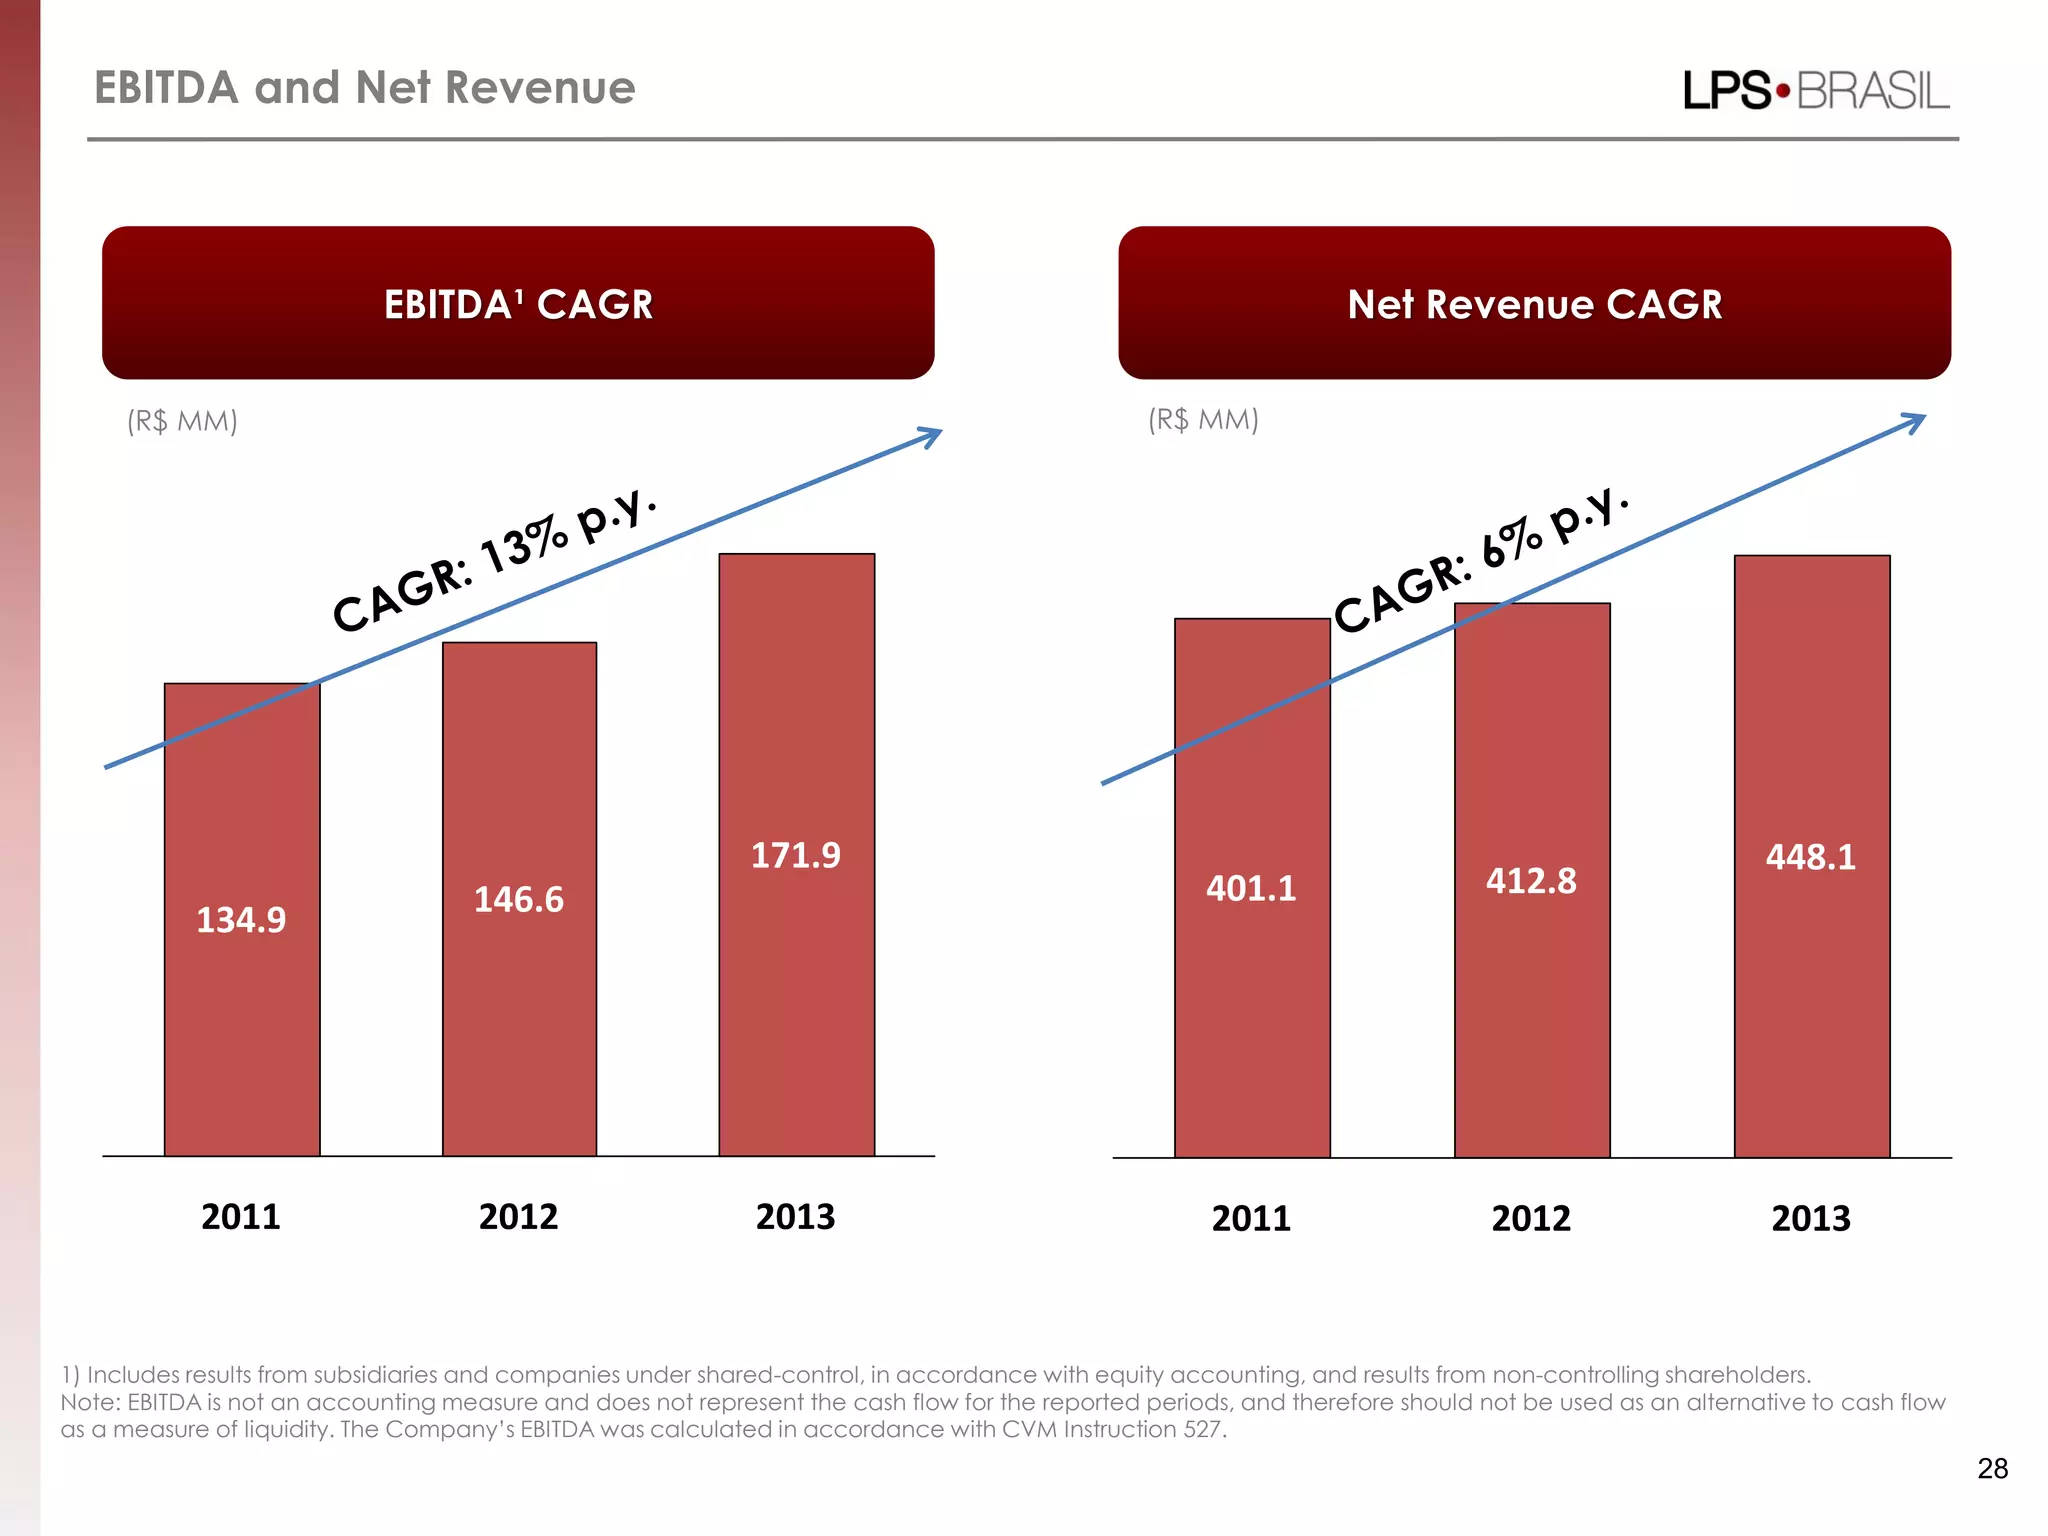
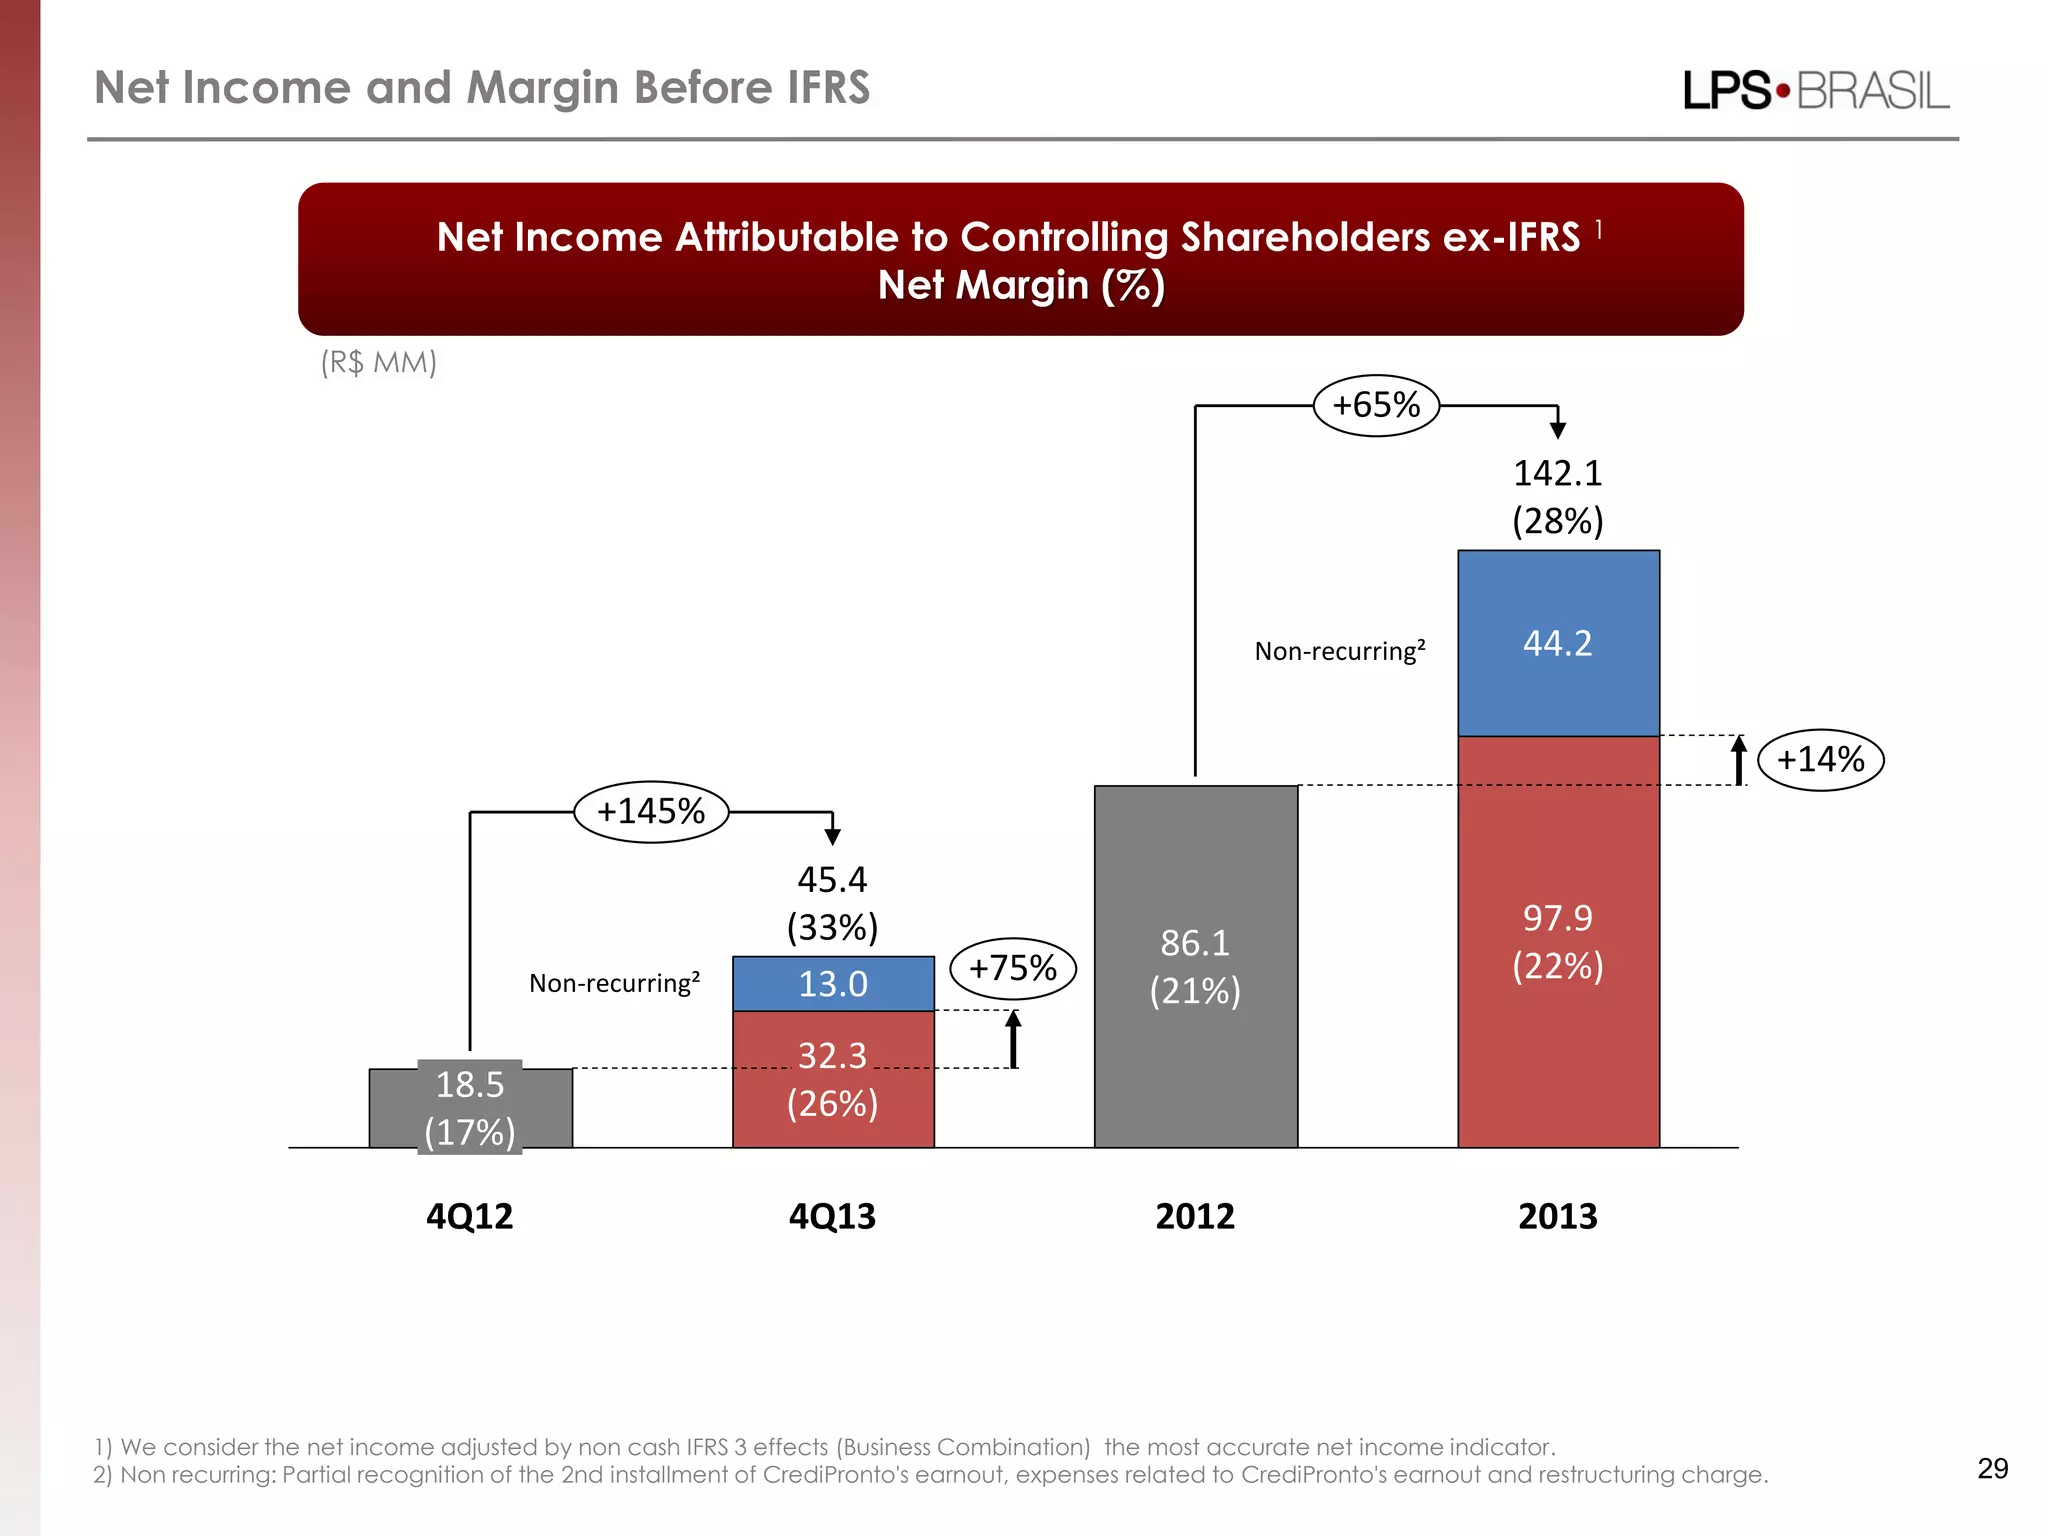

The document provides an overview of LPS Brasil's 2013/4Q13 presentation. It summarizes the following key points: 1) LPS Brasil had its best year ever in 2013 with total transactions closed reaching R$19.9 billion, including a record R$14.9 billion in the primary market. 2) Net revenue was R$503.8 million, up 22% from 2012. EBITDA was R$222.4 million and adjusted EBITDA was R$171.9 million, both record highs for the company. 3) CrediPronto! originated a volume of R$2 billion in mortgages, up 34% from 2012, and


