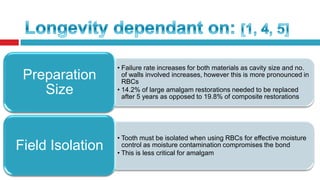
A direct restoration material composed of an alloy
consisting of mercury, silver, copper or tin.

Kolker et al estimated the average survival of
amalgam restorations is 22.5 years

Survival rate of 78% over a 5 year period
Advantages

Disadvantages

• Low technique sensitivity

• Lack of aesthetics

• High longevity & radiopacity

• Increased tooth removal
during tooth preparation

• High compressive strength
• Excellent wear resistance

• Ability to seal marginal spaces
over time

• Survival rates of between 5595% over a 5 year period
Technical work
of dentist

Marginal
ditching

Patient
behaviour

Cervical
overhangs

Secondary
caries

Tooth fracture

Not so much
the material

Main reasons
for failure of
AMALGAM
Figure 1
Figure 1: Demonstrates Corrosion of the Amalgam Restoration [2]
A direct restoration material composed of a monomer and polymer mix of
light curable resins.

Main reasons for failure were secondary caries and fracture of
restoration

Bernardo et al concluded the overall risk of failure due to secondary
caries was 3.5 times higher in composite than amalgam restorations

Survival rates of between 55-95% over a 5 year period
Advantages

Disadvantages

• Good aesthetics

• More technique sensitive
than amalgam

• Preservation of tooth
tissue during prep

• Low durability in posterior
teeth

• Low thermal
conductivity
Figure 2:
Figure 2: Large posterior composite demonstrates marginal discolouration
and wear [3].
Oral Hygiene

• Plaque adheres better to resin-based composites than
amalgam

Occlusal
Factors

• High occlusal function is associated with reduced longevity
• Amalgam has greater wear resistance than composites (useful
in heavy occlusion or para-function)
• However in normal occlusal function composites perform well

Preparation
Type

• Class I and II amalgam restorations have survival time between
25-70 years; not representative of the population, as it was on
highly motivated patients (dental students and staff)
Preparation
Size

• Failure rate increases for both materials as cavity size and
no. of walls involved increases, however this is more
pronounced in RBCs
• 14.2% of large amalgam restorations needed to be
replaced after 5 years as opposed to 19.8% of composite
restorations

Field Isolation

• Tooth must be isolated when using RBCs for effective
moisture control as moisture contamination compromises
the bond
• This is less critical for amalgam
ToothRestoration
Interface
PatientRelated
Factors

• Amalgam corrosion products fill the space between the
tooth and restoration … marginal seal improves with time
• Composite polymerisation shrinkage - compromises the
marginal seal and increases the risk of secondary caries

• Age, gender, reason for restoration
• Oral hygiene, caries risk, parafunctional habits
• Levels of cooperation and compliance
explain the failure of amalgam and
composite fillings
Norway Study [4]
Followed 27 dentists in Norway – looking at all of their class
II restorations (4030 in total), for over 4 years. Focus was on
adolescents
13 amalgams failed = 7.1% of the amalgams placed (lower
than composite failure rate)

407 RBCs (a larger number were placed) = 12.4%

Mean annual fail rate for:
Amalgam (1.6%) & resin composite (2.9%)
Norway Study [4]
For BOTH amalgam and
composite, the top reasons for
failure were:

Other failure reasons:

• 1. Secondary caries.
Composites were much more
susceptible: causing 73.9% of
the failures. Results may
have been affected by the
adolescent focused study –
their lifestyle increasing
secondary caries risk
• 2. Loss of the restoration

• Amalgams: due to tooth
fracture. Unlike amalgam composites crack before the
tooth
• Composites: due to marginal
defects and poor approximal
contact. Short term reasons:
un-contoured restorations and
porosities
Public Dental Health Service Study [5]

Observed the longevity of
resin composite ONLY

Included 2881 patients
with a mean age of 13.7
& 4355 restorations were
included by 115 dentists

Results showed:
84% survival rate at 8
years
Annual failure rate of 2%

Cavities were either class
I or II

We can compare this with
earlier reported annual
failure rates in
randomised long-term
longitudinal evaluations
between 0.5% and 3%
Restorations by dental students study
[6]




Measured longevity of 4009 restorations placed by dental
students
Summary:





Composite really is technique sensitive
In the short term, Class II resin composites are failing at a rate 10
times higher than with dental amalgam

Results:





6 amalgams (0.35% of amalgams) were replaced during 1 year
84 class II composites (3.6% of composites) were replaced during 1
year
21 composites of which were replaced in less than a month of
Restorations by dental students study
[6]
Reasons for
Restoration
Being
Placed by
Type of
Restoration

Reason for
Failure

Composite

Amalgam

Fracture

24

2

Missing

15

1

Void

15

1

Loose

7

Open Contact

7

Residual Caries

5

Failed/Defective

5

Sensitive/Painful

4

Open Margin

2

Total

84

2

6
Elliot, A. 2008 [7]
472 Portuguese
children, aged 8-12
years, with dental
caries in one or more
posterior teeth

Randomised to receive
either an:
- Amalgam or
- Composite
restoration

If restorations required
replacing = “failure”

Followed annually for
oral examination and
bitewings

Mean annual failure
rate
• 0.82% for amalgam
• 2.21% for composites
Comparing Long Term Survival
of Amalgam & Composite Restorations [2]
Bernado
et al.
Survival
Rates

- Secondary
caries
Risk was 3.5
times higher
in composites
vs. amalgam

Restorative
Material

Main reason
for failure for
both types:

Composite resin

85.5

Amalgam

94.4

0

20

40

60

80

100

Survival rate (%) over 7 years
Opdam et al.
Survival Rate
Findings: The
number of
surfaces restored
affects the
longevity
Summary of
Bernado &
Opdam studies:
After 7
years, both
materials have a
high longevity.

Years Post
Placement

Comparing Long Term Survival
of Amalgam & Composite Restorations [2]

82.2
79.2

10 yrs

91.7
89.6

5 yrs

0

20

40

60

Survival rate (%)
Composite

Amalgam

80

100
Patient factors influence on restoration failure [7]
32 GDPs were asked to record the reason for placement / replacement of 3196
restorations from a list of potential reasons

The restoration age, material & class were also recorded

Restorations placed:
54% amalgam, 32% composite, 8% compomer, 7% glass ionomer
Reasons for placement / replacement: 29% secondary caries, 28% primary
caries, 10% margin fracture, 7% tooth fracture, 6% non-carious defects

Mean age of restorations at failure = 7.1 years
How long do direct restorations last? [8]
Burke, F. and
Lucarotti, P.
(2008)

Data from 503,965
restoration
placements were
obtained from
80,000 adult
patients (46%
male, 54% female)
Summary: Single
surface
amalgams have
better survival
rates than class II
restorations

10 Year Survival of Amalgam Restorations
How long do direct restorations last? [8]
Burke, F.
and
Lucarotti, P.
(2008)
Summary:
Older patients
have
restorations
with a shorter
interval to reintervention

10 Year Survival of Restorations by Patient Age
Reasons for
resin
composite
replacement:

Percentage

Burke et al. 2001 [9]
100
90
80
70
60
50
40
30
20
10
0

Secondary Caries
Fractured
Restoration
Lost Restoration
Wear

Sensitivity
Resin
Composite

Amalgam

Pulpal Pain
Selection of dental materials &
longevity of replaced restorations in Sweden [10]
High caries risk patients  shorter longevity for resin based
composites vs. low / moderate risk patients due to recurrent
caries
Larger restorations  show greater failure rates
(class II = the most frequently replaced cavity)
Restorations replaced by more experienced dentists are shown
to have significantly longer longevity
Longevity of restorations depends on:
- Operator experience, patient caries risk, material
characteristics
Research suggests:
Composites longevity is 6 years & amalgams longevity is 16
years
A 24-month Evaluation of Amalgam and
Resin-Based Composite Restorations [11]
226 practitioners; 6,218 direct restorations.
• 386 restorations failed (6.2 %) during the following 23.7 months

Number of tooth surfaces restored helped predict subsequent restoration failure
… restorations with 4 or more restored surfaces were more than 4 times more
likely to fail

Restorative material and tooth type were not associated significantly with
longevity

Older patient age was associated highly with failure (P<0.001). Failure rate for
children was 4 percent, compared with 10 percent for people 65 years or older
Conclusion
Correctly performed
amalgam restorations in
posterior teeth have
higher longevity than
resin composites

These differences are
more pronounced when:
-The cavity is larger &
-There are multiple
surfaces involved [1]

Annual failure rates in
posterior stress-bearing
restorations are:
0% to 7% for amalgam
restorations
0% to 9% for direct
composites [12]
References












1. Soares AC, Cavalheiro A. A review of Amalgam and Composite Longevity of Posterior
Restorations. Rev Port Estomatol Med Dent Cir Maxilofac 2010;51:155-164
2. Is it the end of the road for dental amalgam? A critical review. J Conserv Dent. 2008
Jul-Sep; 11(3): 99–107.
3. Wilson NHF, Burke FJT, Mjo¨r IA. Reasons for placement and replacement of
restorations of direct restorative materials by a selected group of practitioners in the
United Kingdom. Quintessence International 1997;28:245–8.
4. Kopperud SE, Tveit AB, Gaarden T, Sandvik L, Espelid I. Longevity of posterior
dental restorations and reasons for failure. European Journal of Oral Sciences 2012;
120: 539–548.
5. Pallesen U, Van Dijken JWV, Halken J, Hallonsten AL, Ho¨igaard R. Longevity of
posterior resin composite restorations in permanent teeth in Public Dental Health
Service: A prospective 8 years follow up. Journal of dentistry 41 (2013) 297–306
6. Overton JD, Sullivan DJ. Early Failure of Class II Resin Composite Versus Class II
Amalgam Restorations Placed by Dental Students. Journal of Dental Education March
1, 2012 vol. 76 no. 3 338-340.
References












7. Elliot, A. (2008) The Risk of Failure is Higher for Composites than for
Amalgam Restoration. Journal of Evidence Based Dental Practice. Volume
8, Issue 2: Pages 83-84.
8. Burke, F. and Lucarotti, P. (2008) How long do direct restorations placed
within the general dental services in England and Wales survive? British Dental
Journal 206
9. Burke FJT, Wilson NHF, Cheung SW, Mjo¨r IA. Influence of patient factors
on age of restorations at failure and reasons for their placement and
replacement. Journal of Dentistry 2001;29:317–24.
10. Sunnegardh-Gronberg K, Van Dijken J, Funegard U et al. Selection of
dental materials and longevity of replaced restorations in Public Dental Health
clinics in northern Sweden. Journal of dentistry 2009; 37 (9), pp. 673--678.
11. McCracken MS, Gordan VV, Litaker MS et al. A 24-month evaluation of
amalgam and resin-based composite restorations. JADA 2013; 144, 583-593
12. Hickel R, Manhart J. Longevity of restorations in posterior teeth and
reasons for failure. J Adhes Dent 2001;3(1):45–64.

Restoration longevity

  • 2.
    A direct restorationmaterial composed of an alloy consisting of mercury, silver, copper or tin. Kolker et al estimated the average survival of amalgam restorations is 22.5 years Survival rate of 78% over a 5 year period
  • 3.
    Advantages Disadvantages • Low techniquesensitivity • Lack of aesthetics • High longevity & radiopacity • Increased tooth removal during tooth preparation • High compressive strength • Excellent wear resistance • Ability to seal marginal spaces over time • Survival rates of between 5595% over a 5 year period
  • 4.
    Technical work of dentist Marginal ditching Patient behaviour Cervical overhangs Secondary caries Toothfracture Not so much the material Main reasons for failure of AMALGAM
  • 5.
    Figure 1 Figure 1:Demonstrates Corrosion of the Amalgam Restoration [2]
  • 6.
    A direct restorationmaterial composed of a monomer and polymer mix of light curable resins. Main reasons for failure were secondary caries and fracture of restoration Bernardo et al concluded the overall risk of failure due to secondary caries was 3.5 times higher in composite than amalgam restorations Survival rates of between 55-95% over a 5 year period
  • 7.
    Advantages Disadvantages • Good aesthetics •More technique sensitive than amalgam • Preservation of tooth tissue during prep • Low durability in posterior teeth • Low thermal conductivity
  • 8.
    Figure 2: Figure 2:Large posterior composite demonstrates marginal discolouration and wear [3].
  • 9.
    Oral Hygiene • Plaqueadheres better to resin-based composites than amalgam Occlusal Factors • High occlusal function is associated with reduced longevity • Amalgam has greater wear resistance than composites (useful in heavy occlusion or para-function) • However in normal occlusal function composites perform well Preparation Type • Class I and II amalgam restorations have survival time between 25-70 years; not representative of the population, as it was on highly motivated patients (dental students and staff)
  • 10.
    Preparation Size • Failure rateincreases for both materials as cavity size and no. of walls involved increases, however this is more pronounced in RBCs • 14.2% of large amalgam restorations needed to be replaced after 5 years as opposed to 19.8% of composite restorations Field Isolation • Tooth must be isolated when using RBCs for effective moisture control as moisture contamination compromises the bond • This is less critical for amalgam
  • 11.
    ToothRestoration Interface PatientRelated Factors • Amalgam corrosionproducts fill the space between the tooth and restoration … marginal seal improves with time • Composite polymerisation shrinkage - compromises the marginal seal and increases the risk of secondary caries • Age, gender, reason for restoration • Oral hygiene, caries risk, parafunctional habits • Levels of cooperation and compliance
  • 12.
    explain the failureof amalgam and composite fillings
  • 14.
    Norway Study [4] Followed27 dentists in Norway – looking at all of their class II restorations (4030 in total), for over 4 years. Focus was on adolescents 13 amalgams failed = 7.1% of the amalgams placed (lower than composite failure rate) 407 RBCs (a larger number were placed) = 12.4% Mean annual fail rate for: Amalgam (1.6%) & resin composite (2.9%)
  • 15.
    Norway Study [4] ForBOTH amalgam and composite, the top reasons for failure were: Other failure reasons: • 1. Secondary caries. Composites were much more susceptible: causing 73.9% of the failures. Results may have been affected by the adolescent focused study – their lifestyle increasing secondary caries risk • 2. Loss of the restoration • Amalgams: due to tooth fracture. Unlike amalgam composites crack before the tooth • Composites: due to marginal defects and poor approximal contact. Short term reasons: un-contoured restorations and porosities
  • 16.
    Public Dental HealthService Study [5] Observed the longevity of resin composite ONLY Included 2881 patients with a mean age of 13.7 & 4355 restorations were included by 115 dentists Results showed: 84% survival rate at 8 years Annual failure rate of 2% Cavities were either class I or II We can compare this with earlier reported annual failure rates in randomised long-term longitudinal evaluations between 0.5% and 3%
  • 17.
    Restorations by dentalstudents study [6]   Measured longevity of 4009 restorations placed by dental students Summary:    Composite really is technique sensitive In the short term, Class II resin composites are failing at a rate 10 times higher than with dental amalgam Results:    6 amalgams (0.35% of amalgams) were replaced during 1 year 84 class II composites (3.6% of composites) were replaced during 1 year 21 composites of which were replaced in less than a month of
  • 18.
    Restorations by dentalstudents study [6] Reasons for Restoration Being Placed by Type of Restoration Reason for Failure Composite Amalgam Fracture 24 2 Missing 15 1 Void 15 1 Loose 7 Open Contact 7 Residual Caries 5 Failed/Defective 5 Sensitive/Painful 4 Open Margin 2 Total 84 2 6
  • 19.
    Elliot, A. 2008[7] 472 Portuguese children, aged 8-12 years, with dental caries in one or more posterior teeth Randomised to receive either an: - Amalgam or - Composite restoration If restorations required replacing = “failure” Followed annually for oral examination and bitewings Mean annual failure rate • 0.82% for amalgam • 2.21% for composites
  • 20.
    Comparing Long TermSurvival of Amalgam & Composite Restorations [2] Bernado et al. Survival Rates - Secondary caries Risk was 3.5 times higher in composites vs. amalgam Restorative Material Main reason for failure for both types: Composite resin 85.5 Amalgam 94.4 0 20 40 60 80 100 Survival rate (%) over 7 years
  • 21.
    Opdam et al. SurvivalRate Findings: The number of surfaces restored affects the longevity Summary of Bernado & Opdam studies: After 7 years, both materials have a high longevity. Years Post Placement Comparing Long Term Survival of Amalgam & Composite Restorations [2] 82.2 79.2 10 yrs 91.7 89.6 5 yrs 0 20 40 60 Survival rate (%) Composite Amalgam 80 100
  • 22.
    Patient factors influenceon restoration failure [7] 32 GDPs were asked to record the reason for placement / replacement of 3196 restorations from a list of potential reasons The restoration age, material & class were also recorded Restorations placed: 54% amalgam, 32% composite, 8% compomer, 7% glass ionomer Reasons for placement / replacement: 29% secondary caries, 28% primary caries, 10% margin fracture, 7% tooth fracture, 6% non-carious defects Mean age of restorations at failure = 7.1 years
  • 23.
    How long dodirect restorations last? [8] Burke, F. and Lucarotti, P. (2008) Data from 503,965 restoration placements were obtained from 80,000 adult patients (46% male, 54% female) Summary: Single surface amalgams have better survival rates than class II restorations 10 Year Survival of Amalgam Restorations
  • 24.
    How long dodirect restorations last? [8] Burke, F. and Lucarotti, P. (2008) Summary: Older patients have restorations with a shorter interval to reintervention 10 Year Survival of Restorations by Patient Age
  • 25.
    Reasons for resin composite replacement: Percentage Burke etal. 2001 [9] 100 90 80 70 60 50 40 30 20 10 0 Secondary Caries Fractured Restoration Lost Restoration Wear Sensitivity Resin Composite Amalgam Pulpal Pain
  • 26.
    Selection of dentalmaterials & longevity of replaced restorations in Sweden [10] High caries risk patients  shorter longevity for resin based composites vs. low / moderate risk patients due to recurrent caries Larger restorations  show greater failure rates (class II = the most frequently replaced cavity) Restorations replaced by more experienced dentists are shown to have significantly longer longevity Longevity of restorations depends on: - Operator experience, patient caries risk, material characteristics Research suggests: Composites longevity is 6 years & amalgams longevity is 16 years
  • 27.
    A 24-month Evaluationof Amalgam and Resin-Based Composite Restorations [11] 226 practitioners; 6,218 direct restorations. • 386 restorations failed (6.2 %) during the following 23.7 months Number of tooth surfaces restored helped predict subsequent restoration failure … restorations with 4 or more restored surfaces were more than 4 times more likely to fail Restorative material and tooth type were not associated significantly with longevity Older patient age was associated highly with failure (P<0.001). Failure rate for children was 4 percent, compared with 10 percent for people 65 years or older
  • 28.
    Conclusion Correctly performed amalgam restorationsin posterior teeth have higher longevity than resin composites These differences are more pronounced when: -The cavity is larger & -There are multiple surfaces involved [1] Annual failure rates in posterior stress-bearing restorations are: 0% to 7% for amalgam restorations 0% to 9% for direct composites [12]
  • 29.
    References       1. Soares AC,Cavalheiro A. A review of Amalgam and Composite Longevity of Posterior Restorations. Rev Port Estomatol Med Dent Cir Maxilofac 2010;51:155-164 2. Is it the end of the road for dental amalgam? A critical review. J Conserv Dent. 2008 Jul-Sep; 11(3): 99–107. 3. Wilson NHF, Burke FJT, Mjo¨r IA. Reasons for placement and replacement of restorations of direct restorative materials by a selected group of practitioners in the United Kingdom. Quintessence International 1997;28:245–8. 4. Kopperud SE, Tveit AB, Gaarden T, Sandvik L, Espelid I. Longevity of posterior dental restorations and reasons for failure. European Journal of Oral Sciences 2012; 120: 539–548. 5. Pallesen U, Van Dijken JWV, Halken J, Hallonsten AL, Ho¨igaard R. Longevity of posterior resin composite restorations in permanent teeth in Public Dental Health Service: A prospective 8 years follow up. Journal of dentistry 41 (2013) 297–306 6. Overton JD, Sullivan DJ. Early Failure of Class II Resin Composite Versus Class II Amalgam Restorations Placed by Dental Students. Journal of Dental Education March 1, 2012 vol. 76 no. 3 338-340.
  • 30.
    References       7. Elliot, A.(2008) The Risk of Failure is Higher for Composites than for Amalgam Restoration. Journal of Evidence Based Dental Practice. Volume 8, Issue 2: Pages 83-84. 8. Burke, F. and Lucarotti, P. (2008) How long do direct restorations placed within the general dental services in England and Wales survive? British Dental Journal 206 9. Burke FJT, Wilson NHF, Cheung SW, Mjo¨r IA. Influence of patient factors on age of restorations at failure and reasons for their placement and replacement. Journal of Dentistry 2001;29:317–24. 10. Sunnegardh-Gronberg K, Van Dijken J, Funegard U et al. Selection of dental materials and longevity of replaced restorations in Public Dental Health clinics in northern Sweden. Journal of dentistry 2009; 37 (9), pp. 673--678. 11. McCracken MS, Gordan VV, Litaker MS et al. A 24-month evaluation of amalgam and resin-based composite restorations. JADA 2013; 144, 583-593 12. Hickel R, Manhart J. Longevity of restorations in posterior teeth and reasons for failure. J Adhes Dent 2001;3(1):45–64.